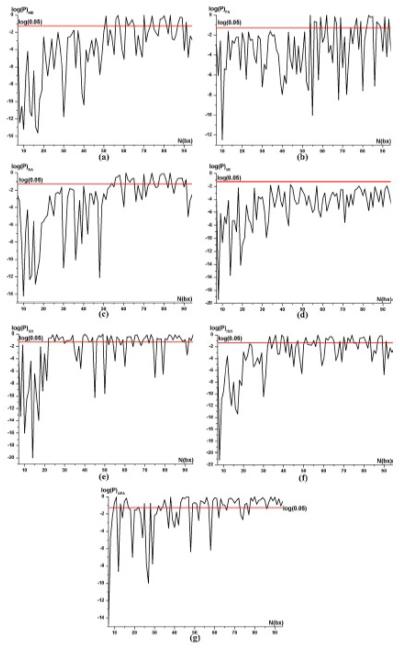
Figure 5. Effects on SNR of Adding More Gradients.
Paired t test results for (a) MD, (b) FA, (c) GA, (d) tGA, (e) RA, (f) VR, and (g) GFA. These plots, for each DTI-derived parameter, are designed to show whether adding one more gradient is beneficial to the SNR. The horizontal axis shows the number of diffusion-sensitized gradients. The effects of adding one additional gradient are assessed using a paired t test on gradient subsets of size N and N-1, so the horizontal scale runs from 7 to 94, except in the case of GFA, where it runs from 29 to 94.The vertical axis shows the logarithm of the probability that such a t value would be obtained by chance; values below the red line mean that there was some evidence that adding one more gradient provided some incremental value. The black curve is the logarithm of probability for (SNRN>SNRN-1) and the red line is the logarithm of 0.05, which we set as the threshold in our study. If the black curve is below the red curve, SNR significantly increases when increasing the number of gradients, N(bx), from N-1 to N. If an incremental improvement in SNR can be shown for the Nth added gradient, usually it is also true for all prior gradients; even so, whether there is power to detect this depends on the population variability in SNR, which is erratic for GFA when N is low. In these experiments, it is useful to know what is the minimal % difference in SNR that is detectable, with 50 subjects, at the point where adding one more gradient makes no difference. This was 0.0023% for MD, 0.0069% for FA, 0.0063% for RA, 0.0069% for GA, 0.0001% for tGA, and 0.018% for VR. While these numbers at first sight seem remarkably small, we note that the paired t-test is set up to assess the effect of adding one more gradient on the mean SNR in 50 subjects, and the pairing (and the fact that inter-subject variance has very little influence) leads to extremely high power. So, even very small increments in SNR can be detected using this approach.

