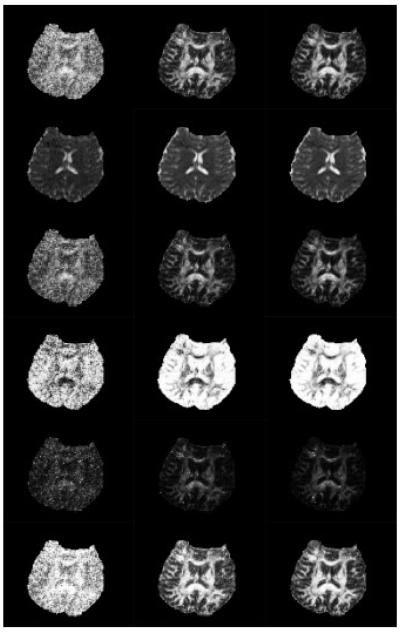
Figure 6.
SNR increases for all 6 DTI-derived scalar measures as the number of HARDI gradients is steadily increased. Rows 1-6 show axial slices through the FA map, MD map, RA map, VR map, GA map and tGA map. Column 1 is computed from HARDI17 (i.e., the 11 b0 and 6 non-b0 images), Column 2 is from HARDI38 (i.e., 27 non-b0 images), and Column 3 is from HARDI105 (the full protocol of 94 non-b0 images).

