

Abstract
Purpose
Although fine-needle aspiration biopsy is the most useful diagnostic tool in evaluating a thyroid nodule, preoperative diagnosis of thyroid nodules is frequently imprecise, with up to 30% of fine-needle aspiration biopsy cytology samples reported as “suspicious” or “indeterminate.” Therefore, other adjuncts, such as molecular-based diagnostic approaches are needed in the preoperative distinction of these lesions.
Experimental Design
In an attempt to identify diagnostic markers for the preoperative distinction of these lesions, we chose to study by microarray analysis the eight different thyroid tumor subtypes that can present a diagnostic challenge to the clinician.
Results
Our microarray-based analysis of 94 thyroid tumors identified 75 genes that are differentially expressed between benign and malignant tumor subtypes. Of these, 33 were overexpressed and 42 were underexpressed in malignant compared with benign thyroid tumors. Statistical analysis of these genes, using nearest-neighbor classification, showed a 73% sensitivity and 82% specificity in predicting malignancy. Real-time reverse transcription – PCR validation for 12 of these genes was confirmatory. Western blot and immunohistochemical analyses of one of the genes, high mobility group AT-hook 2, further validated the microarray and real-time reverse transcription – PCR data.
Conclusions
Our results suggest that these 12 genes could be useful in the development of a panel of markers to differentiate benign from malignant tumors and thus serve as an important first step in solving the clinical problem associated with suspicious thyroid lesions.
Thyroid cancer represents 90% of all endocrine malignancies with an estimated annual incidence of 122,800 cases worldwide (1). Although thyroid cancer constitutes one of the most curable cancers, the differential diagnosis can often be elusive. Fine-needle aspiration biopsy (FNA) is the most useful diagnostic tool in the clinical evaluation of thyroid nodules. However, due to overlapping morphologic features on cytologic review, 15% to 30% of FNAs decrease into the “indeterminate” or “suspicious” category. Thus, the assignment of individual thyroid nodules to a benign or malignant category is often challenging to the cytopathologist. The cytology of suspicious lesions is generally reported as suspicious for papillary cancer or follicular variant of papillary thyroid cancer, follicular or Hürthle cell neoplasm, or with cellular atypia. Based on our clinical experience in examining suspicious FNA samples and corresponding final histopathology,5 there are eight tumor subtypes that can be associated with suspicious FNA cytology, including four benign (adenomatoid nodule, follicular adenoma, Hürthle cell adenoma, and lymphocytic thyroiditis nodule) and four malignant (papillary thyroid carcinoma, follicular variant of papillary thyroid carcinoma, follicular carcinoma, and Hürthle cell carcinoma) subtypes. Although certain features, such as patient age, gender, size of the nodule, cytologic atypia, or features on ultrasound, are associated with malignancy, the specificity of these features is too low to be clinically useful (2, 3). Compounding this problem, the surgical management of a benign compared with a malignant thyroid nodule differs substantially. Therefore, identification of additional markers of thyroid malignancy is necessary to optimize the accuracy of the differential diagnosis and thereby improve the clinical care of patients who present with suspicious thyroid lesions.
Recent advances in microarray technology have created the ability to molecularly classify large numbers of tumor samples. Applications of this technology have included tumor subclassification, prediction of response to treatment regimens, as well as patient outcomes (4, 5). Several investigators have used microarray technology to study the expression profiles and to identify molecular markers for thyroid malignancy (6–9). However, none of the studies undertaken to date have included all eight thyroid tumor subtypes that can be associated with a suspicious FNA samples. To further expand upon these investigations, we therefore chose to examine all eight subtypes by microarray analysis to identify differentiating molecular markers.
Materials and Methods
Tumor specimens
A total of 125 thyroid tumor samples were collected from patients who underwent thyroidectomy at Johns Hopkins Medical Institutions between 2000 and 2005. All samples were collected with Institutional Review Board approval. After surgical excision, the tumor samples were snap frozen in liquid nitrogen and stored at -80°C until use. The specimens included 70 benign tumors (20 adenomatoid nodules, 20 follicular adenomas, 17 Hürthle cell adenomas, and 13 lymphocytic thyroiditis nodules) and 55 malignant tumors (19 papillary thyroid carcinomas, 16 follicular variant of papillary thyroid carcinomas, 14 follicular carcinomas, and 6 Hürthle cell carcinomas). Each sample was obtained from the center of the tumor.
RNA isolation
Fresh frozen sections were reviewed by a pathologist to verify the presence of tumor before tissue processing and RNA extraction. Total RNA was isolated from 50 and 75 mg of each tumor using TRIzol reagent (Invitrogen) and purified with the RNeasy kit (Qiagen). The quantity and the integrity of extracted RNA was determined by ND-1000 Spectrometer (Nanodrop Technologies) and Bioanalyzer Nano Labchips (Agilent Technologies), respectively. RNA that included 56 pooled normal thyroid specimens was used as control (Clontech).
cRNA synthesis, labeling, and microarray hybridization
One microgram of total RNA from each sample was subjected to single round amplification using Aminoallyl MessageAmpTM II aRNA Amplification kit (Ambion, Inc.). After amplification, 5 Ag of aminoallyl RNA was labeled using a Cy-dye coupling method according to the manufacturer's instructions. Both Cy5-labeled tumor cRNA and Cy3-labeled control cRNA were hybridized to a 34K human oligonucleotide array produced by the National Cancer Institute microarray facility.6 Microarray hybridization, washing, and scanning (GenePix 4000B) were done as described in the National Cancer Institute protocol.7 To test for labeling bias, 10 representative tumor samples were used in dye swap experiments. Dye swap experiments were done with Cy5-labeled control cRNA and Cy3-labeled tumor cRNA.
Bioinformatics and statistical analysis
After image analysis using GenePix Pro 5.0, raw data from all 125 arrays were arranged in mAdb8 and then exported for further analysis with BRB ArrayTools (10).
For each array, global normalization was done to median of the center of the log ratios to adjust for differences in labeling intensities of the Cy3 and Cy5 dyes. Genes exhibiting minimal variation across the set of arrays from different tumor subtypes were excluded, and only genes exhibiting expression differences of at least 1.5-fold from the median in at least 20% of the arrays were retained for analysis.
Class comparison
Genes that were differentially expressed between malignant and benign thyroid tumors were identified using a random-variance t test (11). To limit the number of false positives, genes were included only if their P value was <0.001. We also did a global test of whether the expression profiles differed between benign and malignant by permuting (1,000 times) the labels of which array corresponded to which category. For each permutation, the P values were recomputed and the number of significant genes (P ≤ 0.001) was noted. The proportion of permutations that resulted in at least as many genes as with the actual data was the significance level of the global test.
Class prediction
We developed models that used gene expression profiles to predict class of tumors (benign versus malignant). The models were based on several classification methods: compound covariate predictor (12), diagonal linear discriminant analysis (13), nearest-neighbor classification (13), and support vector machines with linear kernel (14). Genes that were differentially expressed (P ≤ 0.001) were then incorporated into these models (11). We estimated the prediction error for each model using leave-one-out cross-validation. For each leave-one-out cross-validation set, the entire model was recreated, including the gene selection process. We also evaluated whether the cross-validated error rate for any given model was significantly less than what one would expect from random prediction. Class labels were randomly permuted, and the entire leave-one-out cross-validation process was repeated 1,000 times. The significance level was the proportion of the random permutations that gave a cross-validated error rate no greater than the rate obtained with the real data.
Real-time reverse transcription–PCR
To validate the genes found to be significantly differentially expressed, real-time reverse transcription–PCR (RT-PCR) was done on a subset of 76 tumors that were available from the original array analysis, as well as on a new set of 31 tumors. cDNA was synthesized in a 50 AL reverse transcription reaction mixture that contained 3 Ag total RNA from each tumor. After optimization for each primer pair, real-time PCR assays were done on iQTM5 real-time PCR detection system (Bio-Rad Laboratories, Inc.) according to the manufacturer's recommendations. Briefly, 1 μL of cDNA was used in a 25-μL reaction mixture that contained an optimal concentration (150-250 nmol/L) of primers and SYBR-Green Supermix. The thermal profile for PCR consisted of Taq-polymerase activation at 95°C for 3 min, followed by 40 cycles of PCR at 95°C for 20 s (denaturation), 55°C for 30 s (annealing), and 72°C for 60 s (extension). An average Ct (threshold cycle) from duplicate assays was used for further calculation, and glyceraldehyde-3-phosphate dehydrogenase (GAPDH)–normalized gene expression was determined using the relative quantification method as formulated below. Results were expressed as the median of three to four independent measurements.
Western blot analysis
Total cellular proteins were extracted from thyroid tumors and their matching normal thyroid tissues. Tissues (20-25 mg) were ground and lysed in 250 μL ice-cold M-PER lysis buffer (Pierce) supplemented with a protease inhibitor cocktail for 60 min at 4°C. Supernatants were collected after centrifugation at 11,600 × g at 4°C, and protein concentration was measured. Protein samples, loaded at 40 μg/lane, were separated by 10% SDS-PAGE gels as described elsewhere. After transfer to a polyvinylidene diflouride membrane, both transfer efficiency and protein loads were checked by Ponceau S solution (Sigma). Specific proteins were probed with anti–high mobility group AT-hook 2 (HMGA2) antibody (Santa Cruz Biotechnology, Inc.).
Tissue array
A total of 87 formalin-fixed, paraffin-embedded thyroid specimens from 87 different individuals were selected from the surgical pathology archives of the Johns Hopkins Hospital, including classic papillary thyroid carcinoma (n = 20), follicular variant of papillary thyroid carcinoma (n = 9), follicular carcinoma (n = 14), lymphocytic thyroiditis nodules (n = 11), follicular adenoma (n = 14), and normal thyroid adjacent to tumor (n = 19). These cases were different than those used for the gene expression analysis. Each case was reviewed by a pathologist (D.P.C.) to confirm the diagnosis and select appropriate areas for inclusion in the tissue array. For follicular variant of papillary thyroid carcinoma, cores from areas within the tumor displaying florid nuclear features of papillary thyroid carcinoma and follicular architecture were chosen for the tissue array. Tissue cores (0.6-mm diameter) from selected areas were obtained using a manual Tissue Puncher/Arrayer (Beecher Instruments) and a high-density tissue array was generated as previously described (15). In addition to thyroid tumors, each tissue array block had nine cylinders from nonthyroid control tissues. Five-micron sections were cut, and one H&E-stained slide was examined to verify the presence of diagnostic cells.
Immunohistochemistry
H&E staining and immunohistochemistry were done on 4-μm to 5-μm sections of formalin-fixed paraffin-embeded thyroid tissues that include 87 specimens on tissue array (68 tumors + 19 normal thyroids) and 38 nonarrayed individual thyroid tumor specimens. Overall, these samples included 25 follicular adenomas, 10 adenomatoid nodules, 11 lymphocytic thyroiditis nodules, 14 follicular carcinomas, 16 follicular variant of papillary thyroid carcinomas, 30 papillary thyroid carcinomas, and 19 normal thyroids. Briefly, sections were deparaffinized in xylene and rehydrated through a series of alcohol gradients. Antigen retrieval was achieved by heating in citrate buffer at pH 6.0. Endogenous peroxidase activity was quenched in 3% hydrogen peroxide and nonspecific binding of secondary antibody blocked by incubation with normal horse serum. Individual sections were incubated with anti-HMGA2 goat polyclonal antibodies overnight at 4°C. Conditions omitting primary antibody were used as negative controls. A streptavidin-biotin peroxidase detection system was used in accordance with the manufacturer's instructions and then developed using 3,3′-diaminobenzidine (Vector Laboratories, Inc.). Sections were counterstained with H&E. Formalin-fixed paraffin-embedded cellblock sections of the lung cancer cell line H1299 (American Type Culture Collection) were used as positive controls.
HMGA2 expression documented by immunohistochemistry was scored by manual microscopic examination based on the following criteria: (a) high expression (moderate to intense nuclear staining within >66% of tumor cells), (b) moderate expression (moderate to intense nuclear staining within 33-66% of tumor cells), (c) low expression (low to moderate nuclear expression in <33% of cells), and (d) negative (no nuclear expression).
Results
Microarray and statistical analysis
Ninety-four unique thyroid samples representing the eight different thyroid tumor subtypes were used for microarray analysis. The specimens included 50 benign tumors (13 adenomatoid nodules, 13 follicular adenomas, 13 Hürthle cell adenomas, and 11 lymphocytic thyroiditis nodules) and 44 malignant tumors (13 papillary thyroid carcinomas, 13 follicular variant of papillary thyroid carcinomas, 13 follicular carcinomas, and 5 Hürthle cell carcinomas). Several of these tumors were used more than once for the analysis, resulting in 128 arrays (Supplementary Table S1).
After the expression data from replicate samples were averaged, 15,745 genes met criteria for inclusion in the analysis by BRB ArrayTools. By using a random-variance t test, the class comparison (benign versus malignant) analysis identified 75 genes that were significantly (P ≤ 0.001) differentially expressed between malignant and benign tumor types. Of these 75 differentially expressed genes, 33 were overexpressed (Table 1) and 42 were underexpressed (Table 2) in malignant thyroid tumors compared with benign. Principal component analysis of the 94 samples showed a clear organization of the samples based on diagnosis (Supplementary Fig. S1).
Table 1. Genes overexpressed in malignant thyroid tumors identified by microarray analysis.
| Description | UG cluster | Gene symbol* | Parametric P value | Ratio † M/B | |
|---|---|---|---|---|---|
| High mobility group AT-hook 2, transcript variant 1 | ‡ | Hs.505924 | HMGA2 | 0.0001597 | 2.6 |
| Kallikrein 7 (chymotryptic, stratum corneum), transcript variant 1 | Hs.151254 | KLK7 | 0.0002012 | 2.5 | |
| Mannose receptor, C type 2 | Hs.7835 | MRC2 | <1e-07 | 2.5 | |
| Leucine-rich repeat kinase 2 | ‡ | Hs.187636 | LRRK2 | 3.46e-05 | 2.2 |
| Pleiomorphic adenoma gene 1 | ‡ | Hs. 14968 | PLAG1 | 0.0002047 | 2.2 |
| Cytochrome P450, family 1, subfamily B, polypeptide 1 | Hs.154654 | CYP1B1 | 0.0003485 | 2.0 | |
| Dipeptidyl-peptidase 4 (CD26, adenosine deaminase complexing protein 2) | ‡ | Hs.368912 | DPP4 | 0.0006842 | 1.9 |
| Fibronectin type III domain containing 4 | Hs.27836 | FNDC4 | 3.30e-05 | 1.9 | |
| Pleckstrin homology-like domain, family A, member 2 | Hs.154036 | PHLDA2 | 6.00e-07 | 1.9 | |
| Cyclin A1 | Hs.417050 | CCNA1 | 8.08e-05 | 1.8 | |
| Cadherin 3, type 1, P-cadherin (placental) | ‡ | Hs.554598 | CDH3 | 1.10e-06 | 1.8 |
| Carcinoembryonic antigen-related cell adhesion molecule 6 (nonspecific cross-reacting antigen) | ‡ | Hs.466814 | CEACAM6 | 0.0001172 | 1.8 |
| Quiescin Q6 | Hs.518374 | QSCN6 | <1e-07 | 1.7 | |
| Collagen, type VII, a 1 (epidermolysis bullosa, dystrophic, dominant and recessive) | Hs.476218 | COL7A1 | 3.24e-05 | 1.7 | |
| Hypothetical protein MGC9712 | Hs.592174 | MGC9712 | 6.39e-05 | 1.7 | |
| Interleukin 1 receptor accessory protein, transcript variant 1 | Hs.478673 | IL1RAP | 9.68e-05 | 1.7 | |
| Laminin, β3, transcript variant 1 | Hs.497636 | LAMB3 | 0.0001874 | 1.7 | |
| Protease, serine, 3 (mesotrypsin) | ‡ | Hs.128013 | PRSS3 | 6.50e-06 | 1.7 |
| Low density lipoprotein receptor-related protein 4 | Hs.4930 | LRP4 | 0.0001359 | 1.6 | |
| Sparc/osteonectin, cwcv and kazal-like domains proteoglycan (testican) 1 | ‡ | Hs.124611 | SPOCK1 | 0.0001704 | 1.6 |
| Phosphodiesterase 5 A, cGMP-specific, transcript variant 3 | ‡ | Hs.370661 | PDE5A | 2.07e-05 | 1.6 |
| Hypothetical protein FLJ37078 | Hs.511025 | FLJ37078 | 0.000106 | 1.6 | |
| Fibrillin 3 | Hs.370362 | FBN3 | 0.0007772 | 1.6 | |
| DIRAS family, GTP-binding RAS-like 3 | Hs.194695 | DIRAS3 | 0.0001982 | 1.6 | |
| Protease, serine, 1 (trypsin 1) | Hs.511522 | PRSS1 | 0.0002246 | 1.6 | |
| Calcium/calmodulin-dependent protein kinase II inhibitor 1 | Hs.197922 | CAMK2N1 | 0.0005162 | 1.6 | |
| SNAP25-interacting protein | Hs.448872 | SNIP | 0.0001026 | 1.6 | |
| Potassium inwardly-rectifying channel, subfamily J, member 2 | Hs.1547 | KCNJ2 | 0.0001192 | 1.6 | |
| Stratifin | Hs.523718 | SFN | 3.23e-05 | 1.5 | |
| UDP-N-acetyl-α-d-galactosamine:polypeptide N-acetylgalactosaminyltransferase 7 | Hs.127407 | GALNT7 | 0.0002068 | 1.5 | |
| Transforming growth factor, α | Hs.170009 | TGFA | 0.0003326 | 1.5 | |
| BAI1-associated protein 3 | Hs.458427 | BAIAP3 | 4.13e-05 | 1.5 | |
| Potassium channel, subfamily K, member 15 | Hs.528664 | KCNK15 | 0.0001188 | 1.5 |
HUGO abbreviations used in Locus Link.
The ratio between Geo mean expression values of malignant to benign thyroid tumors (P ≤ 0.001).
Genes validated by real-time RT-PCR.
Table 2. Genes underexpressed in malignant thyroid tumors identified by microarray analysis.
| Description | UG cluster | Gene symbol* | Parametric P value | Ratio† M/B | |
|---|---|---|---|---|---|
| Recombination activating gene 2 | ‡ | Hs.159376 | RAG2 | 1.32e-05 | 0.41 |
| Citrate lyase β-like, transcript variant 1 | Hs.130690 | CLYBL | 1.43e-05 | 0.44 | |
| Nebulin | Hs.588655 | NEB | 0.0002811 | 0.53 | |
| Tumor necrosis factor receptor superfamily, member 11b (osteoprotegerin) | Hs.81791 | TNFRSF11B | 4.50e-06 | 0.54 | |
| Guanine nucleotide binding protein (G protein), α inhibiting activity polypeptide 1 | Hs.134587 | GNAI1 | 4.33e-05 | 0.55 | |
| Angiotensin II receptor, type 1, transcript variant 5 | ‡ | Hs.477887 | AGTR1 | 4.28e-05 | 0.56 |
| Hepatic leukemia factor | Hs.196952 | HLF | 1.40e-06 | 0.57 | |
| Solute carrier family 26, member 4 | Hs.571246 | SLC26A4 | 1.00e-07 | 0.58 | |
| Metallothionein 1A (functional) | Hs.643532 | MT1A | 0.0004668 | 0.59 | |
| Fatty acid binding protein 4, adipocyte | Hs.391561 | FABP4 | 4.38e-05 | 0.60 | |
| Low density lipoprotein-related protein 1B (deleted in tumors) | Hs.470117 | LRP1B | 0.0003571 | 0.60 | |
| Solute carrier family 4, sodium bicarbonate cotransporter, member 4 | Hs.5462 | SLC4A4 | 0.0002522 | 0.61 | |
| PREDICTED: similar to programmed cell death 6 interacting protein, transcript variant 2 | Hs.597835 | LOC646278 | 0.0001965 | 0.61 | |
| Mannosidase, a, class 1C, member 1 | Hs.197043 | MAN1C1 | 9.46e-05 | 0.61 | |
| Kv channel interacting protein 3, calsenilin, transcript variant 2 | Hs.437376 | KCNIP3 | 1.12e-05 | 0.62 | |
| DnaJ (Hsp40) homologue, subfamily B, member 9 | Hs.6790 | DNAJB9 | 5.10e-06 | 0.62 | |
| Ubiquitin protein ligase E3 component n-recognin 1 | Hs.591121 | UBR1 | 0.000166 | 0.62 | |
| Hydroxysteroid (17-β) dehydrogenase 6 | Hs.524513 | HSD17B6 | 0.0002557 | 0.62 | |
| Solute carrier family 33 (acetyl-CoA transporter), member 1 | Hs.478031 | SLC33A1 | 2.49e-05 | 0.63 | |
| Cadherin 16, KSP-cadherin | Hs.513660 | CDH16 | 0.0007068 | 0.63 | |
| TBC1 (tre-2/USP6, BUB2, cdc16) domain family, member 1 | Hs.176503 | TBC1D1 | 8.00e-07 | 0.63 | |
| Solute carrier family 26, member 7, transcript variant 1 | Hs.354013 | SLC26A7 | 2.18e-05 | 0.63 | |
| Chromosome 11 open reading frame 74 | Hs.406726 | C11orf74 | 1.40e-06 | 0.63 | |
| Phospholipase A2 receptor 1, 180 kDa | Hs.410477 | PLA2R1 | 0.0001771 | 0.64 | |
| Pituitary tumor-transforming 3 on chromosome 8. | PTTG3 | 5.00e-07 | 0.64 | ||
| EGF-containing fibulin-like extracellular matrix protein 1, transcript variant 3 | Hs.76224 | EFEMP1 | 1.17e-05 | 0.64 | |
| Zinc finger, matrin type 4 | Hs.591850 | ZMAT4 | 7.03e-05 | 0.64 | |
| STEAP family member 3 | Hs.642719 | STEAP3 | 0.0002097 | 0.64 | |
| Deiodinase, iodothyronine, type I, transcript variant 4 | Hs.251415 | DIO1 | 0.0007362 | 0.64 | |
| v-Kit Hardy-Zuckerman 4 feline sarcoma viral oncogene homologue | Hs.479754 | KIT | 8.16e-05 | 0.65 | |
| Thyroid peroxidase, transcript variant 5 | ‡ | Hs.467554 | TPO | 9.70e-06 | 0.65 |
| Pituitary tumor-transforming 1 | Hs.350966 | PTTG1 | 6.00e-07 | 0.65 | |
| Leucine-rich repeat LGI family, member 3 | Hs.33470 | LGI3 | 4.00e-05 | 0.65 | |
| Transmembrane protein 38B | Hs.411925 | TMEM38B | 0.0001833 | 0.65 | |
| SLIT and NTRK-like family, member 4 | Hs.272284 | SLITRK4 | 7.75e-05 | 0.65 | |
| Von Hippel-Lindau binding protein 1 | Hs.436803 | VBP1 | 7.04e-05 | 0.65 | |
| Collagen, type IX, α 3 | Hs.126248 | COL9A3 | 0.0009987 | 0.65 | |
| Insulin receptor substrate 1 | Hs.471508 | IRS1 | 6.00e-06 | 0.66 | |
| START domain containing 13, transcript variant γ | Hs.507704 | STARD13 | 0.0001052 | 0.66 | |
| PREDICTED: similar to glycine cleavage system H protein, mitochondrial precursor, variant 1 | LOC654085 | 9.60e-06 | 0.66 | ||
| Ribosomal protein S3A | Hs.356572 | RPS3A | 0.0004627 | 0.66 | |
| SPARC-like 1 (mast9, hevin) | Hs.62886 | SPARCL1 | 7.61e-05 | 0.66 |
HUGO abbreviations used in Locus Link.
The ratio between Geo mean expression values of malignant to benign thyroid tumors (P ≤ 0.001).
Genes validated by real-time RT-PCR.
We further developed additional models using gene expression data to predict and cross-validate the samples. In addition to this, we evaluated whether the estimated error rate (cross-validated) for each model was significantly less than one would expect from random prediction. Statistical analysis using 1 -nearest-neighbor classification provided the best results and showed a 73% sensitivity, 82% specificity, and 78% positive predictive value for the prediction of malignancy (Supplementary Table S2).
RT-PCR analysis
To validate the authenticity of the micro-array data, we first did RT-PCR analysis of two genes [HMGA2 and pleomorphic adenoma gene 1 (PLAG1)] using 11 follicular adenomas, 10 adenomatoid nodules, 10 papillary thyroid carcinomas, and 7 follicular variant of papillary thyroid carcinomas (Fig. 1). These representative tumor samples were also used in the microarray analysis. As shown in Fig. 1A, the expression levels of both HMGA2 and PLAG1 were found to be very high in most of the malignant tumors (papillary and follicular variant of papillary thyroid carcinoma). In contrast, all benign tumors (follicular adenomas and adenomatoid nodules) exhibited no detectable levels of either HMGA2 or PLAG1 even after extending the PCR cycles to 40, with the exception of one of the benign tumors (adenomatoid nodule; AN4) that showed appreciable levels of HMGA2 expression (Fig. 1B).
Fig. 1.
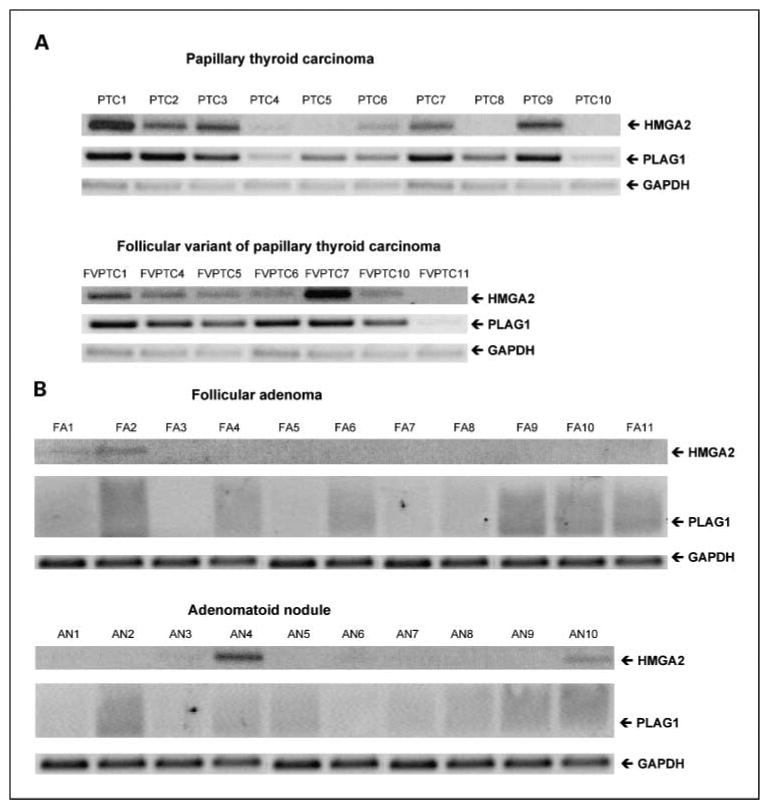
RT-PCR analysis of HMGA2 and PLAG1 in thyroid tumors. The mRNA expression of both HMGA2 and PLAG1 in malignant [A, papillary thyroid carcinoma (PTC; n = 10) and follicular variant of papillary thyroid carcinoma (FVPTC; n = 7)] and benign [B, follicular adenoma (FA; n = 11) and adenomatoid nodule (AN; n = 10)] was determined by RT-PCR. GAPDH expression after 22 PCR cycles and 35 PCR cycles served as a loading control for malignant and benign tumors, respectively. Note: with the exception of one adenomatoid nodule (AN4) the benign tumors exhibited no detectable levels of HMGA2 or PLAG1. Only a smear was found after extending the PCR cycles to 40.
We further did real-time RT-PCR analysis of six genes [sparc/osteonectin CWCV and kazal-like domain proteoglycan (SPOCK1), carcinoembryonic antigen–related cell adhesion molecule 6 (CEA-CAM6), protease serine 3 (PRSS3/mesotrypsin), phosphodiesterase 5A (PDE5A), leucine-rich repeat kinase 2 (LRRK2), and thyroid peroxidase (TPO5)] using RNA from 76 of the original tumor set used in the microarray analysis. The expected differential expression was confirmed in five of six genes (Fig. 2). SPOCK1, CEACAM6, PRSS3, and LRRK2 were overexpressed in malignant compared with the benign tumor subtypes (Table 2; Fig. 2). TPO5 was underexpressed in the majority of the malignant subtypes (Table 1; Fig. 2). Although we did not see any significant difference between benign versus malignant tumors, the papillary thyroid cancers exhibited elevated levels of PDE5A compared with all other subtypes (Fig. 2).
Fig. 2.
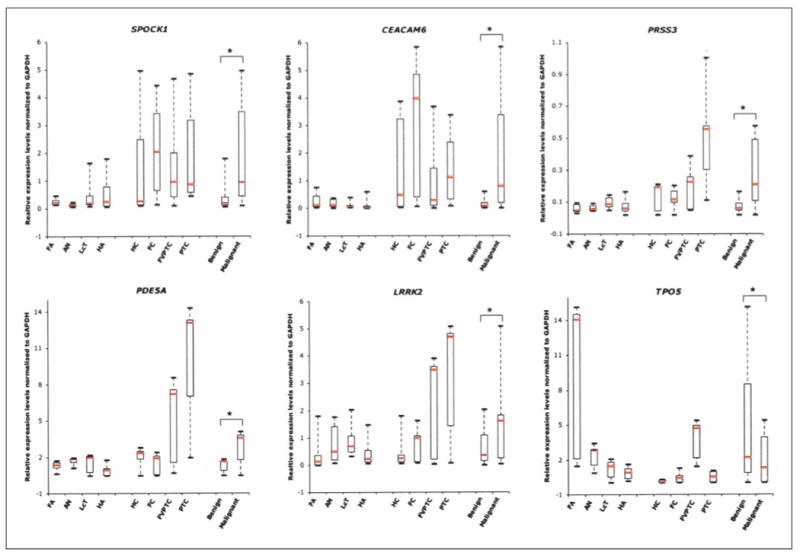
Real-time RT-PCR validation of six genes (SPOCK1, CEACAM6, PRSS3, PDE5A, LRRK2, and TPO5) using 76 tumors from the original set of microarray samples. Relative gene expression levels normalized to GAPDH in 41 benign [follicular adenomas (n = 11), adenomatoid nodules (n = 10), lymphocytic thyroiditis nodules (LcT; n = 10), and Hürthle cell adenomas (HA; n = 10)] and 35 malignant [Hürthle cell carcinomas (HC; n = 5), follicular carcinomas (n = 10), follicular variant of papillary thyroid carcinomas (n = 10), and papillary thyroid carcinomas (n = 10)] tumors were determined using gene-specific primers as described in Materials and Methods. The upper and lower limits of each box represent “third” and “first” quartiles, respectively. Red lines, medians; whiskers, extreme measurements; *, P < 0.001 by two-tailed t test between benign and malignant tumor types. Note: as expected from the microarray analysis, SPOCK1, CEACAM6, PRSS3, and LRRK2 are overexpressed and TPO5 is underexpressed in malignant tumors compared with benign.
In addition to the original set of tumor samples, a new set of 31 thyroid tumors was also used for validation by real-time RT-PCR. The new set of samples had not been used for the microarray analysis and was used to validate the following six genes: dipeptidyl-peptidase 4 (DPP4), cadherin 3 type1 (CDH3), recombination activating gene2 (RAG2), angiotensin II receptor type1 (AGTR1), HMGA2, and PLAG1. Again, all six genes that we analyzed were found to be differentially expressed in benign versus malignant, as expected by the microarray analysis (Fig. 3). Very high expression levels of CDH3, HMGA2, and PLAG1 were observed in all of the malignant subtypes compared with the benign tumors. Indeed, the expression levels of HMGA2 and PLAG1 were quantified this time using a new set of thyroid tumors, and both genes were overexpressed in the majority of malignant compared with benign subtypes. Low expression levels of RAG2 and AGTR1 were documented in all malignant tumors (Table 2; Fig. 3). With the exception of lymphocytic thyroiditis nodules that exhibited very high expression levels of DPP4, the other three benign subtypes (follicular adenomas, adenomatoid nodules, and Hürthle cell adenomas) exhibited very low expression levels compared with malignant tumors (Fig. 3).
Fig. 3.
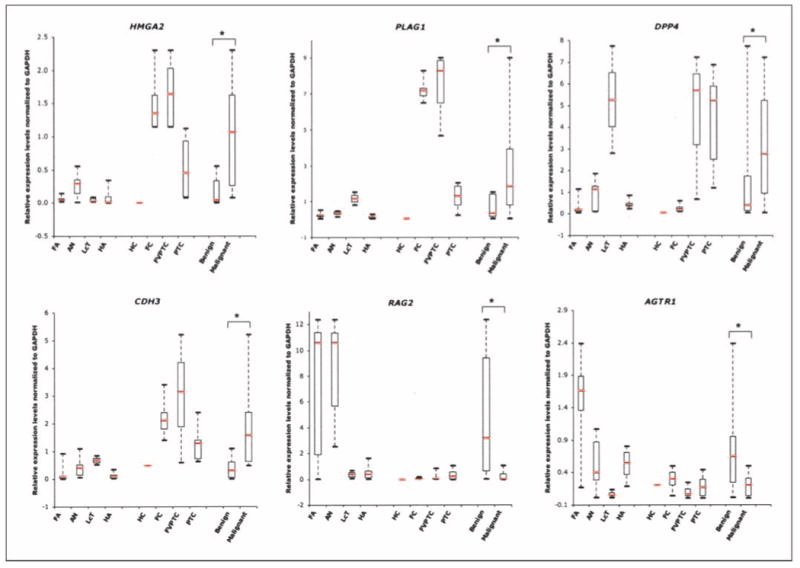
Real-time RT-PCR validation of six genes (HMGA2, PLAG1, DPP4, CDH3, RAG2, and AGTR1) using 31 new thyroid tumors. Relative expression levels normalized to GAPDH in 20 benign [follicular adenomas (n = 7), adenomatoid nodules (n = 7), lymphocytic thyroiditis nodules (n = 2), and Hürthle cell adenomas (n = 4)] and11 malignant [Hürthle cell carcinoma (n = 1), follicular carcinoma (n = 3), follicular variant of papillary thyroid carcinomas (n = 3), and 10 papillary thyroid carcinomas (n = 4)] tumors were determined using gene-specific primers. The upper and lower limits of each box represent “third” and “first” quartiles, respectively. Red lines, medians; whiskers, extreme measurements; *, P < 0.001 by two-tailed t test between benign and malignant tumor-types. Note: as expected from the microarray analysis, HMGA2, PLAG1, and CDH3 are overexpressed, whereas both RAG2 and AGTR1 are underexpressed in malignant tumors compared with benign.
Validation by Western blot and immunohistochemistry analysis
Overexpression of HMGA2 in malignant tumors compared with benign subtypes was further confirmed by Western blot analysis and immunohistochemistry. As assessed by both Western blot analysis and immunohistochemistry, HMGA2 was highly expressed in tumors but not in normal thyroid (Fig. 4). Western blot analysis revealed overall less protein expression in benign compared with malignant tumors (Fig. 4A).
Fig. 4.
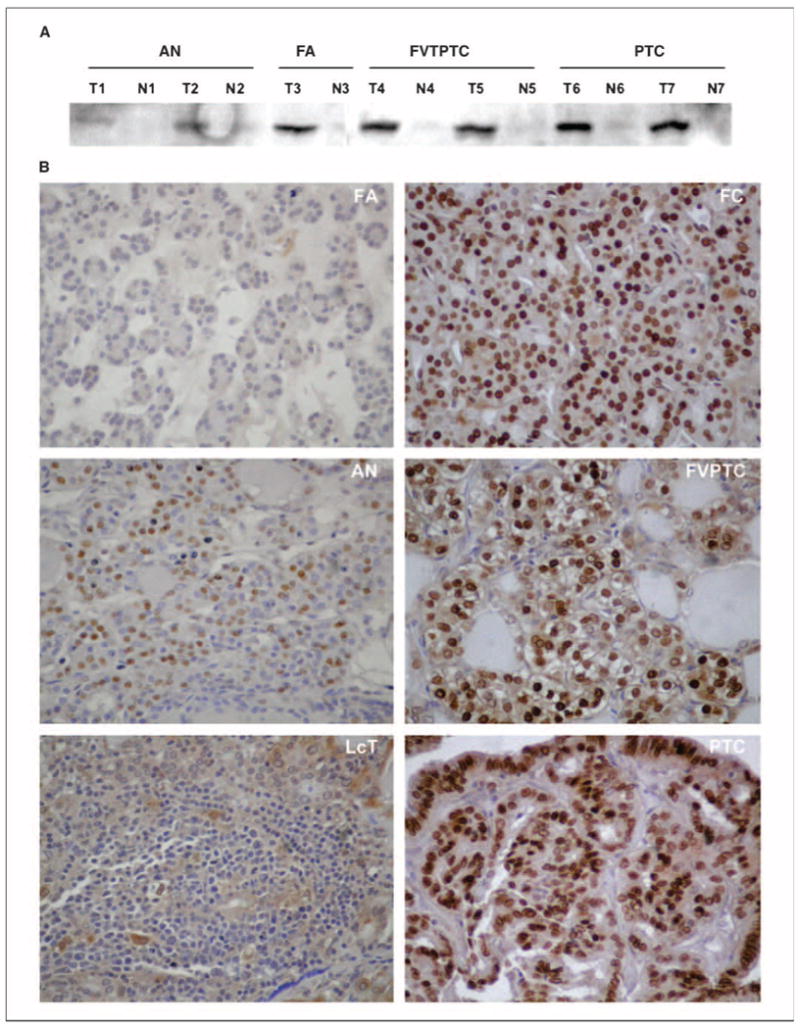
HMGA2 expression in thyroid. A, Western blot analysis of HMGA2 protein expression in thyroid tumors (T1-T7) and in adjacent normal thyroid tissues (N1-N7).The anti-HMGA2 goat polyclonal antibody recognized HMGA2 expression specifically in thyroid tumors but not in adjacent normal thyroid tissue. High protein expression of HMGA2 is detected in malignant tumors (T4,T5,T6,T7) compared with benign tumors (T1,T2,T3). B, immunohistochemistry of HMGA2 in thyroid tumors. Note the intense nuclear staining of most nuclei within the malignant tumors compared with low or negative expression in the benign tumors. No detectable expression was seen in the adjacent normal thyroid tissue. Magnification, 400×.
HMGA2 expression documented by immunohistochemistry was observed in three patterns, (a) high expression, (b) moderate expression, and (c) low expression, as described in Materials and Methods. As shown in Table 3, HMGA2 expression was positive in most of the malignant tumors, including papillary thyroid carcinomas (26 of 30, 87%), follicular variant of papillary thyroid carcinomas (13 of 16, 81%), and follicular carcinomas (11 of 14, 79%). In contrast, most of the benign tumors were negative for HMGA2 expression, including follicular adenomas (22 of 25, 88%), adenomatoid nodules (8 of 10, 80%), and normal thyroid (17 of 19, 89%). Low levels of HMGA2 expression were detected in 6 of 11 (55%) lymphocytic thyroiditis nodules. Representative HMGA2 immunostaining of six thyroid tumors is shown in Fig. 4B.
Table 3. Immunohistochemical evaluation of HMGA2 in thyroid tumors.
| Total | HMGA2 positive | HMGA2 negative* | |||
|---|---|---|---|---|---|
| High† | Moderate‡ | Low§ | |||
| Tissue array samples | 87 | ||||
| Normal thyroid | 19 | – | – | 2 | 17 |
| Follicular adenoma | 14 | – | – | 1 | 13 |
| Lymphocytic thyroiditis nodule | 11 | – | – | 6 | 5 |
| Follicular carcinoma | 14 | 3 | 2 | 5 | 4 |
| Follicular variant of papillary thyroid carcinoma | 9 | 4 | 2 | 1 | 2 |
| Papillary thyroid carcinoma | 20 | 7 | 7 | 4 | 2 |
| Nonarrayed samples | 38 | ||||
| Follicular adenoma | 11 | – | – | 2 | 9 |
| Adenomatoid nodule | 10 | – | 1 | 1 | 8 |
| Follicular variant of papillary thyroid carcinoma | 7 | 4 | 1 | 1 | 1 |
| Papillary thyroid carcinoma | 10 | 5 | 2 | 1 | 2 |
No significant expression.
Expressed in >66% of cell population.
Expressed in 33% to 66% of cell population.
Expressed in <33% of cell population.
Discussion
Microarray technology is a valuable gene detection tool and has been widely used to investigate genetic profiles in many disease conditions, including cancer. In this study, we have used microarray analysis to identify molecular markers that differentiate benign from malignant thyroid neoplasms. An analysis of 94 thyroid samples, representative of eight thyroid tumor subtypes, identified 75 genes that were differentially expressed between benign and malignant tumors (Tables 1 and 2). Our microarray results are consistent with several other studies that investigated only a subset of the eight thyroid tumor types (7, 9, 16). Moreover, RT-PCR validation done on a subset of 12 of the 75 genes further confirmed the differential expression in malignant versus benign tumors. Of the 12 genes that were chosen for validation, nine were overexpressed (HMGA2, LRRK2, PLAG1, DPP4, CDH3, CEACAM6, PRSS3, SPOCK1, and PDE5A) and three were underexpressed (RAG2, AGTR1, and TPO5) in malignant compared with benign tumors (Tables 1 and 2). The 12 genes were chosen based on rank order or on their apparent biological importance in tumor development and cancer progression as described in the literature.
In addition, we also have identified a large number of cancer-related genes whose role have been considered important in human malignancy. Our microarray analysis revealed up-regulation of several serine proteases, including trypsin 1, kallikrein 7, and PRSS3/trypsinogen IVb (also called mesotrypsin), in the thyroid cancers (Table 1). This is the first study to identify these genes as potential candidates in thyroid tumor progression. There is increasing evidence that several of the serine proteases are not only involved in tumor progression, but are also required for metastasis. Trypsin and its precursor trypsinogen are involved in tumor progression by activation of matrix metalloproteases in pancreatic, gastric, and colorectal cancer (17). One of the tissue kallikreins, kallikrein 7, is highly expressed in ovarian cancer and is an unfavorable prognostic marker even for patients with low-grade tumors (18, 19).
One of the more exciting results of our study includes the overexpression of both HMGA2 and PLAG1 in malignant thyroid tumors (Table 1; Figs. 1 and 3). HMGA2 is one of many HMG proteins that are known to function as architectural transcription factors and are involved in many diverse biological processes, including embryogenesis, differentiation, and neoplastic transformation. HMGs are not only highly overexpressed in many human malignancies, but are also rearranged in many benign tumors (20–22). Furthermore, elevated levels of HMG proteins have been previously identified in thyroid tumors and considered by others as useful diagnostic markers of thyroid cancer (16, 23, 24). PLAG1, a zinc finger domain transcription factor, is found to be up-regulated in several tumors, including pleomorphic adenomas and lipoblastomas. Tumor-specific chromosomal rearrangements resulting in fusion genes or promoter swapping are believed to be involved in the early development of many tumor types. Relevant to our findings, chromosomal rearrangements involving HMGA2 (HMGIC), HMGA1 (HMGIY), and PLAG1 have been implicated in mesechymal tumors and salivary gland adenomas (25).
Another HMG family protein, HMGA1 is known to down-regulate the expression of RAG2 after binding to its promoter and thereby regulate lymphoid differentaition (26). Interestingly, the morphometric changes that are associated with lymphoid cells in thyroid tissue were once thought to be potential diagnostic markers of thyroid malignancy (27). Relevant to this study and the findings above, we also identified RAG2 as an underexpressed gene in the malignant thyroid tumors (Table 2; Fig. 3). Although we have no experimental evidence, our gene expression data are consistent with the possibility that overexpressed HMGA2 may be associated with the down-regulation of RAG2 because both HMGA1 and HMGA2 are homologous and share 50% sequence homology.
SPOCK1 was also identified as one of the overexpressed genes in malignant subtypes. The proteoglycan SPOCK1 (also known as testican 1) is involved in cell adhesion, invasion, and neurogenesis. SPOCK1 has several regions that are homologous to secreted protein acidic and rich in cysteine (SPARC)/Osteonectin and BM-40 (28). SPARC is an important mediator of tumor cell progression and has been implicated in a variety of diverse biological processes, including cell adhesion, proliferation, angiogenesis, tumor cell migration, and invasion (29–31). SPARC is also an important protein expressed by the juxtatumoral stromal cells in infiltrating breast carcinoma (32). Furthermore, antisense-mediated suppression of SPARC dramatically inhibits both motility and invasion of the breast cancer cell line MCF7 (33).
SPARC-like1 (also known as hevin or MAST9) is a negative regulator of cell growth and proliferation and found to be down-regulated in many cancers, including non–small cell lung cancer, prostate, and colon cancer (34–36). The effects of down-regulated SPARC-like1 are attributed mainly to the loss of cell adhesion. In our study, we also showed down-regulation of SPARC-like1 in malignant thyroid tumors (Table 2).
DPP4/CD26 is a homodimeric type II transmembrane glycoprotein and is identical to the leukocyte surface antigen CD26 (37). It is known to form a complex with seprase and thereby facilitate local degradation of extracellular matrices resulting in invasion of the endothelial cells into these matrices (38). Overexpression of DPP4 in both papillary thyroid carcinoma and follicular variant of papillary thyroid carcinoma was reported earlier by several other investigators (6, 7, 16, 39). Although the benign tumors showed low levels of DPP4 expression, the expression levels in lymphocytic thyroiditis nodules were found to be as high as that in the papillary thyroid cancers (Fig. 4). This may be due to the fact that lymphocytic thyroiditis shares common genetic features and harbors a genetic rearrangement that is strongly associated with and highly specific for papillary thyroid carcinoma (40).
CEACAM6 is part of a glycoylphosphatidylinositol-linked immunoglobulin super family (41). The overexpression of CEACAM6 is well documented in a variety of malignancies (42, 43) and seems to promote cancer progression in gastrointestinal cancers (44, 45). Importantly, the ability of tumor growth and metastatic behavior of pancreatic adenocarcinoma cells was inhibited by CEACAM6 gene silencing (46).
The stimulatory actions of angiotensin II upon angiogenesis, cell growth, and cell proliferation are mediated through the activation of the AGTR1 (47). In breast cancer, AGTR1 was found to be up-regulated in both benign and malignant breast tumors compared with normal breast tissue (48). Although we found the down-regulation of AGTR1 in all thyroid tumors compared with normal thyroid tissue, the relative expression was higher in benign than in malignant tumors (Table 2; Fig. 3).
The differential expressions of several other genes, such as low density lipoprotein receptor–related protein 4 (LRP4), mannose receptor C2 (MRC2), TPO5, deiodinase iodothyronine 1 (DIO1), CDH3, and KIT have also been previously reported in thyroid tumors (7, 9, 16, 49). In fact, one recent metaanalysis compiled a gene list by using thyroid cancer gene expression data obtained from different microarray platforms (50). Of note, five of the listed genes (LRP4, DPP4, PHLDA2, TPO5, and DIO1) were also identified in our microarray analysis. LRP4, DPP4, and PHLDA2 were shown to be overexpressed in thyroid cancer compared with benign tumors (Table 1). Both TPO5 and DIO1 were underexpressed in malignant compared with benign (Table 2). Two other genes, Metallothionein 1F and Metallothionein 1G were reported to be underexpressed in thyroid cancer compared with normal/or benign (50). However, in our study we documented the underexpression of another variant, Metallothionein 1A, in malignant tumors (Table 2). Interestingly, MT1A and MT1F share the same “Unigene-cluster” and have good sequence homology.
In summary, by microarray analysis of eight thyroid tumor types, we have identified 75 genes that are differentially expressed between benign and malignant tumors. Furthermore, we have validated 12 of these genes by real-time RT-PCR in the original tumor set, as well as in a new set of 31 tumors, and have confirmed the expression levels of HMGA2 by both Western blot analysis and immunohistochemistry. This comprehensive analysis represents only a first step in identifying molecular markers useful in the distinction of malignant from benign tumors. Application of these diagnostic genes/proteins in combination with routine FNA cytology will require further investigation as diagnostic adjuncts in the evaluation of thyroid nodules that have associated “suspicious” or “indeterminate” FNA cytology.
Supplementary Material
Acknowledgments
We thank Dr. Richard Simon for his help with the statistical analyses and Filomeno Apor, Kimberly Burckhardt, Sidney Craddock, Jr., Alan Silverio, Lauren Sangenario, Terry Emerson, and Dante Trusty for their assistance in thyroid tumor collection.
Grant support: National Cancer Institute grant RO1-CA107247-01A1. The costs of publication of this article were defrayed in part by the payment of page charges. This article must therefore be hereby marked advertisement in accordance with 18 U.S.C. Section 1734 solely to indicate this fact.
Footnotes
Note: Supplementary data for this article are available at Clinical Cancer Research Online (http://clincancerres.aacrjournals.org/).
Nia D. Banks, Jeanne Kowalski, Hua-Ling Tsai, Helina Somervell, Ralphe Tufano, Alan P.B. Dackiw, Michael R. Marohn, Douglas P. Clark, Christopher B. Umbricht, Martha A. Zeiger; unpublished results.
Disclosure of Potential Conflicts of Interest: No potential conflicts of interest were disclosed.
References
- 1.Reis EM, Ojopi EP, Alberto FL, et al. Large-scale transcriptome analyses reveal new genetic marker candidates of head, neck, and thyroid cancer. Cancer Res. 2005;65:1693–9. doi: 10.1158/0008-5472.CAN-04-3506. [DOI] [PubMed] [Google Scholar]
- 2.Tuttle RM, Lemar H, Burch HB. Clinical features associated with an increased risk of thyroid malignancy in patients with follicular neoplasia by fine-needle aspiration. Thyroid. 1998;8:377–83. doi: 10.1089/thy.1998.8.377. [DOI] [PubMed] [Google Scholar]
- 3.Kelman AS, Rathan A, Leibowitz J, Burstein DE, Haber RS. Thyroid cytology and the risk of malignancy in thyroid nodules: importance of nuclear atypia in indeterminate specimens. Thyroid. 2001;11:271–7. doi: 10.1089/105072501750159714. [DOI] [PubMed] [Google Scholar]
- 4.Brennan DJ, O'Brien SL, Fagan A, et al. Application of DNA microarray technology in determining breast cancer prognosis and therapeutic response. Expert Opin Biol Ther. 2005;5:1069–83. doi: 10.1517/14712598.5.8.1069. [DOI] [PubMed] [Google Scholar]
- 5.Zvara A, Hackler L, Jr, Nagy ZB, Micsik T, Puskas LG. New molecular methods for classification, diagnosis and therapy prediction of hematological malignancies. Pathol Oncol Res. 2002;8:231–40. doi: 10.1007/BF03036737. [DOI] [PubMed] [Google Scholar]
- 6.Huang Y, Prasad M, Lemon WJ, et al. Gene expression in papillary thyroid carcinoma reveals highly consistent profiles. Proc Natl Acad Sci U S A. 2001;98:15044–9. doi: 10.1073/pnas.251547398. [DOI] [PMC free article] [PubMed] [Google Scholar]
- 7.Jarzab B, Wiench M, Fujarewicz K, et al. Gene expression profile of papillary thyroid cancer: sources of variability and diagnostic implications. Cancer Res. 2005;65:1587–97. doi: 10.1158/0008-5472.CAN-04-3078. [DOI] [PubMed] [Google Scholar]
- 8.Barden CB, Shister KW, Zhu B, et al. Classification of follicular thyroid tumors by molecular signature: results of gene profiling. Clin Cancer Res. 2003;9:1792–800. [PubMed] [Google Scholar]
- 9.Mazzanti C, Zeiger MA, Costouros NG, et al. Using gene expression profiling to differentiate benign versus malignant thyroid tumors. Cancer Res. 2004;64:2898–903. doi: 10.1158/0008-5472.can-03-3811. [DOI] [PubMed] [Google Scholar]
- 10.Simon R, Lam A, Li M, Ngan M, Menenzes S, Zhao Y. Analysis of gene expression data using BRB-array tools. Cancer Informatics. 2007;2:11–7. [PMC free article] [PubMed] [Google Scholar]
- 11.Wright GW, Simon RM. A random variance model for detection of differential gene expression in small microarray experiments. Bioinformatics. 2003;19:2448–55. doi: 10.1093/bioinformatics/btg345. [DOI] [PubMed] [Google Scholar]
- 12.Radmacher MD, McShane LM, Simon R. A paradigm for class prediction using gene expression profiles. J Comput Biol. 2002;9:505–11. doi: 10.1089/106652702760138592. [DOI] [PubMed] [Google Scholar]
- 13.Du doit S, Fridlyand F, Speed TP. Comparison of discrimination methods for classification of tumors using DNA microarrays. J Am Stat Assoc. 2002;97:77–87. [Google Scholar]
- 14.Ramaswamy S, Tamayo P, Rifkin R, et al. Multiclass cancer diagnosis using tumor gene expression signatures. Proc Natl Acad Sci U S A. 2001;98:15149–54. doi: 10.1073/pnas.211566398. [DOI] [PMC free article] [PubMed] [Google Scholar]
- 15.Fedor HL, De Marzo AM. Practical methods for tissue microarray construction. Methods Mol Med. 2005;103:89–101. doi: 10.1385/1-59259-780-7:089. [DOI] [PubMed] [Google Scholar]
- 16.Lubitz CC, Ugras SK, Kazam JJ, et al. Microarray analysis of thyroid nodule fine-needle aspirates accurately classifies benign and malignant lesions. J Mol Diagn. 2006;8:490–8. doi: 10.2353/jmoldx.2006.060080. [DOI] [PMC free article] [PubMed] [Google Scholar]
- 17.Yamamoto H, Iku S, Adachi Y, et al. Association of trypsin expression with tumour progression and matrilysin expression in human colorectal cancer. J Pathol. 2003;199:176–84. doi: 10.1002/path.1277. [DOI] [PubMed] [Google Scholar]
- 18.Kyriakopoulou LG, Yousef GM, Scorilas A, et al. Prognostic value of quantitatively assessed KLK7 expression in ovarian cancer. Clin Biochem. 2003;36:135–43. doi: 10.1016/s0009-9120(02)00446-0. [DOI] [PubMed] [Google Scholar]
- 19.Dong Y, Kaushal A, Brattsand M, Nicklin J, Clements JA. Differential splicing of KLK5 and KLK7 in epithelial ovarian cancer produces novel variants with potential as cancer biomarkers. Clin Cancer Res. 2003;9:1710–20. [PubMed] [Google Scholar]
- 20.Chiappetta G, Botti G, Monaco M, et al. HMGA1 protein overexpression in human breast carcinomas: correlation with ErbB2 expression. Clin Cancer Res. 2004;10:7637–44. doi: 10.1158/1078-0432.CCR-04-0291. [DOI] [PubMed] [Google Scholar]
- 21.Masciullo V, Baldassarre G, Pentimalli F, et al. HMGA1 protein over-expression is a frequent feature of epithelial ovarian carcinomas. Carcinogenesis. 2003;24:1191–8. doi: 10.1093/carcin/bgg075. [DOI] [PubMed] [Google Scholar]
- 22.Sarhadi VK, Wikman H, Salmenkivi K, et al. Increased expression of high mobility group A proteins in lung cancer. J Pathol. 2006;209:206–12. doi: 10.1002/path.1960. [DOI] [PubMed] [Google Scholar]
- 23.Chiappetta G, Tallini G, De Biasio MC, et al. Detection of high mobility group I HMGI(Y) protein in the diagnosis of thyroid tumors: HMGI(Y) expression represents a potential diagnostic indicator of carcinoma. Cancer Res. 1998;58:4193–8. [PubMed] [Google Scholar]
- 24.Belge G, Meyer A, Klemke M, et al. Upregulation of HMGA2 in thyroid carcinomas: a novel molecular marker to distinguish between benign and malignant follicular neoplasias. Genes Chromosomes Cancer. 2008;47:56–63. doi: 10.1002/gcc.20505. [DOI] [PubMed] [Google Scholar]
- 25.Aman P. Fusion genes in solid tumors. Semin Cancer Biol. 1999;9:303–18. doi: 10.1006/scbi.1999.0130. [DOI] [PubMed] [Google Scholar]
- 26.Battista S, Fedele M, Martinez Hoyos J, et al. High-mobility-group A1 (HMGA1) proteins down-regulate the expression of the recombination activating gene 2 (RAG2) Biochem J. 2005;389:91–7. doi: 10.1042/BJ20041607. [DOI] [PMC free article] [PubMed] [Google Scholar]
- 27.Kirillov VA, Stebenyaeva EE, Paplevka AA, Demidchik EP. Quantitative changes in thyroid lymphoid cells as a marker of malignancy. Anal Quant Cytol Histol. 2005;27:101–10. [PubMed] [Google Scholar]
- 28.Charbonnier F, Perin JP, Mattei MG, et al. Genomic organization of the human SPOCK gene and its chromosomal localization to5q31. Genomics. 1998;48:377–80. doi: 10.1006/geno.1997.5199. [DOI] [PubMed] [Google Scholar]
- 29.Brekken RA, Sage EH. SPARC, a matricellular protein: at the crossroads of cell-matrix communication. Matrix Biol. 2001;19:816–27. doi: 10.1016/s0945-053x(00)00133-5. [DOI] [PubMed] [Google Scholar]
- 30.Motamed K. SPARC (osteonectin/BM-40) Int J Biochem Cell Biol. 1999;31:1363–6. doi: 10.1016/s1357-2725(99)00090-4. [DOI] [PubMed] [Google Scholar]
- 31.Rosenblatt S, Bassuk JA, Alpers CE, Sage EH, Timpl R, Preissner KT. Differential modulation of cell adhesion by interaction between adhesive and counter-adhesive proteins: characterization of the binding of vitronectin to osteonectin (BM40, SPARC) Biochem J. 1997;324:311–9. doi: 10.1042/bj3240311. [DOI] [PMC free article] [PubMed] [Google Scholar]
- 32.Iacobuzio-Donahue CA, Argani P, Hempen PM, Jones J, Kern SE. The desmoplastic response to infiltrating breast carcinoma: gene expression at the site of primary invasion and implications for comparisons between tumor types. Cancer Res. 2002;62:5351–7. [PubMed] [Google Scholar]
- 33.Briggs J, Chamboredon S, Castellazzi M, Kerry JA, Bos TJ. Transcriptional upregulation of SPARC, in response to c-Jun overexpression, contributes to increased motility and invasion of MCF7 breast cancer cells. Oncogene. 2002;21:7077–91. doi: 10.1038/sj.onc.1205857. [DOI] [PubMed] [Google Scholar]
- 34.Isler SG, Schenk S, Bendik I, et al. Genomic organization and chromosomal mapping of SPARC-like 1, a gene down regulated in cancers. Int J Oncol. 2001;18:521–6. doi: 10.3892/ijo.18.3.521. [DOI] [PubMed] [Google Scholar]
- 35.Framson PE, Sage EH. SPARC and tumor growth: where the seed meets the soil? J Cell Biochem. 2004;92:679–90. doi: 10.1002/jcb.20091. [DOI] [PubMed] [Google Scholar]
- 36.Claeskens A, Ongenae N, Neefs JM, et al. Hevin is down-regulated in many cancers and is a negative regulator of cell growth and proliferation. Br J Cancer. 2000;82:1123–30. doi: 10.1054/bjoc.1999.1051. [DOI] [PMC free article] [PubMed] [Google Scholar]
- 37.Reinhold D, Biton A, Pieper S, et al. Dipeptidyl peptidase IV (DP IV, CD26) and aminopeptidase N (APN, CD13) as regulators of T cell function and targets of immunotherapy in CNS inflammation. Int Immunopharmacol. 2006;6:1935–42. doi: 10.1016/j.intimp.2006.07.023. [DOI] [PubMed] [Google Scholar]
- 38.Ghersi G, Zhao Q, Salamone M, Yeh Y, Zucker S, Chen WT. The protease complex consisting of dipeptidyl peptidase IV and seprase plays a role in the migration and invasion of human endothelial cells in collagenous matrices. Cancer Res. 2006;66:4652–61. doi: 10.1158/0008-5472.CAN-05-1245. [DOI] [PMC free article] [PubMed] [Google Scholar]
- 39.Ozog J, Jarzab M, Pawlaczek A, et al. Expression of DPP4 gene in papillary thyroid carcinoma. Endokrynol Pol. 2006;57:12–7. [PubMed] [Google Scholar]
- 40.Arif S, Blanes A, Diaz-Cano SJ. Hashimoto's thyroiditis shares features with early papillary thyroid carcinoma. Histopathology. 2002;41:357–62. doi: 10.1046/j.1365-2559.2002.01467.x. [DOI] [PubMed] [Google Scholar]
- 41.Thompson JA, Grunert F, Zimmermann W. Carcinoembryonic antigen gene family: molecular biology and clinical perspectives. J Clin Lab Anal. 1991;5:344–66. doi: 10.1002/jcla.1860050510. [DOI] [PubMed] [Google Scholar]
- 42.Jantscheff P, Terracciano L, Lowy A, et al. Expression of CEACAM6 in resectable colorectal cancer: a factor of independent prognostic significance. J Clin Oncol. 2003;21:3638–46. doi: 10.1200/JCO.2003.55.135. [DOI] [PubMed] [Google Scholar]
- 43.Poola I, Shokrani B, Bhatnagar R, DeWitty RL, Yue Q, Bonney G. Expression of carcinoembryonic antigen cell adhesion molecule 6 oncoprotein in atypical ductal hyperplastic tissues is associated with the development of invasive breast cancer. Clin Cancer Res. 2006;12:4773–83. doi: 10.1158/1078-0432.CCR-05-2286. [DOI] [PubMed] [Google Scholar]
- 44.Scholzel S, Zimmermann W, Schwarzkopf G, Grunert F, Rogaczewski B, Thompson J. Carcinoembryonic antigen family members CEACAM6 and CEA-CAM7 are differentially expressed in normal tissues and oppositely deregulated in hyperplastic colorectal polyps and early adenomas. Am J Pathol. 2000;156:595–605. doi: 10.1016/S0002-9440(10)64764-5. [DOI] [PMC free article] [PubMed] [Google Scholar]
- 45.Ilantzis C, DeMarte L, Screaton RA, Stanners CP. Deregulated expression of the human tumor marker CEA and CEA family member CEACAM6 disrupts tissue architecture and blocks colonocyte differentiation. Neoplasia. 2002;4:151–63. doi: 10.1038/sj.neo.7900201. [DOI] [PMC free article] [PubMed] [Google Scholar]
- 46.Duxbury MS, Matros E, Ito H, Zinner MJ, Ashley SW, Whang EE. Systemic siRNA-mediated gene silencing: a new approach to targeted therapy of cancer. Ann Surg. 2004;240:667–74. doi: 10.1097/01.sla.0000140755.97224.9a. [DOI] [PMC free article] [PubMed] [Google Scholar]
- 47.Greco S, Elia MG, Muscella A, Storelli C, Marsigliante S. AT1 angiotensin II receptor mediates intra-cellular calcium mobilization in normal and cancerous breast cells in primary culture. Cell Calcium. 2002;32:1–10. doi: 10.1016/s0143-4160(02)00077-5. [DOI] [PubMed] [Google Scholar]
- 48.Inwang ER, Puddefoot JR, Brown CL, et al. Angio-tensin II type 1 receptor expression in human breast tissues. Br J Cancer. 1997;75:1279–83. doi: 10.1038/bjc.1997.217. [DOI] [PMC free article] [PubMed] [Google Scholar]
- 49.Hucz J, Kowalska M, Jarzab M, Wiench M. Gene expression of metalloproteinase 11, claudin 1 and selected adhesion related genes in papillary thyroid cancer. Endokrynol Pol. 2006;57:18–25. [PubMed] [Google Scholar]
- 50.Griffith OL, Melck A, Jones SJ, Wiseman SM. Meta-analysis and meta-review of thyroid cancer gene expression profiling studies identifies important diagnostic biomarkers. J Clin Oncol. 2006;24:5043–51. doi: 10.1200/JCO.2006.06.7330. [DOI] [PubMed] [Google Scholar]
Associated Data
This section collects any data citations, data availability statements, or supplementary materials included in this article.