Abstract
A real-time cell analysis (RTCA) system based on cell-substrate electric impedance technology was used to monitor cytopathic effects (CPE) in Vero cell cultures infected with West Nile virus (WNV) and St. Louis encephalitis virus (SLEV) at infectious doses ranging from 101 to 106 plaque forming units (PFU) of virus. A kinetic parameter characterizing virus-induced CPE, CIT50 or the time to 50% decrease in cell impedance, was inversely proportional to virus infectious dose. In WNV-infected cells, the onset and rate of CPE was earlier and faster than in SLEV-infected cells, which was consistent with viral cytolytic activity. A mathematical model simulating impedance-based CPE kinetic curves indicated that the replication rate of WNV was about 3 times faster than SLEV. The RTCA system also was used for quantifying the level of cell protection by specific neutralizing antibodies against WNV and SLEV. The onset of WNV or SLEV-induced CPE was delayed in the presence of specific anti-sera, and this delay in the CIT50 was well correlated with the titer of the neutralizing antibody as measured independently by plaque reduction neutralization tests (PRNT). The RTCA system provided a high throughput and quantitative method for real-time monitoring viral growth in cell culture and its inhibition by neutralizing antibodies.
Keywords: real-time cell analysis system, viral cytopathogenesis, West Nile virus, St Louis encephalitis virus, impedance, neutralization assay
1. Introduction
West Nile (WNV) and St. Louis encephalitis (SLEV) viruses are closely related antigenically and classified within the Japanese encephalitis virus serocomplex within the genus Flavivirus in the family Flaviviridae. Both viruses are maintained and amplified within a Culex – passerine bird cycle that intermittently spills over to include equines and humans that suffer variable symptoms and disease, but are dead-end hosts for these viruses (Kramer et al. 2008; Reisen 2003). Although both viruses grow well on a variety of mosquito, avian and mammalian cell cultures, measurement of viral concentration is quantified by counting plaques (cyptopathic effect) on monolayers of African green monkey kidney or Vero cells. This method is slow, time consuming and difficult to measure in real-time. In addition, the requirement for counting plaque forming units on cell monolayers restricts the assay to mammalian Vero cell culture which forms suitable monolayers, but may not be the best cell type for measuring growth by these mosquito-avian viruses. These problems come to the forefront when the plaque-counting assay is used to compare multiple viral strain growth kinetics.
Human disease caused by these two viruses varies clinically and is frequently confused with influenza viruses. Disease onset typically occurs after peak viremia, making clinical diagnosis difficult and requiring laboratory confirmation by serology. Laboratory diagnosis requires demonstration of IgM in sera or cerebral-spinal fluid or a four-fold rise in IgG titer between acute and convalescent sera. Enzyme immunoassays (EIA) provide rapid results, but are often not sufficiently specific to allow identification of the infecting virus. Although assays such as immunofluorescence or Western blot may be informative (Oceguera, III et al. 2007; Patiris et al. 2008), definitive diagnosis typically requires an end point plaque reduction neutralization test (PRNT) and the demonstration of a four fold difference in titer between competing and suspected viruses or between acute and convalescent sera. When avian serology is used for large-scale enzootic monitoring as part of integrated surveillance programs, confirmation of EIA results can be expensive and the results problematic due to the unknown history of host infection (Kwan et al. 2010; Reisen et al. 2009).
A real-time cell analysis (RTCA) system (formerly RT-CES system from ACEA Biosciences, Inc., San Diego, CA) was developed for monitoring cell growth and cell based assays using electronic impedance technology (Solly et al. 2004). A dimensionless parameter called the cell index (CI) (Xing et al. 2005) allows the RTCA system to detect changes to the cell layers cultured on gold microelectrodes on glass substrate integrated into the bottom of the microelectronic cell culture plates (Solly et al. 2004). This technology has been applied in a number of cell-based assays, including cytotoxicity, cell adhesion and spreading, functional monitoring of receptor mediated signaling, and cell invasion and migration (Abassi et al. 2009; Atienza et al. 2005; Atienza et al. 2006; Xing et al. 2005; Yu et al. 2006). The current study describes the unique adaptation of the RTCA system to quantitatively monitor in real-time WNV or SLEV-induced cytopathic effects (CPE) in cell culture and to measure inhibition of CPE by specific neutralizing antibodies. Previously, the RTCA system was used to compare the growth dynamics of different strains of western equine encephalomyelitis virus (WEEV) on Vero, duck embryo fibroblast and Aedes albopictus cells (Zhang et al. 2010), and these results indicated that the system worked best for cells such as Vero that form monolayers adhering to the E-plate sensors.
2. Materials and Methods
2.1. Cells, Virus and Reagents
African green monkey kidney or Vero cells (Yasumura and Kawakita 1963) were used throughout and are the standard cell culture for measuring virus titers by counting plaque forming units (PFU) or neutralizing antibody titers using a plaque reduction neutralization test (PRNT). The New York 1999 strain of WNV isolated from a Flamingo that died in the Bronx Zoo (strain 35211 AAF 9/23/99) and the Kern217 strain of SLEV isolated from Culex tarsalis collected in Bakersfield in 1989 were used throughout. Both strains were passed twice in Vero cells before experimentation and have been used extensively in recent vector and host competence studies in our laboratory (Goddard et al. 2002; Reisen et al. 2003; Reisen et al. 2005).
2.2. Real-time RT-PCR
Virus cultures were mixed in diluent [phosphate-buffered saline (PBS), 15% fetal bovine serum (FBS), antibiotics] and the RNA extracted using an ABI 6100 workstation (Applied Biosystems, Foster City, CA) using manufacture’s protocols. Samples were tested for WNV or SLEV RNA using a real-time RT-PCR with a ABI Prism 7900 TaqMan platform using manufacturer’s protocols and chemistry, and published (Lanciotti and Kerst 2001) and unpublished primers from the envelope portion of the genome.
2.3. RTCA system
The real-time cell analysis or RTCA system (xCELLigence, Roche Applied Sciences, Indianapolis, IN) was based on previously described cell-electrode subtract impedance detection technology (Solly et al. 2004). The sensor E-plate (Roche Applied Sciences) is a regular 16- or 96-well microtiter plate with circle-on-line electrode arrays integrated onto the bottom surface of the wells and optimized to cover about 80% of the bottom surface area. In operation, the E-plate with infected or uninfected Vero cells were loaded onto the E-plate station and placed within a standard CO2 incubator maintained at 37°C and 5% CO2. For infection studies, we loaded Vero cells and infectious virus concurrently; however, it is also possible to establish cells in the e-wells for a 24 h period and then add infectious virus, but impedance should be measured from virus addition. Cell status within the wells was monitored in real-time by an impedance analyzer and a computer placed outside the incubator and connected to the station by an electric cable. A parameter termed the cell index (CI) was derived to represent cell status based on the change of the electrode impedance for the wells with the cells relative to that of control wells without the cells. The frequency-dependent electrode impedance (resistance) without or with cells present in the wells was represented as Rb(f) and Rcell(f), respectively, and the CI calculated as
where N is the number of the frequency points at which the impedance is measured. Several features of the CI can be derived: (1) under the same physiological conditions, if more cells attach to the electrodes, the impedance value will increase. If no cells are present on the electrodes or if cells are detached from the electrodes, Rcell (f) will be the same as Rb(f), leading to CI=0. Therefore, CI is a quantitative measure of the number of cells attached to the sensors. (2) For the same number of cells attached to the sensors, changes in cell status will lead to changes in CI. For example, an increase in cell adhesion or cell spread leading to a large cell/electrode contact area will lead to an increase in Rcell(f) and therefore an increase in CI. In contrast, cell death or virus-induced cell detachment or cell rounding will lead to a smaller Rcell (f) and therefore a lower CI. In the current study, for display of RTCA response curves, a normalized cell index generally was used, where the cell index is normalized at the last time point before the treatment of Vero cells with virus particles.
2.4. Real-time CPE monitoring with the RTCA system
Vero cell suspensions at 1,000,000 cells/ml were prepared in growth media (10% FBS in Dulbecco’s modified Eagle’s medium, DMEM). A 10-fold dilution series of WNV or SLEV stock virus was prepared with titers ranging from 101 to 106 plaque forming units (PFU) per 50 μl. To infect cells, 50 μl of each log10-diluted WNV or SLEV solution were mixed with 50 μl of Vero cell suspension (50,000 cells) and incubated for 30 min at 37°C. After incubation, the mixture was added to individual E-plate wells. Negative controls included 50 μl of Vero cells mixed with 50 μl of diluent without virus. The E-plate was loaded onto the RTCA station located in the cell culture incubator maintained at 5% CO2 and 37°C, and the real-time measurement of the cell status initiated. System software acquired and recorded the cell index (CI) for each well automatically every hour. After 24 h, growth media of the E-plate (100 μl/well) was replaced with 200 μl/well of DMEM without FBS. After reloading the E-plate onto the station, real-time monitoring was resumed and data recorded hourly for the next 10 days.
2.5. Neutralizing antibody detection by RTCA system
50,000 Vero cells in growth media were added to each well of an E-plate and cell monolayer formation was monitored overnight using the RTCA system in the cell culture incubator. The next day, House finch (Carpodacus mexicanus) antisera with known neutralizing antibody titer determined previously by standard beta plaque reduction neutralization tests (PRNT80) (Fang and Reisen 2006) was serially 2-fold diluted with DMEM and 100 μl of the serially diluted anti-sera mixed with 100 μl of WNV or SLEV containing 105.3 PFU of virus. After 30 min incubation in standard 96 well plates at 37°C, 100 μl of the antibody/virus mixtures were added to wells of the E-plate after the original growth media was removed. The E-plates then were loaded onto the RTCA station in the CO2 incubator and real-time monitoring continued hourly for the next 10 days.
To determine the neutralizing antibody titer of 40 blood samples from a variety of naturally infected field-caught avian species, a 1:20 dilution of the sample was first made with with saline and then mixed 1:1 by volume with 105.3 PFU of WNV (final sera dilution, 1:40). After 30 min incubation at 37°C, each mixture was added to one well of a 96 well E-plate onto which a Vero cell monolayer was formed (see above). To generate a standard neutralizing titer curve, an avian serum sample of known WNV neutralizing antibody titer was diluted 2-fold serially with serum free DMEM starting at 1:20 and added to Vero cell monolayers in the E-plate wells. Real-time monitoring was initiated and data recorded hourly for 10 days. The endpoint neutralizing antibody titer for each sample was then determined from the standard curve generated from known samples.
The collection and bleeding of wild birds was conducted under Protocol 12880 approved by the Animal Use and Care Administrative Advisory Committee [IACUC] of the University of California, Davis, California Resident Scientific Collection Permit 801009-02 by the State of California Department of Fish and Game, and Federal Fish and Master Station Federal Bird Marking and Salvage Permit No. 22763 from the U.S. Geological Survey Bird Banding Laboratory Collection. Experimental infection of wild birds was done under Federal Fish and Wildlife collection permit No. MB082812-0 and UC Davis IACUC Protocol 12876. Culture and testing for WNV and SLEV was done under BSL3 conditions approved by UC Davis Environmental Health and Safety Biological Use Authorization 0554.
3. Results
3.1. Real-time monitoring of WNV and SLEV growth in cell culture
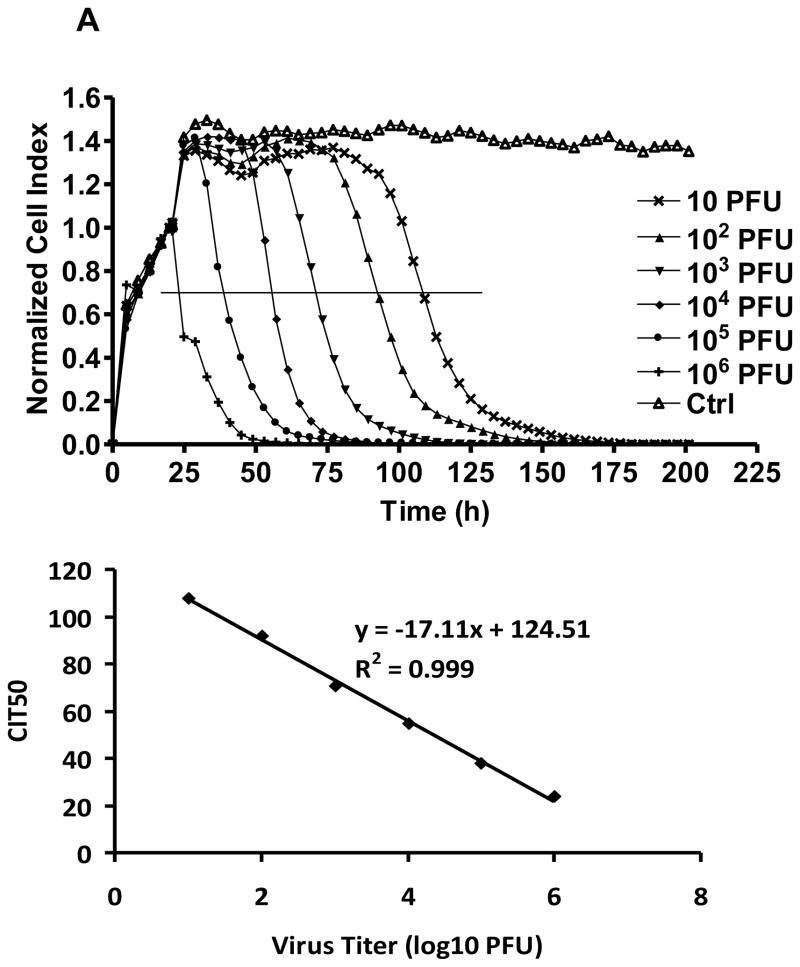
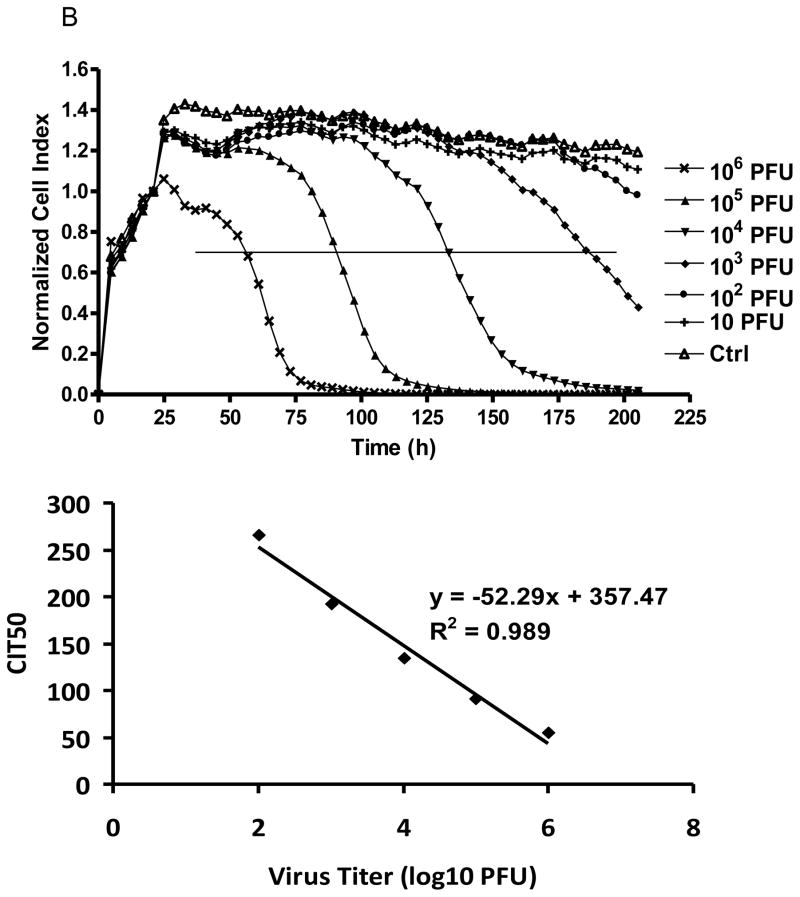
At 37°C WNV-induced cytolysis, the cause of CPE, was detected as early as 20 h post infection at 106 PFU, with a rapid decline of the Cell Index (CI), and by 24 h post infection the CI had decreased by ca. 50% (Fig. 1A). Each order of magnitude decrease in the infectious dose of the WNV cell culture inoculum resulted in a delay of 15–22 h in the time-dependent CI curves (Fig. 1A), with values ranging from 100% CI value for no cytolysis to 0% CI for complete cytolysis. To characterize further virus-induced CPE, the CIT50 or time required for the CI to decrease 50% after virus infection, was regressed as a linear function of the log10 of the tissue culture WNV virus inoculum concentration (Fig. 1). The resulting regression indicated that for each order of magnitude decrease of the WNV concentration, the CIT50 was delayed by ~ 17.1 h. Therefore, analysis of CIT50 based on RTCA monitoring of WNV-induced CPE could be used to estimate the WNV titer of the original infectious dose. Time dependent CPE also was observed for SLEV-infected cells, although the cytolytic effects were slower, with an increase in CIT50 of ~ 52.3 h for every order of magnitude decrease in PFU (Fig. 1B).
Figure 1.
Real-time monitoring of (A) WNV and (B) SLEV-induced CPE on Vero cells.
Normalized cell index plotted as a function of time in hours post infection for E-wells inoculated with different plaque forming units (PFU) of virus and control (ctrl) wells without virus addition. The curve is an average of two independent replicate wells. The horizontal line depicts the 50% point in the decline of the CI value. The intersect of the horizontal line and cell index response curve corresponds to the CIT50. CIT50 values were regressed as a function infectious dose in log10 PFU. Goodness of regression fit to experimental data is shown by R2.
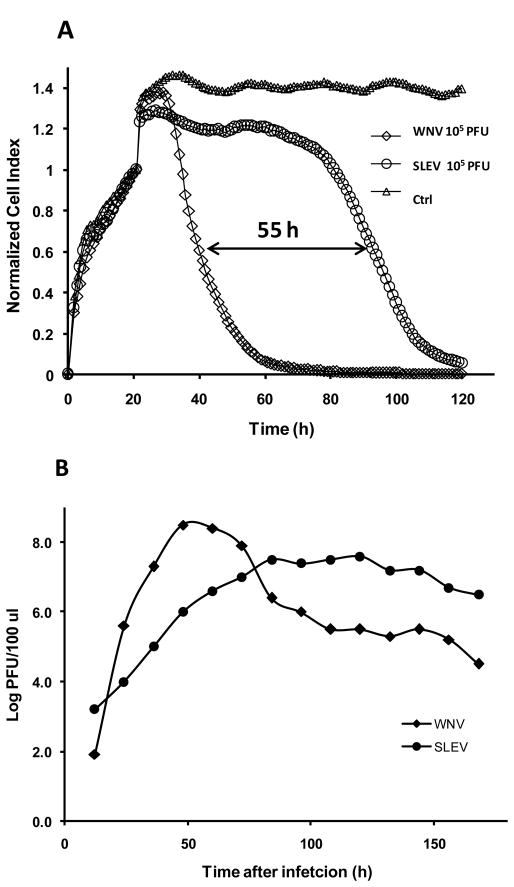
Although both SLEV and WNV are closely related viruses within the same serocomplex, SLEV typically grows slower on Vero cell culture and exhibits characteristically a smaller diameter plaque size than WNV (Hayes 1989; Monath 1980). The replication dynamics of WNV and SLEV were compared at the same 0.01 multiplicity of infection (MOI) in Vero cell culture, and a growth plateau was reached at ~ 48 and ~ 84 hrs for WNV and SLEV, respectively (Fig. 2A,B). This was in agreement with the RTCA-based CPE kinetics, where SLEV infected cells demonstrated a delayed response curve compared with that for WNV at same virus concentration (Fig. 2A). Indeed, for the virus dose of 105 PFU per well, CIT50 of CPE for SLEV infected cells was about 55 h longer than that for WNV-infected cells. This strongly indicated that the real-time monitoring of the virus-induced CPE not only provided a quantitative measure of the original viral infectious dose, but also a quantitative indicator of virus-mediated cytolysis. Such functional quantitation may provide a valuable in vitro platform for assessing virulence resulting from either natural evolution or investigative mutation studies.
Figure 2.
(A) Difference in CPE kinetic patterns between WNV and SLEV with same infection infectious dose of 105 PFU and non infected (ctrl) cells. The arrow indicates the time difference for CIT50 between WNV and SLEV infected cells. The curves are the average of two replicate wells per sample. (B) Standard growth curves for WNV and SLEV. Confluent Vero cells in E-Plate wells were infected with WNV or SLEV at an MOI of 0.01, and supernatant samples were taken from the wells for virus titration in Vero cells using standard plaque assay. Viral titers at each-time point are shown as log10 PFU/100 μl.
3.2. Virus kinetic modeling
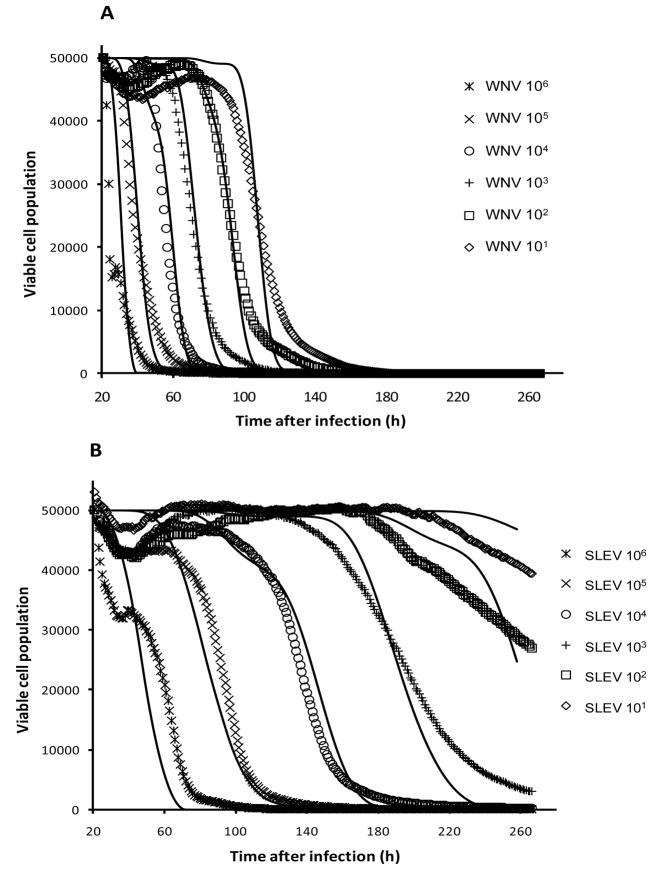
Although the CIT50 value decreased as a linear function of viral dose after CPE was trigged by WNV or SLEV, the CI profiles were similar in rate of decline, especially at high viral doses (106 to 104 PFU, Fig. 1). For low viral doses (103 to 101) and particularly for SLEV-induced CPE, the rate of CI decline was reduced, indicating that it took a longer time for the CI to reach the CIT50 or zero points. To define the cell response profiles for WNV and SLEV, a mathematical model was developed to simulate time dependent CI curves for different doses of virus (Fig. 3). Presumably, when a given number of virus particles (Nv) are introduced into an E-plate well containing a fixed number of viable cells (Nc), virus infection of the cells follows a Poisson distribution. Therefore, the number of cells that are infected with k virus particles is given by
Figure 3.
Comparison between experimentally measured (symbols without lines) and simulated (solid lines) cell response curves for (A) WNV and (B) SLEV-induced CPE. The y-axis is the viable cell population, where the initial viable cell number is assumed to be 50,000 cells added to a given E-well with the WNV or SLEV particles per well at the numbers shown. The simulation data is based on the set of values in Table 1 using the mathematical models described in the text.
| (1) |
Where λ is the average number of virus particles per cell, given by . The viruses in the cells replicate showing exponential growth with a doubling time (DTv) that varies according to virus species or strains. Therefore, for a cell having an initial infected virus number kv0, the virus number changes with time, following the equation,
| (2) |
When the number of intracellular virus particles attains a threshold value (NTv), infected cells begin to die and release virus particles. Individual cells may take different times to die and disintegrate. Assuming that the dead cell fraction increases with time following a sigmoid- second-order time dependency, given by
| (3) |
where Tc is the average time to cell death. According to equation (3), out of all the cells having an intracellular virus load >NTv, 50% die at Tc and 100% die at 2*Tc.
Released virus particles then infect viable cells, resulting in secondary infection and viral population growth. This is especially important in wells with a low initial number of virus particles, because the majority of the cells die after the first round of infection. For a given E-plate well, as more infected cells die with time leading to a reduced viable cell population, there is a decline in the CI when the dead cells ‘round up’ and lose adhesion to the sensor electrodes.
Using equations (1–3), the viable cell population in an E-plate well was calculated while undergoing virus-induced CPE using 5 parameters: the initial cell number (Nc), the number of virus particles (Nv), the virus doubling time (DTv), the intracellular virus number threshold (NTv) for initiating cell death, and time to cell death (Tc). When the first two parameters, Nc and Nv, were known for a given well during an experiment, the above model simulated the viable cell population (CI) based on virus-specific values for the parameters DTv, NTv and Tc. The simulated results were optimized by minimizing the difference between the simulated data and experimentally observed CI curves to derive the best-fit values for the parameters DTv, NTv and Tc, expressed as
| (4) |
As shown in Fig. 3, a good agreement was achieved between simulated data and experimentally observed CI curves, indicating the possible validity of the model in predicting the virus-mediated CPE process. Table 2 summarized the values for various parameters for the WNV and SLEV-induced CPE processes derived from the models. The doubling times for WNV and SLEV were estimated to be 4.0 hr and 13.5 hr, respectively, indicating that WNV can proliferate at a rate nearly three-times faster than SLEV. For virus-induced CPE, the intracellular virus number thresholds for initiating CPE were 370 and 35 PFU, and the cell death times were 9 hr and 25 hrs for WNV and SLEV, respectively.
Table 2.
Comparison of WNV antibody titers for 40 avian serum samples tested by enzyme immunoassay (EIA, ratio of positive to negative well), standard plaque reduction neturalization test (PRNT, done in 6 well plates) and RTCA assay.
| Sample # | EIA ratio | PRNT Titer | RTCA Titer |
|---|---|---|---|
| 1 | 8.3 | 40 | <20 |
| 2 | 19.4 | 1280 | 348 (320–640) |
| 3 | 5.4 | 40 | 15 (<20) |
| 4 | 2.7 | 80 | <20 |
| 5 | 5.6 | >80 | 49 (40–80) |
| 6 | 3.9 | >80 | 91 (80–160) |
| 7 | 6.2 | 1280 | 674 (>640) |
| 8 | 8.0 | 640 | 153 (80–160) |
| 9 | 3.4 | 20 or <20 | <20 |
| 10 | 8.0 | 320 | 153 (80–160) |
| 11 | 8.3 | 640 | 167 (160–320) |
| 12 | 8.5 | 40 | 105 (80–160) |
| 13 | 2.7 | 640 | 404 (320–640) |
| 14 | 6.9 | >80 | 77 (40–80) |
| 15 | 6.3 | 80 | 111 (80–160) |
| 16 | 5.8 | <20 | 35 (20–40) |
| 17 | 8.3 | >80 | 22 (20–40) |
| 18 | 2.9 | >80 | 70 (40–80) |
| 19 | 5.3 | 80 | 8 (<20) |
| 20 | 11.7 | 320 | 209 (160–320) |
| 21 | 19.4 | >1280 | 500 (320–640) |
| 22 | 5.8 | <20 | <20 |
| 23 | 2.7 | <20 | 8 (<20) |
| 24 | 4.8 | 20 or 80 | 84 (80–160) |
| 25 | 10.5 | 1280 | 340 (320–640) |
| 26 | 2.3 | 80 | 90 (80–160) |
| 27 | 6.9 | 160 | 174 (160–320) |
| 28 | 14.4 | 160 | 333 (160–320) |
| 29 | 13.8 | 1280 | 452 (320–640) |
| 30 | 9.1 | 1280 | 222 (160–320) |
| 31 | 5.3 | 20 or 80 | 63 (40–80) |
| 32 | 9.8 | 640 | 390 (320–640) |
| 33 | 7.7 | 40 | 35 (20–40) |
| 34 | 8.9 | 640 | 174 (160–320) |
| 35 | 4.1 | <20 | <20 |
| 36 | 7.9 | 640 | 181 (160–320) |
| 37 | 7.2 | 40 | 56 (40–80) |
| 38 | 2.4 | 80 | 84 (80–160) |
| 39 | 4.9 | >80 | 84 (80–160) |
| 40 | 3.9 | >80 | 70 (40–80) |
Note: EIA ratio >2 consider positive for the EIA preliminary testing
3.3. Real-time detection of neutralizing antibody against WNV and SLEV
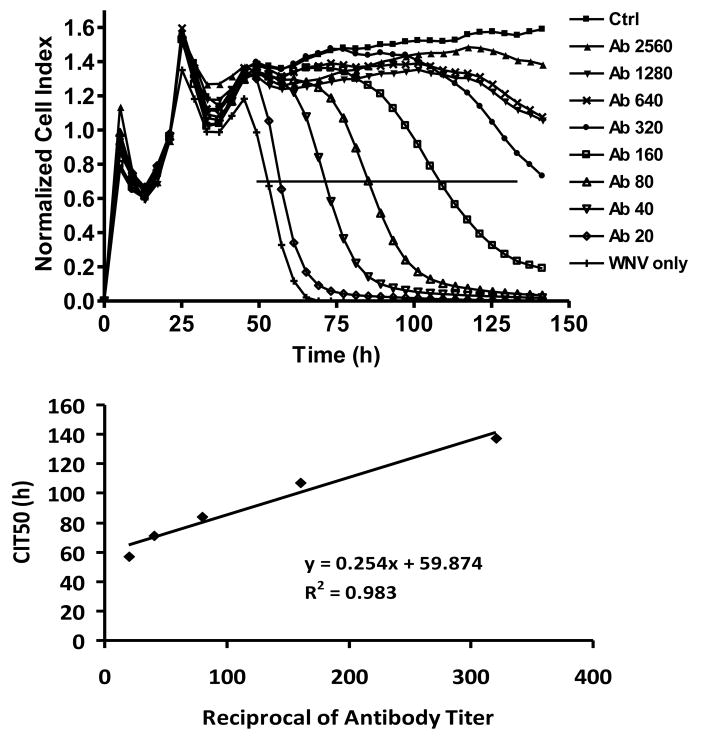
Because the cell response profile due to virus-induced CPE gradually was delayed with decreasing infectious dose for a given cell number, virus-neutralizing activity mediated by specific antibody should either block or delay the cell response, as measured by CI and CIT50. To test this notion, Vero cell cultures on E-plates were inoculated with 105 PFU of WNV or SLEV which was pre-incubated with serially diluted sera containing a known neutralizing antibody titer determined by PRNT80, and the WNV or SLEV-induced CPE was monitored in real-time using the RTCA system. As shown in Fig. 4, a WNV neutralizing antibody titer of ≥1:640 blocked 105 PFU WNV-induced CPE for >125 h. However, at antibody titers between 1:40 and 1:320, the CIT50 increased as a significant linear function of neutralizing antibody titer (R2= 0.983, Fig. 4).
Figure 4.
Quantitative detection of WNV neutralizing antibody titer using real-time monitoring of virus-induced CPE. Virus-induced CPE kinetic pattern of Vero cells presented with 106 PFU of WNV incubated with different titers of conspecific neutralizing antibody; control (ctrl), no infection. The cross line indicates the 50% decline of CI value. Linear regression between TCL50 value and the WNV PRNT antibody titer was significant between 1:20 and 1:320 with goodness of fit for the data expressed by R2. Antibody values are the reciprocal of the endpoint PRNT titers.
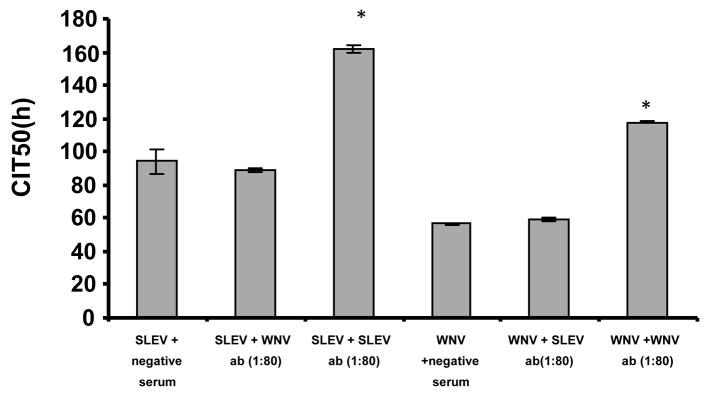
To test the specificity of the neutralizing antibodies, a cross neutralization assay was done using WNV and SLEV specific antibodies in House finch sera with previously determined PRNT80 titers (Fig. 5). In cells infected with WNV, sera with WNV antibodies at a titer of 1:80, but not SLEV antibodies, significantly delayed the CIT50 compared to the WNV plus negative sera control. Similarly, in the wells infected with SLEV, antibodies to SLEV at a titer of 1:80, but not antibodies to WNV, significantly delayed the CIT50 compared to SLEV plus negative control sera. These results indicated that there was no cross neutralization detected between WNV and SLEV antibodies using the RTCA assay system. This finding was unexpected, because of the heterologous animistic responses and cross protection documented for House Finches infected with WNV or SLEV and then challenged a month later with heterologous viruses (Fang and Reisen 2006), but agreed with the >4× difference seen in PRNT80 end point titers for sera from birds with recent infections.
Figure 5.
Specificity of neutralizing activity (ab) measured by RTCA between sera with WNV and SLEV specific neutralizing antibodies. The y-axis plots the CIT50 values in hours of Vero cells infected with either 106 PFU of WNV or SLEV in the presence of either WNV specific neutralizing antibody (1:80) or SLEV specific neutralizing antibody (1:80) or negative sera as indicated. The bars show the standard deviation (* p<0.01, as determined by student t-test between specific neutralizing antibody sample and corresponding negative control sample). X-axis labels indicate the test virus + heterologous or homologous antibody at a PRNT80 titer of 1:80.
3.4. Single well detection of neutralizing antibody titer against WNV
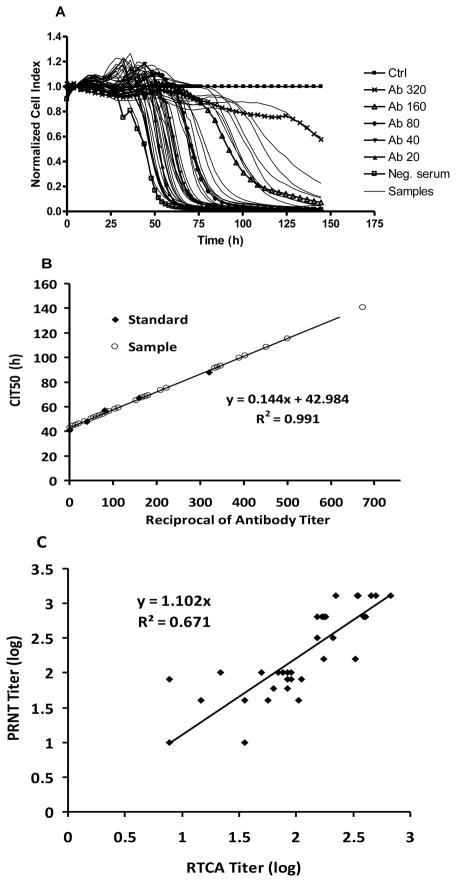
Because the CIT50 increased as a linear function of neutralizing antibody titer (Fig. 4), comparing CI curves for unknown sera concurrently with control sera of known PRNT titers may allow the simultaneous determination of PRNT80 titers for multiple sera using a single e-well protocol. To test this idea, 40 sera from field-collected birds whose sera were WNV antibody positive by EIA and previously were confirmed by standard PRNT80 done in 6-well plates were each tested by RTCA in single well of an E-plate. As shown in Fig. 6, time dependent CI profiles for serum samples were compared with known standards with neutralizing antibody titers ranging between 1:40 and 1:320 after challenge with 106 PFU WNV. PRNT80 titer above 1:640 completely neutralized 106 PFU and the resulting curves appeared similar to controls (data not shown). CI profiles varied markedly among unknown samples. Complete neutralization was detected in sample 7 (i.e., titer ≥1:640), whereas samples 1,3,4,9,19,22,23 and 35 were negative or had estimated titers <1:20 when compared to the standards. The remaining samples showed widely-distributed CI profiles across the time periods monitored (Fig. 6A). To estimate the PRNT80 titer of a given sample, a standard regression curve was calculated using the CIT50 values from known samples (Fig. 6B) and the titers from unknown samples then were determined based on the standard regression of the CIT50 value from cell response profiles. These calculated titers could attain any value and therefore were different from the discrete dilution numbers of 20, 40, 80, 160, 320 or 1280 typically reported for PRNT titers. These values then were compared to and found to be less than the corresponding titers obtained from the PRNT80 (Table 2). A highly significant correlation (P<0.01) was found between conventional PRNT80 and single well titration using the RTCA system, as shown in the log10 plots of RTCA titer vs PRNT80 titer (R2=0.67, Fig. 6C). These results indicated that for the first time WNV neutralizing antibody activity could be determined within a single well and without performing serial dilutions. These results may make rapid antibody detection possible in population surveillance studies.
Figure 6.
Neutralizing antibody titers estimated for 40 sera from field-collected birds measured in a single well per sample. (A) WNV-induced CPE kinetic patterns of WNV-infected cells in the presence of known titers of specific WNV neutralizing antibody (indicated) or unknown individual samples with only one fixed dilution (1:40). Control (Ctrl), no antibody. (B) Standard regression curve (CIT50=0.1448 * Ab Titer + 42.984) generated from CIT50 values of known WNV neutralizing antibody with different titers (◇) and the distribution of CIT50 values (○) estimated from individual field samples. (C) Log plots of standard PRNT titers versus single-well RTCA estimated titers. The slope of 1.1023 for the regression equation indicated that the RTCA titer values were slightly lower than PRNT titers.
4. Discussion
A real-time monitoring method was described for measuring viral induced CPE in cell culture and its inhibition by neutralizing antibody using electronic impedance biosensor-based RTCA technology. RTCA has been used previously for cytotoxicity assays showing time-dependent cell response profiles to the exposure of chemical compounds (Abassi et al. 2009). In WNV or SLEV-infected Vero cells, viral replication led to cytolysis and by using the RTCA system, infection kinetics was monitored by changes in the cell index. Notably, virus-induced CPE kinetics appeared different from what has been reported for chemical-induced cell death kinetics and exhibited a consistent and repeatable infectious dose-related pattern (Fig. 1). Similar to different CI patterns seen for different cell types in standard cell culture, the onset and timing of CPE kinetics were readily distinguishable between WNV and SLEV, even though these viruses belong to the same serocomplex within the Flaviviridae, indicating that CPE kinetics may be unique for a given virus species and perhaps strain. Such features (or kinetic patterns) might be related to viral infectivity and virulence, and therefore distinguishable between stains of same virus (Zhang et al. 2010). Further investigation of virus-mediated CPE kinetics and viral virulence levels among WNV strains would seem warranted and may help to develop a quantitative and functional assay to identify genetic changes in virulence.
A mathematical model was developed to simulate the cell index response to different virus infection doses for WNV and SLEV. Three parameters were included in the model: virus replication doubling time DTv, virus number threshold for host cell death NTv, and average cell death time Tc. The replication doubling time for WNV in Vero cell culture was about three times faster than that for SLEV (4.0 vs 13.5 hrs). This finding is qualitatively in agreement with previous reports that SLEV typically grows slower in Vero cell culture than WNV (Hayes 1989; Monath 1980). In addition, the intracellular virus number thresholds for initiating cytolysis were 370 and 35 PFU for WNV and SLEV, respectively, suggesting that the triggering event for the cell death may be quite different between these two viruses. In addition, the cell death time for WNV (9 hrs) was faster than for SLEV (25 hrs), indicating that WNV may be more virulent in inducing CPE in Vero cells. These findings were in general agreement with the observation that SLEV exhibits characteristically smaller diameter plaque size (Hayes 1989; Monath 1980) and produces lower viremia and mortality in the same avian hosts (Reisen et al. 2003; Reisen et al. 2005) than WNV.
The ‘gold standard’ for quantitative measurement of neutralizing antibody is the beta PRNT, in which the end point neutralizing antibody titer is determined by the highest dilution which neutralizes >80% of 75 to 100 PFU of conspecific virus. However, the standard PRNT is labor intensive, expensive and not conducive for high throughput. The current study demonstrated the possibility of using a single well to measure neutralizing antibody titer by real-time monitoring of CPE kinetics in the presence of an unknown antibody sample. This assay would seem to work well for free-ranging birds, where PRNT titers typically remain <1:320. Therefore, specimen throughput could be markedly expanded. A given titer of either anti-WNV or anti-SLEV antibody showed a similar neutralizing curve at the same titer, indicating that with standard neutralizing curves, the neutralizing activity in a single well may be quantitatively detected without serial dilution. Because the RTCA system seemed to be specific, there would seem to be limited confoundment due to cross reactivity, but sera still should be tested against cross reacting viruses as done here for SLEV and WNV.
6. Conclusions
The RTCA assay based on cell-substrate electric impedance technology was used successfully for monitoring WNV and SLEV-induced CPE in Vero cell culture. In comparison with existing methods, the RTCA assay offered the advantages of real-time, quantitative measurement of the entire CPE process, and single well detection of neutralizing antibody titer. With mathematical modeling, the assay allowed the derivation of quantitative information about various CPE-related parameters, including virus replication doubling time, intracellular virus number threshold for triggering cell death, and time to cell death. Furthermore, the RTCA assay involved a single processing step for virus inoculation thereby reducing possible laboratory exposure to infectious virus and increasing safety. Finally, the assay is amenable to high throughput and potentially could be applied to viral-drug screening, viral diagnosis and virology-associated research applications.
Table 1.
Summary of parameter values derived from mathematical modeling for WNV- and SLEV-induced CPE.
| DTv (hr) | NTv (PFU) | Tc (hr) | |
|---|---|---|---|
| WNV | 4 | 370 | 9 |
| SLEV | 13.5 | 35 | 25 |
Acknowledgments
S Garcia and M Dannen of the Center for Vectorborne Diseases provided technical assistance. This research was funded, in part, by Grant RO1-AI55607 from the National Institutes of Allergy and Infectious Diseases, NIH.
Footnotes
Publisher's Disclaimer: This is a PDF file of an unedited manuscript that has been accepted for publication. As a service to our customers we are providing this early version of the manuscript. The manuscript will undergo copyediting, typesetting, and review of the resulting proof before it is published in its final citable form. Please note that during the production process errors may be discovered which could affect the content, and all legal disclaimers that apply to the journal pertain.
Reference List
- Abassi YA, Xi B, Zhang W, Ye P, Kirstein SL, Gaylord MR, Feinstein SC, Wang X, Xu X. Kinetic cell-based morphological screening: prediction of mechanism of compound action and off-target effects. Chem Biol. 2009;16:712–723. doi: 10.1016/j.chembiol.2009.05.011. [DOI] [PMC free article] [PubMed] [Google Scholar]
- Atienza JM, Yu N, Kirstein SL, Xi B, Wang X, Xu X, Abassi YA. Dynamic and label-free cell-based assays using the real-time cell electronic sensing system. Assay Drug Dev Technol. 2006;4:597–607. doi: 10.1089/adt.2006.4.597. [DOI] [PubMed] [Google Scholar]
- Atienza JM, Zhu J, Wang X, Xu X, Abassi Y. Dynamic monitoring of cell adhesion and spreading on microelectronic sensor arrays. J Biomol Screen. 2005;10:795–805. doi: 10.1177/1087057105279635. [DOI] [PubMed] [Google Scholar]
- Fang Y, Reisen WK. Previous infection with West Nile or St. Louis encephalitis viruses provides cross protection during reinfection in house finches. Am J Trop Med Hyg. 2006;75:480–485. [PubMed] [Google Scholar]
- Goddard LB, Roth AE, Reisen WK, Scott TW. Vector competence of California mosquitoes for West Nile virus. Emerg Infect Dis. 2002;8:1385–1391. doi: 10.3201/eid0812.020536. [DOI] [PMC free article] [PubMed] [Google Scholar]
- Hayes CG. West Nile Fever. In: Monath TP, editor. The arboviruses: epidemiology and ecology. Boca Raton, FL: CRC Press; 1989. pp. 59–88. [Google Scholar]
- Kramer LD, Styer LM, Ebel GD. A Global Perspective on the Epidemiology of West Nile Virus. Annu Rev Entomol. 2008;53:61–81. doi: 10.1146/annurev.ento.53.103106.093258. [DOI] [PubMed] [Google Scholar]
- Kwan JL, Kluh S, Madon MB, Reisen WK. West Nile virus emergence and persistence in Los Angeles, california, 2003–2008. Am J Trop Med Hyg. 2010;83:400–412. doi: 10.4269/ajtmh.2010.10-0076. [DOI] [PMC free article] [PubMed] [Google Scholar]
- Lanciotti RS, Kerst AJ. Nucleic Acid Sequence-Based Amplification Assays for Rapid Detection of West Nile and St. Louis Encephalitis Viruses. J Clin Microbiol. 2001;39:4506–4513. doi: 10.1128/JCM.39.12.4506-4513.2001. [DOI] [PMC free article] [PubMed] [Google Scholar]
- Monath TP. St Louis encephalitis. Washington, DC: Am. publ. Hlth. Assoc; 1980. [Google Scholar]
- Oceguera LF, III, Patiris PJ, Chiles RE, Busch MP, Tobler LH, Hanson CV. Flavivirus serology by Western blot analysis. Am J Trop Med Hyg. 2007;77:159–163. [PubMed] [Google Scholar]
- Patiris PJ, Oceguera LF, III, Peck GW, Chiles RE, Reisen WK, Hanson CV. Serologic diagnosis of West Nile and St. Louis encephalitis virus infections in domestic chickens. Am J Trop Med Hyg. 2008;78:434–441. [PubMed] [Google Scholar]
- Reisen WK. Epidemiology of St. Louis encephalitis virus. In: Chambers TJ, Monath TP, editors. The Flaviviruses: detection, diagnosis and vaccine development. San Diego, CA: Elsevier Academic Press; 2003. pp. 139–183. [Google Scholar]
- Reisen WK, Carroll BD, Takahashi R, Fang Y, Garcia S, Martinez VM, Quiring R. Repeated West Nile virus epidemic transmission in Kern County, California, 2004–2007. J Med Entomol. 2009;46:139–157. doi: 10.1603/033.046.0118. [DOI] [PMC free article] [PubMed] [Google Scholar]
- Reisen WK, Chiles RE, Martinez VM, Fang Y, Green EN. Experimental infection of California birds with western equine encephalomyelitis and St. Louis encephalitis viruses. J Med Entomol. 2003;40:968–982. doi: 10.1603/0022-2585-40.6.968. [DOI] [PubMed] [Google Scholar]
- Reisen WK, Fang Y, Martinez VM. Avian host and mosquito (Diptera: Culicidae) vector competence determine the efficiency of West Nile and St. Louis encephalitis virus transmission. J Med Entomol. 2005;42:367–375. doi: 10.1093/jmedent/42.3.367. [DOI] [PubMed] [Google Scholar]
- Solly K, Wang X, Xu X, Strulovici B, Zheng W. Application of real-time cell electronic sensing (RT-CES) technology to cell-based assays. Assay Drug Dev Technol. 2004;2:363–372. doi: 10.1089/adt.2004.2.363. [DOI] [PubMed] [Google Scholar]
- Xing JZ, Zhu L, Jackson JA, Gabos S, Sun XJ, Wang XB, Xu X. Dynamic monitoring of cytotoxicity on microelectronic sensors. Chem Res Toxicol. 2005;18:154–161. doi: 10.1021/tx049721s. [DOI] [PubMed] [Google Scholar]
- Yasumura T, Kawakita M. The research for the SV40 by means of tissue culture. Nippon Rinsho. 1963;21:1201–1219. [Google Scholar]
- Yu N, Atienza JM, Bernard J, Blanc S, Zhu J, Wang X, Xu X, Abassi YA. Real-time monitoring of morphological changes in living cells by electronic cell sensor arrays: an approach to study G protein-coupled receptors. Anal Chem. 2006;78:35–43. doi: 10.1021/ac051695v. [DOI] [PubMed] [Google Scholar]
- Zhang M, Fang Y, Brault AC, Reisen WK. Variation in western equine encephalomyelitis viral strain growth in mammalian, avian and mosquito cells fails to explain temporal changes in enzootic and epidemic activity in California. Vector-Borne and Zoonotic Diseases. 2010 doi: 10.1089/vbz.2010.0078. [in press] [DOI] [PMC free article] [PubMed] [Google Scholar]


