Abstract
Previously, we reported new methods for ultrasound signal characterization using entropy, Hf; a generalized entropy, the Renyi entropy, If(r); and a limiting form of Renyi entropy suitable for real-time calculation, If,∞. All of these quantities demonstrated significantly more sensitivity to subtle changes in scattering architecture than energy-based methods in certain settings. In this study, the real-time calculable limit of the Renyi entropy, If,∞, is applied for the imaging of angiogenic murine neovasculature in a breast cancer xenograft using a targeted contrast agent. It is shown that this approach may be used to detect reliably the accumulation of targeted nanoparticles at five minutes post-injection in this in vivo model.
I. Introduction
In previous work, we have described the use of a targeted nanoscale contrast agent for use with MRI, X-ray and ultrasound. In this application, αvβ3-targeted perfluorocarbon core nanoparticles are injected into the blood stream where they circulate and accumulate at angiogenic sites that are associated with advancing fronts of growing tumors. The geometry of this angiogenic neovasculature is highly convoluted, and the targeting sites sparse, so that the accumulating nanoparticles never comprise a planar “specular” reflector. Consequently, a scheme capable of sub-resolution sensitivity is required for their detection.
Sub-resolution detection has a long history and has typically been based on statistical signal processing using Gaussian, Rayleigh, or Rician statistics [1]–[8]. The technique we investigate in this study utilizes an approach formulated with a significantly different underlying mathematical structure [9]. It is based on the use of various forms of entropy analysis for the detection of perfluorocarbon nanoparticles targeted to tumor neovasculature [10]–[13]. These quantities are computed using a density function determined by each individual radiofrequency (RF) A-line considered as a noise-free (or nearly so) measurable function [14]. All measurable functions, not just noise functions, have mathematically well-defined distributions (for they are all “random” variables), which may be used to compute any one of several entropies. We have found that the use of these novel information-theoretic receivers is often advantageous for overcoming certain challenges related to acoustic characterization of sparse collections of nanoparticles. The physically robust liquid perfluorocarbon nanoparticles are intrinsically weak individual scatterers in the clinical ultrasound frequency range due to their small size and nongaseous nature, and are typically targeted to physiologic features at interfaces having inherent impedance mismatches (e.g. vessel walls). In addition, the epitopes to which they are targeted may be sparsely located in the accessible vasculature. Entropy techniques are well-suited to detecting small changes in the shape of the backscattered RF waveforms which may be masked by other strongly scattering features when using typical energy-based analyses. The end goal is to enable detection of nanoparticles accumulating at epitopes of interest in the least amount of time after administration, with a view towards demonstrating sensitivity to smaller quantities of contrast agent, thereby potentially reducing patient discomfort and increasing clinical throughput.
The in vivo studies in which we have utilized these techniques typically entail intravenous injection of nanoparticles that are targeted to angiogenic markers present in cancerous or precancerous tissue. The tumor site is monitored ultrasonically as the contrast agent circulates, and backscattered RF waveforms are acquired at specific time points for entropy analysis. Initial studies showed that a limiting form, Hf, of the Shannon entropy, HS, enabled detection of nanoparticle accumulation at 30 minutes post-injection in a mouse model of squamous metaplasia [11]. Subsequent work demonstrated that a generalized form of entropy, the Renyi entropy If(r), could be used to distinguish backscatter differences from the previously acquired data at only 15 minutes post-injection [12]. If(r), where r may be thought of as a reciprocal “temperature” in the statistical mechanics sense, is defined for all r < 2; the improved detection results were obtained with r = 1.99.
Although the computational effort to obtain these results precluded clinical application with currently available equipment, the study raised the possibility of further sensitivity improvements by using values of r closer to the limiting value of 2, where If(r) approaches infinity. Further work based on this limiting form, labeled If,∞, confirmed its utility for rapid detection of nanoparticle targeting in the same animal model [13]. Moreover, the implementation of the algorithm used to compute If,∞ was much less computationally intensive, having an operation count lower than that used to produce the signal envelope (currently the standard for real-time ultrasonic imaging display), thus demonstrating its suitability for implementation in a real-time imaging system. As this technique is based on a “moving window” analysis of digitized RF (which requires some sacrifice in spatial resolution), clinical implementation of entropy detection would probably follow the same approach currently employed in color Doppler or strain-rate imaging modalities, in which the conventional B-mode image is overlaid with a color-coded mapping; a B-mode/entropy image could be constructed in a similar fashion.
We now present new data acquired from a murine tumor model injected with nanoparticles targeted to the αvβ3 integrin, a marker for angiogenesis. Ultrasonic data are acquired on a finer time scale (every 5 minutes over the course of 1 hour) to further delineate the efficacy of entropy analysis for both sensitive and specific detection of nanoparticle accumulation in and around the tumor capsule. The results of this analysis are compared, using various statistical criteria, with corresponding conventional energy-based measures applied to the same data.
II. Approach
All entropy results in this study were obtained using
| (1) |
which is derived from an asymptotic analysis of the Renyi entropy If(r → 2) as described previously [13]. In this application, f(t) refers to an individual RF waveform, f′(t) and f″(t) are its first and second derivatives with respect to time, and tk is the time at which the kth extremum occurs. Previous studies have shown that this quantity (i.e., If,∞, as well as If(r), and Hf, which is a generalization of If(r)) can be more sensitive to subtle changes in scattering architecture than more commonly used energy-based measures [11]–[13]. We base our current study exclusively on If,∞, since this quantity is calculable in real-time as described previously [13].
III. Materials and Methods
A. Animal Model
The study was performed according to an approved animal protocol and in compliance with guidelines of the Washington University institutional animal care and use committee.
Human MDA435 cancer cells were implanted in the inguinal fat pad of fifteen athymic nude mice between 19 and 20 days prior to acquisition of data. After the this period of tumor growth, five of these animals were injected with αvβ3-targeted nanoparticles, five were injected with nontargeted nanoparticles and five were injected with saline.
Prior to imaging, each mouse was pre-anesthesitized with a ketamine/xylazine cocktail, and injected subsequently through the tail vein with either 30 μL of αvβ3-targeted nanoparticle emulsion, 30 μL of non-targeted nanoparticle emulsion, or 30 μL of saline (equivalent to a whole body dose of 1.0 mL/kg; the preparation and properties of these emulsions have been described previously, [12], [13]). The mouse was then placed on a heated platform maintained at 37°C, and anesthesia was administered continually with isoflurane gas through a nose cone. Post-injection, ultrasound data were acquired at 5 minute intervals for 1 hour. After the ultrasound data were collected, the mouse was euthanized and the tumor was excised for histological staining.
B. Ultrasonic Data Acquisition
A schematic of the experimental setup is shown in Fig. 1. RF data were acquired with a research ultrasound system (Vevo 660, Visualsonics, Toronto, Canada) having analog and sync ports to permit digitization. Tumors were located and imaged with a 35 MHz single element probe, and the RF data corresponding to single frames were stored for off-line analysis. Each frame consisted of 384 lines of 2048 twelve-bit words acquired at a sampling rate of 200 MHz using a CompuScope 12400 digitizer card (GaGe Applied Technologies, Lockport, IL) in a controller PC. Each frame corresponded spatially to a region 1.5 cm wide and 0.8 cm deep. At the bottom left of Fig. 1 is a conventionally formed image from one of the mice used in our study. Also shown in this figure is a representative histological section extracted from an example mouse model. Visible in the section is an area of skin, below which is a thin angiogenic layer identified by immunohistochemical staining, and below that, a portion of the tumor capsule. The close proximity of neovasculature to the skin-transducer interface is one of the primary obstacles that must be overcome by any quantitative detection scheme intended to determine the extent of this region.
Fig. 1.
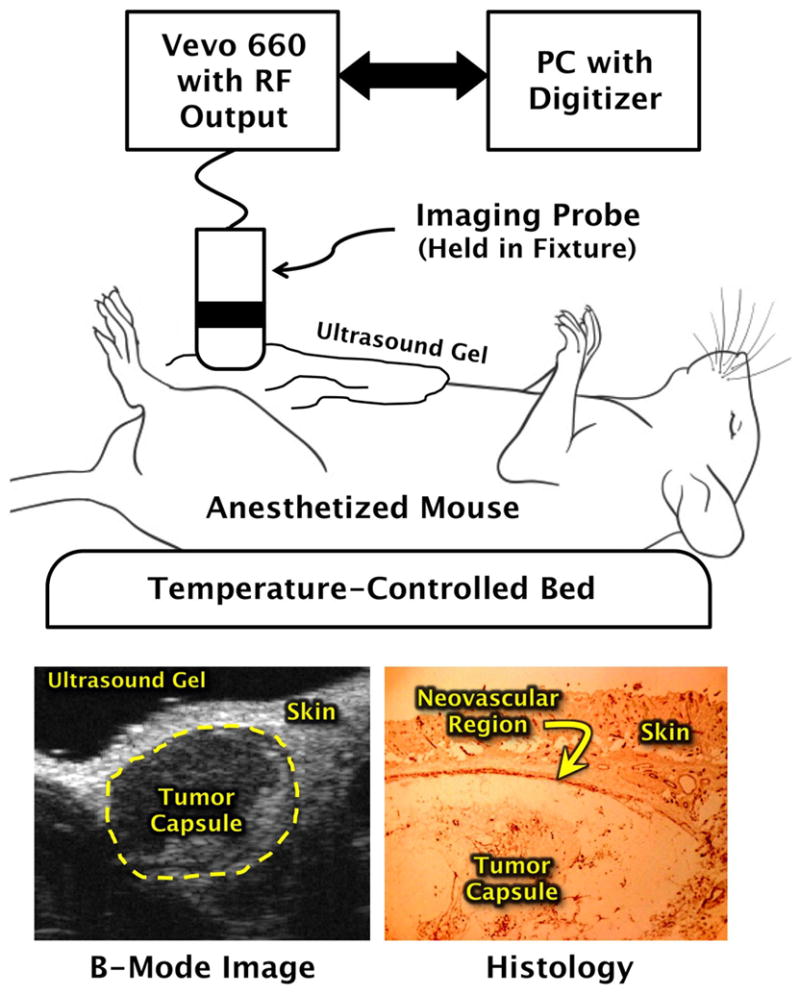
Schematic diagram of the equipment used to acquire in vivo backscattered RF data. Bottom panels show example B-mode ultrasound image of tumor (left), and a stained histologic section of a tumor indicating portions where αvβ3-targeted nanoparticles nanoparticles could adhere.
C. Ultrasonic Image Preparation and Processing
Since the real-time entropy depends on the second derivative of the raw data, a potentially noise-enhancing process, all RF data were lowpass-filtered in the frequency domain as a first step in data analysis. This was accomplished by multiplying the Fourier transform of each RF line by the filter function, F(f),
| (2) |
where a = 0.25 and fc = 36 MHz. The cutoff frequency fc was chosen to correspond to the typical upper limit of the meaningful bandwidth of the backscattered signal from within the tumors after being attenuated by overlying tissue. The function F(f) has the shape of a smoothed rectangular window whose passband drops off near fc. The coefficient a governs the sharpness of this transition. This function was chosen as a gate function since it is infinitely differentiable. We have investigated other window functions (e.g., various pole number Butterworth filters) and find that all perform in a roughly equivalent way. The use of other types of noise suppression, such as the application of smoothing splines to the input RF waveforms, is an active area of research in our laboratory whose impact is currently being assessed.
After filtering, each of the 384 RF lines in the frame was first up-sampled from 2048 to 4096 points, using a cubic spline fit to the original data set in order to improve the stability of the entropy algorithms. A by-product of this “order N″ (where N is the number of sample points) algorithm is simultaneous output of a corresponding array of second derivative values of the fit function [15]. Next, a moving window analysis was performed on the second derivative data set, using Eq. (1) to compute If,∞, by translating a rectangular window (256 points long, 0.64 μs) in 0.08 μs steps (32 points), resulting in 121 window positions within the output data set. For comparison, an analogous procedure was performed on the same data using a conventional imaging metric, based on the logarithm of the signal energy (log[Ef]).
Grayscale images formed from the processed data were subjected to an image-histogram based analysis to quantify levels of enhancement, beginning with computation of the normalized probability density function (PDF) of the image sequence (i.e., 0, 5, …, 60 minute images). The PDF was then integrated to obtain the cumulative distribution function (CDF) of the image sequence. The pixel values corresponding to the lower 2%, 4%, …, 98% of the CDF were then used to segment each image in the sequence into two regions corresponding to “enhanced” and “unenhanced” tissue. The mean value of pixels in the “enhanced” region was computed for each image in the sequence as a function of time post-injection. Beyond the initial selection of the imaging plane and digitization window, no user-drawn regions of interest were utilized in the image analysis, all digitized signals were included.
IV. Results and Discussion
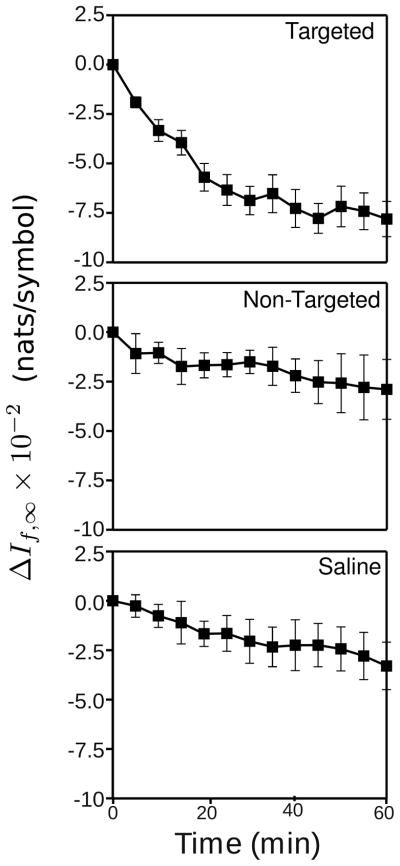
Fig. 2 shows the average change in If,∞ (relative to the first observation point, which was typically acquired within 1 minute of nanoparticle injection) for the animals used in this study labeled in each plot by group. Error bars are also shown at each time time point. These plots were obtained using the If,∞ image segmented by setting the CDF threshold to include only the bottom 30% of If,∞ pixel values. In the top panel is the plot for the animals injected with αvβ3-targeted nanoparticles, which decreases as a function of time. The downward trend is less evident for both the non-targeted and saline control groups. It should be noted that the trend for decreasing If,∞ values with time is opposite to what has been reported in a different model of cancer growth, the K14-HPV16 precancerous mouse ear analyzed with a variety of information-theoretic metrics [11]–[13]. Although it is not clear what effect the difference in tissue type might produce, we note that there is substantially more attenuation associated with ultrasound backscattered from the thicker and deeper tissue regions of the solid tumors described here than with the very thin ears of the previous studies. Although not reported here, we have observed that altering the spectral content of the input waveforms via filtering or other means can change the direction of the temporal trends seen in If,∞ from negative to positive, or vice versa; however, the differences between targeted and control groups are typically preserved, and it is these differences that are important for reliable detection of accumulating nanoparticles.
Fig. 2.
Plots of the average change in If,∞ with time for each group in this study, obtained by segmenting the If,∞ images by setting the CDF threshold to include only the lowest 30% of pixel values.
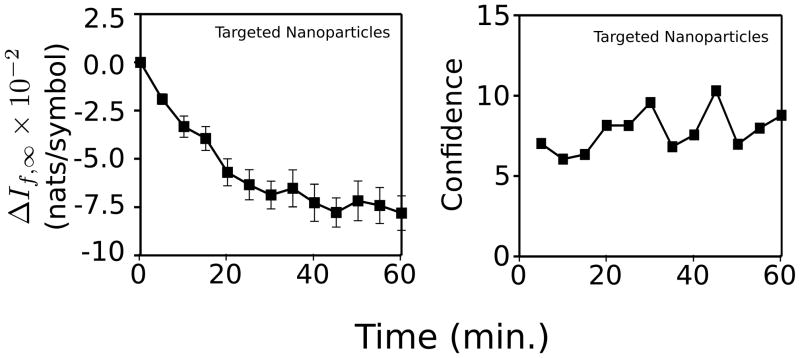
The average plot for the group injected with αvβ3-targeted nanoparticles is reproduced on the left side of Fig. 3. The right-hand side of the figure shows a plot of the corresponding ratio of the mean value to standard error for each time point. For the purposes of detecting a change from the baseline value, it is actually this ratio that is important. To shorten subsequent discussion of our results we will define this ratio, labeled the “confidence,” [16] c:
| (3) |
Fig. 3.
Left: average time-course of ΔIf,∞ images obtained from MDA435-implanted mice injected with αvβ3-targeted nanoparticles (same data as shown in top right of Fig. (2)). Right: corresponding c values. These data were obtained for the CDF-threshold set to include the lower 30% of pixel values in the If,∞ from each of the images in each group.
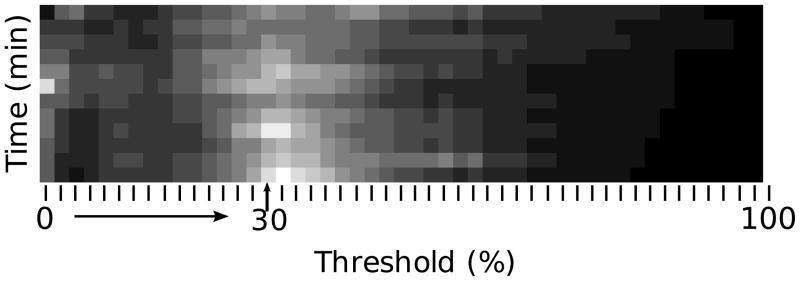
As stated above, the analysis shown in Fig. 3 was performed for all even CDF-thresholds between 0 to 98%. A summary of all resulting confidence values for mice injected with αvβ3-targeted nanoparticles group is depicted as a gray-scale image in Fig. 4. The grayscale value in the image corresponds to the value of c, with brighter pixels signifying greater values of c. As the image shows, the greatest confidence values are obtained for a range of CDF-thresholds between roughly 2% and 50%. For reference, the column corresponding to the CDF-threshold of 30% that was discussed in Fig. 3 is indicated by an arrow and label.
Fig. 4.
Confidence values, c, plotted as a function of time and CDF threshold for tumor-implanted mice injected with αvβ3-targeted nanoparticles.
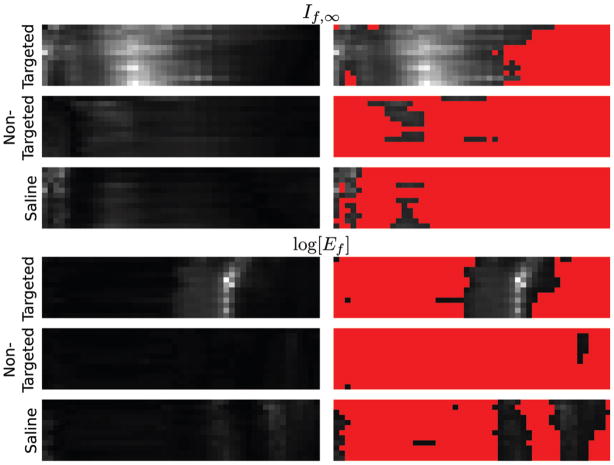
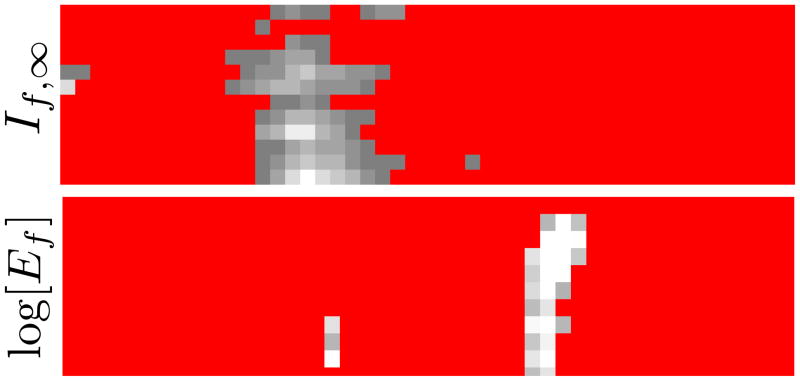
The If,∞ confidence images for all groups studied are shown in grayscale format in the top left half of Fig. 5. In the top right of the figure, identical images are shown, but with the overlay of a threshold mask to display only confidence values greater than 2.0; all other values have been colored red. The gray pixels represent the time/analysis-threshold combinations which are statistically significant by the “two sigma” criterion. This threshold was chosen since it represents a common standard for statistical analysis, (i.e., 95% confidence interval). In the bottom half of the figure are shown the corresponding images for the log[Ef] receiver. For the conventions used in this study, the portion of the image selected by the segmentation increases as the analysis threshold is increased, so that at the 2% threshold very little of the image is selected for analysis, while at 98% nearly all of the image is included. We note that the areas in the panels for the If,∞ receiver for the group injected with αvβ3-targeted nanoparticles is somewhat larger than for the log[Ef] panel for the same group, indicating a broader range of analysis thresholds that imply the presence of targeted nanoparticles accumlating. This indicates that according to the “two sigma” criterion, the If,∞ receiver produces “true positives” over a broader range of analysis thresholds than does the log[Ef] receiver and is potentially a more robust statistic. Additionally, the total gray area in the control group panels (corresponding to targeted nanoparticle and saline injection) is less in the If,∞ panels than in the log[Ef] panels, indicating a smaller number of “false” positives are produced by the If,∞ receiver.
Fig. 5.
Top left: a comparison of the confidence images for the If,∞ receiver, like that shown in Fig. (4), for all groups in our study. Top right: same data, but with all confidence values below 2 shown in red. Bottom left a comparison of the confidence images for the log[Ef] receiver. Bottom right: same data, with all confidence values below 2 shown in red.
It is possible to formulate the detection problem in ways other than the “two sigma” criterion. One of these is shown in Fig. 6, where we have adjusted the thresholds of the confidence images to the minimum value required to eliminate “false” positives in the receiver outputs in the two control groups. For the If,∞ receiver, this requires setting c = 6.92, for log[Ef], c = 9.55. As in Fig. 5, the gray pixels represent those time/analysis-threshold combinations at which statistical significance (by the “no false positive” criterion) is observed. We note that by this criterion the gray region is again larger for the If,∞ receiver than it is for the log[Ef] receiver. Additionally, the presence of gray pixels in the top row of the If,∞ confidence image indicates that detection of accumulating nanoparticles occurs within 5 minutes of particle injection (again, with no false positives), whereas the energy-based receiver registers a significant change only after 10 minutes of nanoparticle introduction. However, we point out that by both criteria we are able to successfully detect accumulation of targeted nanoparticles using either receiver.
Fig. 6.
A comparison of the confidence images, c, like that shown in Fig. 5, (top) for If,∞ images with s = 6.92, and log[Ef], images with c = 9.55. These thresholds were chosen as the minimum which produced no “false positives” in either of the control groups when analyzed by these signal receivers.
V. Conclusion
Although both If,∞ and log[Ef] are able to distinguish between the group injected with αvβ3-targeted nanoparticles and all other controls, and Fig. 5 and Fig. 6 suggest that the entropy receiver may be more robust, much work remains to be done to demonstrate clinical utility. One encouraging fact is the ability to select operating parameters to preclude any “false” negatives from being detected within the treated group. Given that the spatial distribution of scatterers is likely to be significantly different between the control groups and the group injected with targeted nanoparticles, with nanoparticles in this group being concentrated in the advancing front of the tumor, it is possible that frequency filtering of the RF waveforms might be optimized for input to the If,∞ receiver by high-pass filtering. In addition, utilization of a smoothing spline in place of the non-smoothing spline used in this study may yield improvements in the noise immunity of the If,∞ receiver. These algorithms are being actively investigated in our group at this time.
Acknowledgments
This study was funded by NIH EB002168, HL042950, and CO-27031 and NSF DMS 0501079. The research was carried out at the Washington University Department of Mathematics and the School of Medicine.
Contributor Information
J. N. Marsh, Email: jnm@cvu.wustl.edu, School of Medicine at Washington University in St. Louis.
K. D. Wallace, School of Medicine at Washington University in St. Louis.
J. E. McCarthy, Department of Mathematics at Washington University in St. Louis
M. V. Wickerhauser, Department of Mathematics at Washington University in St. Louis
G. M. Lanza, School of Medicine at Washington University in St. Louis.
S. A. Wickline, School of Medicine at Washington University in St. Louis.
M. S. Hughes, School of Medicine at Washington University in St. Louis
References
- 1.Wagner RF, Smith SW, Sandrik JM, Lopez H. Statistics of speckle in ultrasound b-scans. IEEE Trans Son Ultrason. 1983 May;30(3):156–163. [Google Scholar]
- 2.Sleefe GE, Lele PP. Tissue characterization based on scatterer number density estimation. IEEE Trans Ultrason Ferroelectr Freq Control. 1988 Nov;35(6):749–757. doi: 10.1109/58.9332. [DOI] [PubMed] [Google Scholar]
- 3.Wagner RF, Insana MF, Brown DG. Statistical properties of radio-frequency and envelope-detected signals with applications to medical ultrasound. J Opt Soc Am A. 1987 May;4(5):910–922. doi: 10.1364/josaa.4.000910. [DOI] [PMC free article] [PubMed] [Google Scholar]
- 4.Lizzi FL, Ostromogilsky M, Feleppa EJ, Rorke MC, Yaremko MM. Relationship of ultrasonic spectral parameters to features of tissue microstructure. IEEE Trans Ultrason Ferroelectr Freq Control. 1987 May;34(3):319–329. doi: 10.1109/t-uffc.1987.26950. [DOI] [PubMed] [Google Scholar]
- 5.Donohue KD, Huang L, Burks T, Forsberg F, Piccoli CW. Tissue classification with generalized spectrum parameters. Ultrasound Med Biol. 2001 Nov;27(11):1505–1514. doi: 10.1016/s0301-5629(01)00468-9. [DOI] [PubMed] [Google Scholar]
- 6.Shankar PM, Dumane VA, George T, Piccoli CW, Reid JM, Forsberg F, Goldberg BB. Classification of breast masses in ultrasonic b scans using nakagami and k distributions. Phys Med Biol. 2003 Jul;48(14):2229–2240. doi: 10.1088/0031-9155/48/14/313. [DOI] [PubMed] [Google Scholar]
- 7.Shankar PM. The use of the compound probability density function in ultrasonic tissue characterization. Phys Med Biol. 2004 Mar;49(6):1007–1015. doi: 10.1088/0031-9155/49/6/011. [DOI] [PubMed] [Google Scholar]
- 8.Mogatadakala KV, Donohue KD, Piccoli CW, Forsberg F. Detection of breast lesion regions in ultrasound images using wavelets and order statistics. Med Phys. 2006 Apr;33(4):840–849. doi: 10.1118/1.2174134. [DOI] [PubMed] [Google Scholar]
- 9.Maurizi BN. Estimation of an entropy based functional. Entropy. 2010 March;12(3):338–374. [Google Scholar]
- 10.Hughes MS, Marsh JN, Zhang H, Woodson AK, Allen JS, Lacy EK, Carradine C, Lanza GM, Wickline SA. Characterization of digital waveforms using thermodynamic analogs: detection of contrast-targeted tissue in vivo. IEEE Trans Ultrason Ferroelectr Freq Control. 2006 Sep;53(9):1609–1616. doi: 10.1109/tuffc.2006.1678189. [DOI] [PubMed] [Google Scholar]
- 11.Hughes MS, McCarthy JE, Marsh JN, Arbeit JM, Neumann RG, Fuhrhop RW, Wallace KD, Znidersic DR, Maurizi BN, Baldwin SL, Lanza GM, Wickline SA. Properties of an entropy-based signal receiver with an application to ultrasonic molecular imaging. J Acoust Soc Am. 2007 Jun;121(6):3542–3557. doi: 10.1121/1.2722050. [DOI] [PubMed] [Google Scholar]
- 12.Hughes MS, Marsh JN, Arbeit JM, Neumann RG, Fuhrhop RW, Wallace KD, Thomas L, Smith J, Agyem K, Lanza GM, Wickline SA, McCarthy JE. Application of renyi entropy for ultrasonic molecular imaging. J Acoust Soc Am. 2009 May;125(5):3141–3145. doi: 10.1121/1.3097489. [DOI] [PMC free article] [PubMed] [Google Scholar]
- 13.Hughes MS, McCarthy JE, Wickerhauser MV, Marsh JN, Arbeit JM, Fuhrhop RW, Wallace KD, Thomas T, Smith J, Agyem K, Lanza GM, Wickline SA. Real-time calculation of a limiting form of the renyi entropy applied to detection of subtle changes in scattering architecture. J Acoust Soc Am. 2009 Nov;126(5):2350–2358. doi: 10.1121/1.3224714. [DOI] [PMC free article] [PubMed] [Google Scholar]
- 14.Wheeden RL, Zygmund A. Measure and Integral: An Introduction to Real Analysis. New York: Marcel-Dekker; 1977. [Google Scholar]
- 15.Press WH, Teukolsky SA, Vetterling WT, Flannery BP. Numerical Recipes in C. 2. Cambridge: Cambridge University Press; 1992. [Google Scholar]
- 16.Sackett DL. Why randomized controlled trials fail but needn’t: 2. failure to employ physiological statistics, or the only formula a clinician-trialist is ever likely to need (or understand!) Can Med Assoc J. 2001 Oct;165(9):1226–1237. [PMC free article] [PubMed] [Google Scholar]


