Abstract
The lymphatic system is an extensive vascular network featuring valves and contractile walls that pump interstitial fluid and plasma proteins back to the main circulation. Immune function also relies on the lymphatic system’s ability to transport white blood cells. Failure to drain and pump this excess fluid results in edema characterized by fluid retention and swelling of limbs. It is, therefore, important to understand the mechanisms of fluid transport and pumping of lymphatic vessels. Unfortunately, there are very few studies in this area, most of which assume Poiseuille flow conditions. In vivo observations reveal that these vessels contract strongly, with diameter changes of the order of magnitude of the diameter itself over a cycle that lasts typically 2–3 seconds. The radial velocity of the contracting vessel is on the order of the axial fluid velocity, suggesting that modeling flow in these vessels with a Poiseuille model is inappropriate. In this paper, we describe a model of a radially expanding and contracting lymphatic vessel and investigate the validity of assuming Poiseuille flow to estimate wall shear stress, which is presumably important for lymphatic endothelial cell mechanotransduction. Three different wall motions; periodic sinusoidal, skewed sinusoidal and physiologic wall motions, were investigated with steady and unsteady parabolic inlet velocities. Despite high radial velocities resulting from the wall motion, wall shear stress values were within 4% of quasi-static Poiseuille values. Therefore, Poiseuille flow is valid for the estimation of wall shear stress for the majority of the lymphangion contractile cycle.
Keywords: computational fluid dynamics, lymph flow, contractility, shear stress, Poiseuille
1. Introduction
The lymphatic system is an extensive vascular network collecting fluid from the interstitial spaces and transporting it back to the venous circulation. Together with the presence of valves and contractile walls, fluid is pumped from essentially zero pressure tissue beds throughout the body back to the subclavian veins in the shoulder region. In addition to the transport of fluid, the lymphatic system is crucial for protein balance and immune function. The dysfunction of a lymphatic vessel can lead to a number of pathologies. Lymphedema, for example, is characterized by fluid retention usually caused by the removal of nodes or vessels during surgery or damage to the vessel and results in swelling, pain, incapacity and reduced immunity (Rockson, 2006; Stanton et al., 2009). Edema has become a greater concern with the prevalence of breast cancer; up to 75% of women develop arm lymphedema within 2 years, and 90% within 3 years of breast cancer surgery and therapy (Rockson, 2006; Stanton et al., 2009). There is no cure for lymphedema, in part because knowledge of the system’s pumping characteristics is lacking.
Lymph transport has been shown to rely on two pumping mechanisms, namely the intrinsic and extrinsic pump to transport fluid. The intrinsic pump refers to the vessel’s ability to contract phasically due to the presence of smooth muscle cells in its wall, whereas the extrinsic pump is the compression of the lymphatic vessel by adjacent tissue forces and tonic constrictions. Unlike arterioles, whose smooth muscle cells contract or relax very slowly to control local blood flow, lymphatic vessels undergo large, swift contractions. Dixon et al. (2006) reported up to 39% reduction in diameter during contractions with a typical period of 2–3 seconds, resulting in contraction velocities of 0.04 mm/s, on average, in rat mesenteric lymphatic vessels. In addition to measuring vessel diameter and contraction frequencies, Dixon et al. (2006) estimated lymphocyte velocity and wall shear stress. Lymphocyte velocities ranged from −3 to 10 mm/s with average velocities of 5 mm/s. This corresponded to an average wall shear stress of 0.64 dynes/cm2 (range = 0–12 dynes/cm2). Flow remained in the laminar regime with Reynolds number less than 5. It was further noted that velocity and wall shear stress values were out of phase compared to the diameter tracings; suggesting that contractions were shear-regulated.
Obtaining reliable wall shear stress values requires accurate estimation of wall shear rate, which is difficult to measure due to the small size of lymphatic vessels, wall motion and slow lymph velocities. This implies the use of fluid flow modeling that can be used to estimate wall shear stress from measurements of quantities such as pressure drop, flow rate and/or diameter. Only a few have attempted to model lymphatic vessel behavior. Reddy et al. (1975) were the first to develop a model for the lymphatic system. Their model assumed 1-D laminar flow through a succession of 35 lymphangions representing the thoracic duct, connected by valves, which were modeled by a fixed resistance to flow. Volumetric flow rate (Q), pressure (p) and radius (r) of the vessel were the variables of interest and shear stress (τ) was calculated assuming Poiseuille flow. Among their findings were weak dependences of overall flow rate on the filling and contraction flow rates, individually. Meanwhile, others have taken a different approach to modeling lymph flow. Recent work by Quick et al. (2007) use a circuit-theory analog of the system to provide important insights on the propagation of contractions. Quick et al. (2007) and Venugopal et al. (2009) show that lymphangion contractile coordination minimally affects lymph flow. Similarly, Macdonald et al. (2008) refined the Reddy model by incorporating compliant walls and increasing the number of computational nodes to investigate wave propagations of the contractions in a single lymphangion. Lymphangions were found to pump most efficiently when all sections of the wall contracted simultaneously, and there were minimal differences between forward and reverse propagating contractile waves. At a larger scale, Bertram et al. (2010) showed that sequential contractions in a short series chain of 5 lymphangions were more efficient than synchronized ones.
While these models provide a first-order approximation of lymphatic pumping and flow patterns, a major concern is the assumption of Poiseuille flow (i.e. steady flow in a straight, rigid tube). The work by Dixon et al. (2006) clearly shows that lymphatic vessels are highly dynamic and wall motion is significant; reporting values for the ratio of radial to axial velocities greater than 1. This behavior is usually seen during periods of flow reversal or rapid dilation, when axial velocities are low and radial velocities are high. Given this dynamic behavior, using Poiseuille flow, which assumes rigidity, may not be always accurate. In particular, the high ratio of radial to axial velocity means that terms that are eliminated in the derivation of Poiseuille flow (e.g., convective acceleration) may in fact be significant (Dixon et al., 2006).
Our general goal is to construct physiologically relevant models of lymphatic pumping that include wall shear stress mediated cellular actions. This study specifically addresses the validity of assuming Poiseuille flow as an appropriate model for estimating wall shear stress from flow rate and diameter data. We generate a 3-D computational model of a radially expanding and contracting lymphangion and analyze lymph shear stress and flux relations in simple dynamic geometries throughout a contractile cycle.
2. Materials and Methods
2.1 Construction of Flow Model
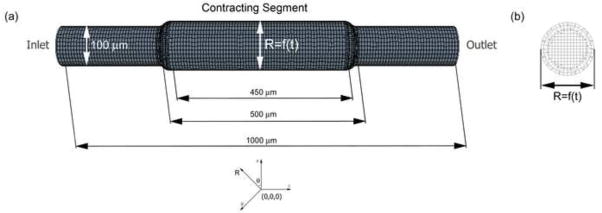
The lymphangion model was constructed as a straight cylindrical tube with a contracting segment flanked by static inlet and outlet sections using Solidworks (SP3 2009). A smooth spline curve was added between the contracting segment and the upstream and downstream sections. These transition regions were 5 times the mean radius of the tube in length to ensure negligible effects on the flow in the region of interest (taken to be the center plane of the contracting segment, as illustrated Figure 1b). Nominal dimensions of the lymphangion model are illustrated in Figure 1. It should be noted that we assumed a constant radius around the circumference of the cylinder. The lymphangion geometry was imported into StarCCM+ (v4.02.011, CD-Adapco) and the surface remesher tool was used to generate a hexahedral mesh. The trimmer cell mesher was then implemented to generate the volume mesh due to its robustness in producing a high quality grid for the contracting segment. Specifically, the trimmer mesh is a trimmed hexahedral cell shape based core mesh, which allows for more movement than the traditional hexahedral and polyhedral meshes. The computational mesh was refined to achieve wall shear stress convergence; it was refined until the change in shear stress was less than 2%, resulting in 10 μm cells with a 15 μm prism layer thickness and 2531 cells in the contracting segment (Figure 1).
Figure 1.
(a) Illustration of radially expanding and contracting lymphangion model. The contracting segment has a prescribed motion such that the radius varies with time. The radius of this region varied from 40–120 μm for our simulations. (b) Cross-sectional view of the center of the contracting segment. A trimmed hexahedral mesh was used to accommodate the wall motion, with cell sizes of 10μm and prism layer thickness of 15 μm.
2.2 Initial and Boundary Conditions
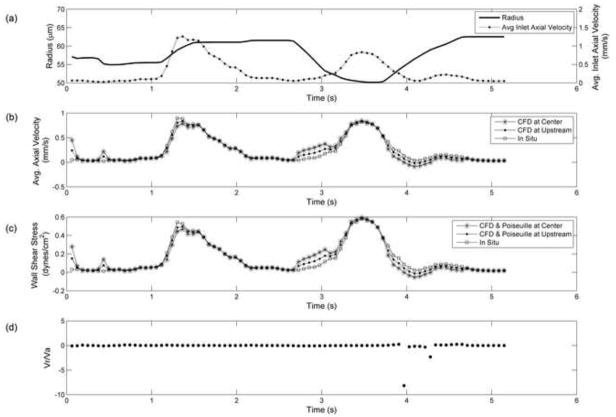
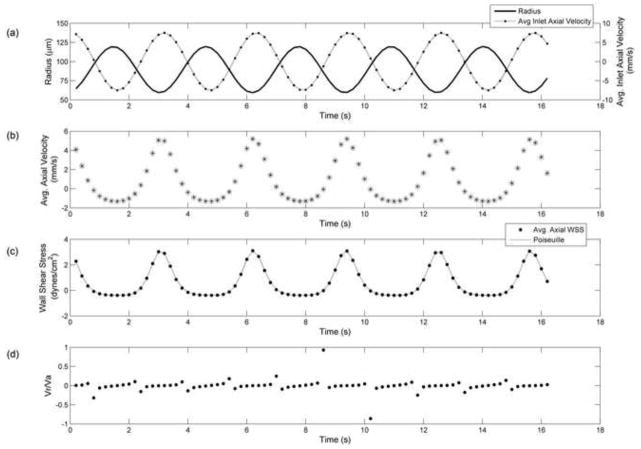
Flow was assumed to be laminar and lymph was assumed to be an incompressible single component Newtonian fluid with a density of 0.997 g/cm3 and dynamic viscosity of 0.9 cP. Three types of prescribed wall motions were applied to the central moving segment; periodic sinusoidal functions, skewed sinusoidal functions and physiological wall motion from in situ experiments. A parabolic velocity profile was defined at the inlet (both steady and time-varying) and a static pressure condition at the outlet. The inlet velocity for the physiologic case (Figure 5a) was estimated using conservation of mass and the in situ data for axial velocity. Specifically, the velocity waveform from the in situ experiment, which was taken at an unknown axial position relative to the inlet to the lymphangion, was used to determine the appropriate inlet condition by adding the mass gain/loss from the expansion/contraction of the tube segment between the inlet and the mid-point of the contracting segment of the computational fluid dynamics (CFD) model. Note that the wall motion was imposed as a boundary condition, i.e., no fluid-solid interaction (FSI) modeling was performed. A total of 15 simulations were performed investigating various inlet velocity and wall motion combinations. Reynolds (Re) and Womersley (α) numbers were very low for all simulations (Re<1, α<0.15).
Figure 5.
Results from physiological wall motion and inlet velocities obtained from in situ experiments. a) Vessel radius (line) and inlet axial velocity (dotted line) values (0.028 < vinlet < 1.28 mm/s) applied as boundary conditions, b) Average axial velocity in contracting segment at the center (asterisks) and upstream locations (dots) compared to in situ velocity (square) values, c) Average axial wall shear stress values from CFD model at the center (asterisks) and upstream (dot) locations, corresponding quasi-static Poiseuille (line) values, and wall shear stress estimated from in situ data (squares) d) Radial to axial velocity ratio. The CFD result deviates from in situ result at times of rapid contraction or expansion. These deviations are due to our estimate of inlet velocity. It appears that the in situ data was taken at a location further upstream of the contracting segment (i.e. closer to the inlet).
2.3 Simulations
We used a commercial CFD package (StarCCM+ 4.02.011, CD-Adapco) to run all simulations. This finite volume software employs an arbitrary Lagrangian-Eulerian formulation to allow for mesh movement (morpher solver) and a 2nd order segregated implicit flow model for the fluid. Specifically, an AMG SIMPLE solver with an under-relaxation factor of 0.7 and 0.3 was used to calculate velocity and pressure, respectively. The variables of interest were fluid velocity and wall shear stress. Due to the axisymmetric nature of our geometry, wall shear stress was averaged around the circumference of the center plane of the contracting segment (i.e. 500 μm from inlet). All simulations were run for 16.2 seconds, corresponding to 5 contraction cycles. All initial and transient flow effects were minimal by the 3rd cycle and therefore data was processed from the 4th cycle (i.e. 10–13.2 seconds). Wall shear stress (τw) was calculated for every cell using the equations below:
| (Equation 1) |
| (Equation 2) |
where a is the axial face area vector, v is the velocity vector, μ is the dynamic viscosity and T is the stress tensor. The corresponding Poiseuille value for wall shear stress was calculated using the following equation:
| (Equation 3) |
where v is the spatially averaged axial velocity at a given axial location and r is the vessel radius. It should be noted that the shear stress at the transient regions between the inlet and moving boundary are strongly affected by the boundary conditions and therefore not relevant. Thus, we focused on the center plane of the contracting segment and evaluated the axial component of wall shear stress due to the primarily axial nature of the flow. The lymphangion model was tested over a range of 0–60 μm change in radii. The static case (i.e. when ∂r/∂t=0) was used to ensure that Poiseuille values matched the calculated shear stress values from the CFD model.
3. Results
3.1 Periodic Sinusoidal Wall Motion with Steady Inlet
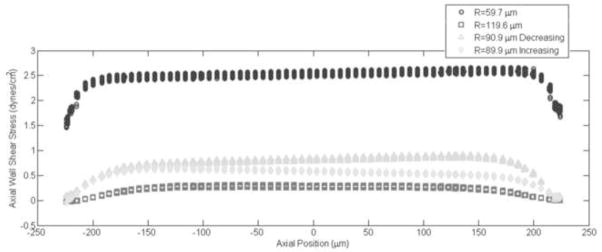
When the inlet flow was steady, the shear stresses calculated in the sinusoidally expanding tubes were within 1% of the quasi-static Poiseuille values (Table 1a). The ratios of radial to axial velocities (Vr/Va) in the high inlet velocity simulations were fairly low (0.0036 < Vr/Va < 0.0454), so we investigated the smallest and largest radially changing (ΔR=20, 60, respectively) simulations at a lower steady inlet velocity to increase the Vr/Va ratio (Table 1b). Despite the order of magnitude increase in Vr/Va ratio (0.0159 < Vr/Va < 0.540), wall shear stress values from the dynamic simulations remained within 1% of the quasi-static Poiseuille estimation. The distribution of wall shear stress along the axial length of the contracting segment exhibited slight monotonic variations. These increases or decreases in wall shear stress are illustrated in Figure 2 for the ΔR=60 case at four time points: the minimum (R=60μm), maximum (R=120μm) and average vessel diameters (R=90μm), both when the vessel was contracting and expanding. The monotonic variations amounted to at most 5% in this case.
Table 1a.
Results from simulations with periodic sinusoidal wall motion (T=3.2 s) and a steady inlet condition (Average axial velocity at inlet = 5.91 mm/s). The table compares wall shear stress values to the quasi-static Poiseuille values for shear and presents the average and maximum percent difference.
| Radius Range (μm) | Axizl Wall Shear Stress (dynes/cm2) | Poiseuille Shear Stress (dynes/cm2) | Max. |Vr/Va| Ratio | Avg. % Diff WSS | Max. % Diff WSS |
|---|---|---|---|---|---|
| 40 < R < 60 | 2.37 < τw < 8.06 | 2.38 < τpoiseuille < 8.08 | 0.0036 | 0.4% | 0.5% |
| 60 < R < 70 | 1.52 < τw < 2.44 | 1.53 < τpoiseuille < 2.45 | 0.0027 | 0.5% | 0.5% |
| 60 < R < 80 | 1.01 < τw < 2.46 | 1.02 < τpoiseuille < 2.47 | 0.0067 | 0.5% | 0.6% |
| 60 < R < 100 | 0.50 < τw < 2.50 | 0.51 < τpoiseuille < 2.51 | 0.0204 | 0.6% | 1.1% |
| 60 < R < 120 | 0.28 < τw < 2.54 | 0.28 < τpoiseuille < 2.55 | 0.0454 | 0.8% | 2.7% |
Table 1b.
Results from simulations with periodic sinusoidal wall motion (T=3.2 s) and a steady inlet condition (Average axial velocity at inlet = 1.48 mm/s). The table compares wall shear stress values to the quasi-static Poiseuille values for shear and presents the average and maximum percent difference.
| Radius Range (μm) | Axizl Wall Shear Stress (dynes/cm2) | Poiseuille Shear Stress (dynes/cm2) | Max. |Vr/Va| Ratio | Avg. % Diff WSS | Max. % Diff WSS |
|---|---|---|---|---|---|
| 40 < R < 60 | 0.57 < τw < 2.08 | 0.57 < τpoiseuille < 2.08 | 0.0159 | 0.4% | 0.4% |
| 60 < R < 120 | 0.03 < τw < 0.71 | 0.03 < τpoiseuille < 0.71 | 0.5450 | 0.6% | 1.5% |
Figure 2.
Distribution of axial wall shear versus axial position of the contracting segment. Results are shown for instantaneous wall shear stress values at the minimum (60 μm), maximum (120μm) and average vessel radius (90 μm) for the periodic sinusoidal wall motion with a steady inlet case (the last case presented in Table 1a). Note that both time points the vessel is at its average size of 90 μm are plotted (i.e. as the vessel contracts “decreasing” and as the vessel dilates, “increasing”). The slight changes in wall shear stress along the axial length of the contracting segment are due to the monotonic changes in velocity, which thereby affect our wall shear stress calculation.
3.2. Skewed Sinusoidal Wall Motion with Steady Inlet
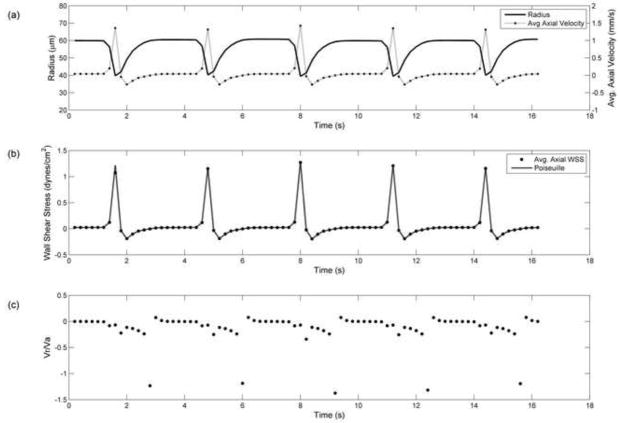
The skewed wall motion was constructed to emulate a rapid contraction followed by gradual diastolic filling of the vessel (Figure 3a). We evaluated this wall motion, with radius range of 40–60μm, at three steady parabolic inlet velocities (v = 5.91, 1.48 and 0.0591 mm/s). Axial velocity and wall shear stress values were much higher than the corresponding periodic wall motion case; suggesting that the increase in rate of contraction affects the maximum velocity. Furthermore the rate of dilation followed by the contraction caused backflow, as commonly observed in vivo (Dixon et al., 2006; Zawieja et al. 2009). Despite the changes seen in velocity, wall shear stress values were still accurately estimated by Poiseuille (within 1%). The skewed wall motion simulation with the slowest inlet velocity (v = 0.0591 mm/s, Figure 3a) exhibited the highest Vr/Va ratio of 1.3, but this did not affect the accuracy of the Poiseuille estimate (Figure 2b). Wall shear stress along the axis of the contracting segment varied only during the transient period of contraction, amounting to at most a 15% monotonic increase for the slowest inlet velocity case (v = 0.0591 mm/s).
Figure 3.
Results from skewed sinusoidal wall motion (T=3.2 s) with a steady parabolic inlet velocity (Average axial velocity at inlet = 0.0591 mm/s) a) Vessel radius (line) and axial velocity values (dotted line) at the center of the contracting segment, b) Average axial wall shear stress (dot) and quasi-static Poiseuille (dotted line) values, c) Radial to axial velocity ratio. Highest ratio observed during vessel dilation after rapid contraction.
3.3. Periodic Sinusoidal Wall Motion with Unsteady Inlet
An unsteady parabolic velocity profile was applied at the inlet of the lymphangion model such that the minimum inlet velocity would coincide with the maximum diameter and vice versa. Three different unsteady inlet velocity amplitudes (±1.9, ±7.5, ±15 mm/s) were investigated and this allowed for negative axial velocities (i.e. backflow). Velocity and wall shear stress values for the ±7.5 mm/s unsteady inlet case were similar to the steady inlet condition (vinlet = 5.91 mm/s), as shown in Figure 4. However, the Vr/Va ratio was much higher in the unsteady case. Regardless, Poiseuille estimates for shear stress were still within 2% (Table 2a). The increase in wall shear stress along the axis of the contracting segment was <20%, achieving its maximum value during strongest vessel contraction.
Figure 4.
Results from periodic sinusoidal wall motion (T=3.2 s) with unsteady parabolic inlet velocity (−7.5 < vinlet < 7.5 mm/s) a) Vessel radius (line) and inlet axial velocity (dotted line) values used as boundary conditions, b) Resulting average axial velocity in contracting segment, c) Average axial wall shear stress (dot) and quasi-static Poiseuille (dotted line) values, d) Radial to axial velocity ratio.
Table 2.
Results from simulations with periodic sinusoidal wall motion (60 < R < 120) and skewed sinusoidal wall motion (40 < R < 60), both with the same time period (T=3.2 s) and unsteady inlet velocities. Differences between axial wall shear stress and Poiseuille were averaged over time for these unsteady cases
| Wall Motion | Inlet Velocity (mm/s) | Axizl Wall Shear Stress (dynes/cm2) | Poiseuille Shear Stress (dynes/cm2) | Max. |Vr/Va| Ratio | Avg. % Diff WSS | Max. % Diff WSS |
|---|---|---|---|---|---|---|
| Periodic 60 < R < 120 | −1.9 < vinlet < 1.9 | −0.12 < τw < 0.81 | −0.12 < τpoiseuille < 0.81 | 1.36 | 0.4% | 1.4% |
| Periodic 60 < R < 120 | −7.5 < vinlet < 7.5 | −0.38 < τw < 2.96 | −0.39 < τpoiseuille < 2.97 | 0.86 | 0.7% | 2.0% |
| Periodic 60 < R < 120 | −15 < vinlet < 15 | −0.80 < τw < 5.94 | −0.81 < τpoiseuille < 5.97 | 0.58 | 0.8% | 2.0% |
| Skewed 40 < R < 60 | −1.9 < Vinlet < 1.9 | −0.80 < τw < 3.34 | −0.80 < τpoiseuille < 3.35 | 0.095 | 0.2% | 0.5% |
3.4 Skewed Sinusoidal Wall Motion with Unsteady Inlet
Applying the lowest amplitude unsteady parabolic velocity profile (±1.9 mm/s) at the inlet with the skewed sinusoidal wall motion created more backflow (−1.34 < vaxial < 3.76 mm/s) and consequently larger values of shear (−0.80 < τw < 3.34 dynes/cm2) than the corresponding steady case. However, this did not affect the accuracy of the Poiseuille assumption (Table 2). In fact, the average percent difference between Poiseuille and CFD shear values was almost half of the corresponding steady inlet case (0.22% vs. 0.46%) as shown in Table 2. Similar to the periodic wall motion with unsteady inlet, wall shear stress values increased along the axis of the contracting segment by <20%.
3.5 Simulations with In Situ Diameter and Inlet Velocity Values
To investigate how well our radially expanding and contracting tube emulated physiological conditions, we used data from in situ experiments as boundary conditions for the CFD model. The inlet velocity and diameter waveform applied as boundary conditions are shown in Figure 5a. The resulting axial velocity calculated by the model was compared to the axial velocity measured in situ (Figure 5b). The general shape of the velocity waveform was reconstructed by the CFD model, but there remained some regions with larger discrepancies. These regions did not correlate to the times where the Vr/Va ratio was high (Figure 5d), but instead correlated to periods of rapid contraction/expansion (i.e. Vr was relatively high, but Va was not low). Note that contraction caused the CFD and Poiseuille estimates of wall shear stress to be too high, while expansion caused them to be too low. At other time points, the wall shear stress estimates were within 4% of the quasi-static Poiseuille values.
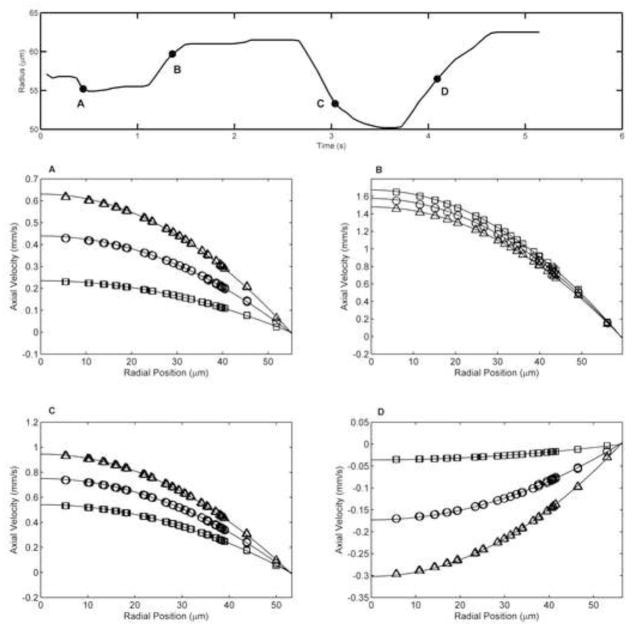
To verify if Poiseuille flow conditions persisted during the periods of significant wall motion (i.e. high radial velocities) we investigated the velocity profiles at four time points during the physiologic simulation (Figure 6); with positive and negative radial velocities (Vr =+10, +14 and −20 μm/s). Velocity profiles were evaluated at three axial locations from the contracting segment, namely the center, upstream and downstream planes. The upstream and downstream planes were located 125 μm from the center plane. The velocity profiles at all locations and time points were parabolic in nature and had quadratic curve fits with R2 > 0.99. This supports that Poiseuille flow conditions are maintained during the entire lymphangion contractile cycle.
Figure 6.
Velocity profiles for the physiologic case at four time points experiencing high wall motion. The radius plot for the physiologic case is shown with the 4 time points labeled A, B, C, and D. Velocity profiles where taken from the upstream (squares), center (circles) and downstream (triangles) planes in the contracting segment and fit with a quadratic curve (solid line). Upstream and downstream planes were 125 μm from the center plane. (A) time = 0.44 s, R = 55.2 μm, Vr = −20 μm/s (B) time = 1.36 s, R = 59.7 μm, Vr = +10 μm/s (C) time = 3.04 s, R = 53.3 μm, Vr = −20 μm/s (D) time = 4.09 s, R = 56.5 μm, Vr = +14 μm/s. All curve fits resulted in R2>0.99. This illustrates that the velocity profile remains parabolic throughout the simulation, even during periods of severe wall motion. Hence, the Poiseuille assumption remains valid along the axial length of the contracting segment.
4. Discussion
The investigation of flow patterns through natural and implanted conduits is commonly pursued because of the substantial evidence linking fluid dynamics to cellular response. Most previous models of lymph flow are one-dimensional and only provide information on flow and pressure through a lymphangion. This is the first 3D model of lymph flow that solves for velocity and wall shear stress throughout the contractile cycle. Our results strongly support the use of Poiseuille for wall shear stress calculations, since these estimations will be within 4% of the value calculated in a fully dynamically expanding tube under typical lymphatic flow conditions. Our results further show that the Vr/Va ratio, though high at times during the contractile cycle, does not invalidate the Poiseuille assumption. This is likely due to the low Reynolds numbers associated with lymphatic flow.
The simulations presented in this paper illustrate the differences between steady and unsteady inlet conditions and different types of wall motion. The CFD results closely matched Poiseuille values for velocity and wall shear stress for all simulations except the one with in situ boundary conditions. We believe that the discrepancies observed between the CFD result and in situ velocity values were due to the applied inlet velocity boundary condition. Given that we had to estimate the inlet velocity from the in situ data without knowing the actual lymphangion length may have caused some error. It can be difficult to determine the exact relative axial position or lymphangion length of the in situ measurements, as the field of view generally does not contain both valves. Upon closer investigation, it is evident that the results from the center plane do not correspond as precisely to the in vivo velocity and shear stress values during rapid dilation and contraction. Showing shear stress estimates from the center plane of the contracting segment facilitates the internal comparison to the Poiseuille estimation, but not necessarily to the in situ measurements. To verify this, we analyzed a region 125 μm upstream from the center of the lymphangion. The velocity and shear stress values at this upstream location were much closer to the in situ result, suggesting that the in situ experiment was taken at an axial location closer to the inlet of the lymphangion, as shown in Figure 5. Poiseuille values remained to be a good estimate for wall shear stress (<4% error) at this upstream location. Furthermore, the verification of parabolic velocity profiles at the upstream, center and downstream planes during periods of significant wall motion strongly suggests the presence of Poiseuille flow during the entire lymphangion contractile cycle (Figure 6). It is important to note that an error in diameter or flow rate measurements could lead to much greater errors in wall shear stress (>20%). The errors presented in this paper from the simulations are much smaller; hence, Poiseuille is a fair estimate for wall shear stress in non-valvular regions of the lymphangion.
The work by many investigators (Bohlen et al., 2009; Dixon et al., 2006; Quick et al., 2007; Zawieja et al., 2009), including us, has demonstrated that wall shear stress likely plays a large role in regulating lymphatic contractility through its actions on the endothelium. As seen by the simulations, wall shear stress values were highest when vessel diameter was at a minimum and lowest during vessel dilation. Although our wall motion was defined as a function of time only, future work could incorporate wall motions that are dependent on pressure, shear stress and time. Such simulations could provide better insights on how wall motion is linked to changes in shear stress and consequently nitric oxide production as illustrated by Bohlen et al. (2009).
It is important to note that our model has a few limitations. Lymph was modeled with the same viscosity and density as water, as is commonly assumed. While lymph may be slightly more viscous, our results would not change by much due to flow remaining in the strongly laminar regime (very low Reynolds and Womersley numbers) and not in the realm of transitional flow. Furthermore, our CFD model does not account for nonuniform contractions as they may occur in vivo. In terms of geometry, lymphatic vessels are predominantly straight and cylindrical with the exception of the valve areas. Therefore, our model is not appropriate for studying flow near lymphatic valves, nor did we include valves in our single lymphangion. We also neglected the potential effects of lymphocytes and other cells suspended in lymph. Inclusion of low volume fractions of suspended cells (typical of lymph) would not be expected to affect the conclusions of this study.
In summary, our results show that a simple radially expanding and contracting cylindrical tube can emulate lymphatic contractions and lymph flow rates observed experimentally and that Poiseuille flow provides a reasonable estimate for wall shear stress, within 4%.
Acknowledgments
We would like to acknowledge NIH for funding this study (Grant numbers R21 HL085659 and HL 094269) and the NSF graduate fellowship for funding E. Rahbar.
Footnotes
Conflict of interest statement
There are no conflicts of interests to state.
Publisher's Disclaimer: This is a PDF file of an unedited manuscript that has been accepted for publication. As a service to our customers we are providing this early version of the manuscript. The manuscript will undergo copyediting, typesetting, and review of the resulting proof before it is published in its final citable form. Please note that during the production process errors may be discovered which could affect the content, and all legal disclaimers that apply to the journal pertain.
References
- Bertram CD, Macaskill C, Moore JE. Simulation of a chain of collapsible contracting lymphangions with progressive valve closure. Journal of Biomechanical Engineering. 2010;133:011008. doi: 10.1115/1.4002799. [DOI] [PMC free article] [PubMed] [Google Scholar]
- Bohlen HG, Wang W, Gashev A, Gasheva O, Zawieja D. Phasic contractions of rat mesenteric lymphatics increase basal and phasic nitric oxide generation in vivo. American Journal of Physiology-Heart and Circulatory Physiology. 2009;297:H1319–28. doi: 10.1152/ajpheart.00039.2009. [DOI] [PMC free article] [PubMed] [Google Scholar]
- Dixon JB, Greiner ST, Gashev AA, Cote GL, Moore JE, Zawieja DC. Lymph flow, shear stress, and lymphocyte velocity in rat mesenteric prenodal lymphatics. Microcirculation. 2006;13:597–610. doi: 10.1080/10739680600893909. [DOI] [PubMed] [Google Scholar]
- Macdonald AJ, Arkill KP, Tabor GR, McHale NG, Winlove CP. Modeling flow in collecting lymphatic vessels: one-dimensional flow through a series of contractile elements. American Journal of Physiology-Heart and Circulatory Physiology. 2008;295:H305–13. doi: 10.1152/ajpheart.00004.2008. [DOI] [PubMed] [Google Scholar]
- Quick CM, Venugopal AM, Gashev AA, Zawieja DC, Stewart RH. Intrinsic pump-conduit behavior of lymphangions. American Journal of Physiology-Regulatory, Integrative and Comparative Physiology. 2007;292:R1510–8. doi: 10.1152/ajpregu.00258.2006. [DOI] [PubMed] [Google Scholar]
- Quick CM, Ngo BL, Venugopal AM, Stewart RH. Lymphatic pump-conduit duality: contraction of postnodal lymphatic vessels inhibits passive flow. American Journal of Physiology-Heart and Circulatory Physiology. 2009;296:H662–H668. doi: 10.1152/ajpheart.00322.2008. [DOI] [PMC free article] [PubMed] [Google Scholar]
- Reddy N, Krouskop T, Newell P. Biomechanics of a lymphatic vessel. Blood Vessels. 1975;12:261–278. doi: 10.1159/000158062. [DOI] [PubMed] [Google Scholar]
- Reddy NP, Krouskop TA, Newell PH., Jr A Computer Model of the Lymphatic System. Computers in Biology and Medicine. 1977;7:181–197. doi: 10.1016/0010-4825(77)90023-3. [DOI] [PubMed] [Google Scholar]
- Rockson SG. Addressing the unmet needs in lymphedema risk management. Lymphatic Research and Biology. 2006;4:42–6. doi: 10.1089/lrb.2006.4.42. [DOI] [PubMed] [Google Scholar]
- Stanton AWB, Modi S, Mellor RH, Levick JR, Mortimer PS. Recent advances in breast cancer-related lymphedema of the arm: lymphatic pump failure and predisposing factors. Lymphatic Research and Biology. 2009;7:29–45. doi: 10.1089/lrb.2008.1026. [DOI] [PubMed] [Google Scholar]
- Venugopal AM, Stewart RH, Laine GA, Dongaonkar RM, Quick CM. Lymphangion coordination minimally affects mean flow in lymphatic vessels. American Journal of Physiology-Heart and Circulatory Physiology. 2007;293:H1183–9. doi: 10.1152/ajpheart.01340.2006. [DOI] [PubMed] [Google Scholar]
- Zawieja DC. Contractile physiology of lymphatics. Proceedings of a Mini-Symposium: Lymphedema: An Overview of the Biology, Diagnosis, and Treatment of the Disease. Lymphatic Research and Biology. 2009;7:87–96. doi: 10.1089/lrb.2009.0007. [DOI] [PMC free article] [PubMed] [Google Scholar]


