

Abstract
Purpose
Changes in tumor metabolism from PET in locally advanced breast cancer (LABC) patients treated with neoadjuvant chemotherapy (NC) are predictive of pathologic response. Serial dynamic [18F]-FDG PET scans were used to compare kinetic parameters to the standardized uptake value (SUV) as predictors of pathologic response, disease-free survival (DFS) and overall survival (OS).
Experimental Design
Seventy-five LABC patients underwent FDG PET prior to and at midpoint of NC. FDG delivery (K1), FDG flux (Ki), and SUV measures were calculated and compared by clinical and pathological tumor characteristics using regression methods and area under the receiver operating characteristic curve (AUC). Associations between K1, Ki, and SUV and DFS and OS were evaluated using the Cox proportional hazards model.
Results
Tumors that were hormone receptor negative, high grade, highly proliferative, or of ductal histology had higher FDG Ki and SUV values; on average, FDG K1 did not differ systematically by tumor features. Predicting pathologic response in conjunction with estrogen receptor (ER) and axillary lymph node positivity, kinetic measures (AUC = 0.97) were more robust predictors compared to SUV (AUC = 0.84, P = 0.005). Changes in K1 and Ki predicted both DFS and OS, while changes in SUV predicted OS only. In multivariate modeling, only changes in K1 remained an independent prognosticator of DFS and OS.
Conclusion
Kinetic measures of FDG PET for LABC patients treated with NC accurately measured treatment response and predicted outcome compared to static SUV measures, suggesting kinetic analysis may hold advantage of static uptake measures for response assessment.
Keywords: PET, FDG kinetics, SUV, breast cancer, neoadjuvant
INTRODUCTION
An advantage of positron emission tomography (PET) over other conventional oncologic imaging is the ability to quantify functional tumor biology. The most commonly used radiotracer in PET, [18F]-fluorodeoxyglucose (FDG), targets tumor cells that exhibit increased glucose metabolism. The standardized uptake value (SUV) is the most commonly used measure of FDG tumor metabolism in clinical practice. The SUV is obtained semi-quantitatively from a single (static) scan, conducted 60 minutes post-injection. Dynamic PET imaging over 60 minutes of tracer uptake allows use of a 2-compartment model to derive multiple quantitative parameters, such as glucose metabolic rate estimated from FDG (MRFDG), glucose blood-to-tissue delivery (FDG K1), and FDG flux constant (FDG Ki) (1, 2).
One clinical oncologic indication for FDG PET in breast cancer is evaluation of treatment response among high-risk patient populations such as those with locally advanced breast cancer (LABC), defined as any breast cancer that is greater than 5 cm in diameter, or invades the chest wall or skin, or has fixed lymph node metastases or is inflammatory (3–7). The standard of care for LABC patients is neoadjuvant (preoperative) chemotherapy with the goal of delivering early systemic therapy to micrometastases, improving tumor resectability, and assessing in vivo tumor response to systemic therapy agents (8). Patients that achieve a pathologic complete response (pCR) to neoadjuvant treatment have improved survival compared to patients achieving a less than pCR (9–11). Prior reports from our institution showed that changes in blood flow from [15O]-water PET, and changes in MRFDG and FDG K1, from FDG PET scans before the initiation of chemotherapy and at therapy midpoint, were associated with pathologic tumor response among LABC patients. Patients that achieved a pCR had, on average, a greater decrease in blood flow, MRFDG, and FDG K1 from baseline to mid-therapy exams (12, 13). Additionally, higher recurrence or mortality risks have been associated with patients whose tumors had limited or no decline in blood flow or FDG K1 over the course of therapy (13).
We present here a follow-up analysis investigating static SUV values versus kinetic measures (FDG K1 and FDG Ki) from serial FDG PET scans in breast cancer patients undergoing chemotherapy, comparing pre-therapy measures to tumor phenotypic features and changes in measures to pathologic response, relapse, and survival. This study differs from prior reports because it includes a larger patient population size, extended follow-up time, and has the primary focus of comparing FDG kinetic parameters versus static SUV measures as predictors of breast cancer phenotype and response to chemotherapy. The hypothesis tested was that the FDG kinetic measures would be more predictive than SUV as early indicators of pathologic response, disease-free survival (DFS) and overall survival (OS). Support for the hypothesis is based on earlier reports that have shown that kinetic analysis may be better suited to measuring treatment response, especially for patients with low pre-therapy FDG uptake (4, 14, 15).
MATERIALS AND METHODS
Patient Selection
Patients who presented to the University of Washington Breast Cancer Specialty Center with histologically confirmed breast carcinoma scheduled to undergo neoadjuvant chemotherapy were eligible for the study. Patients were imaged as part of an ongoing prospective trial evaluating PET and LABC with an enrollment period from November 1995 to October 2007. Exclusion criteria included pregnancy, non-surgical candidates, and patients unwilling, or unable to undergo PET exams. Imaging performed for the study was primarily observational, and other than staging information from pre-therapy PET scans, scan results were not intended to direct therapy. Prior enrollment periods yielded 53 patients with multiple PET scans who underwent surgery, and have been previously described (12, 13). An additional 47 patients were enrolled since that time in the ongoing study that has now concluded, 22 are included in the current retrospective analysis, yielding a total of 75 patients. Of patients not included in the analysis, 25 of 47 were excluded because they did not have a mid-therapy exam (n=16) or the baseline PET exam identified metastatic disease (n=9). The University of Washington Institutional Review Board approved the research protocol and written informed consent was obtained from all participants.
Positron Emission Tomography
PET radiotracer production, imaging methods, and data analysis have been previously described (12, 15–19). Briefly, images were acquired prior to and at the midpoint of neoadjuvant chemotherapy on an Advance tomograph (General Electric Medical Systems, Waukesha, WI) with a reconstructed spatial resolution of 10–12 mm (18). A dose range of 218–399 Mbq [18F]-FDG was infused over 2 min in a 7–10 mL volume. Dynamic images were acquired for 60 minutes after the start of infusion. Regions-of-interest (ROIs) were intended to measure “peak” uptake and were 1.5 cm diameter circles, drawn over the portion of the tumor with maximal uptake on summed images. Similar regions were drawn over the left ventricle to determine blood and tumor time-activity curves. [18F]-FDG kinetic parameter estimates were obtained utilizing model optimization software (Berkeley Madonna, Berkeley, CA) (17). Of these, FDG K1 (mL/min/g) and flux (Ki, mL/min/g) were the primary measures included in this analysis based upon their value in prior studies (13, 17). Average FDG uptake from 45 to 60 minutes for the same ROIs were used to calculate weight-based SUV values that were not corrected for plasma glucose using standard definitions as in prior studies (15).
Tumor Response Assessment
A pathologic CR was defined as the absence of invasive tumor by microscopic examination of the primary tumor post-surgical specimen. This response endpoint has been used in several prior studies of neoadjuvant treatment of LABC and has been shown to carry prognostic significance (20).
Statistical Analysis
Associations between tumor pathologic response and PET measures were evaluated using the Pearson’s chi-square test or Student t-test with unequal variances. Associations between prognostic factors and PET measures were evaluated using the Pearson’s correlation coefficient (continuous variables), Student t-test for unequal variances (binary variables), or one-way analysis of variance (ANOVA, categorical variables). Changes in PET measures were examined using a two-sample t-test, comparing the two most prevalent chemotherapy regimens. Classification of pathologic response using different PET measures was compared using receiver operating characteristic (ROC) methods on probability of pathologic response estimated by logistic regression (predicting response by clinical prognostic factors and dynamic or static PET measures) (21, 22).
Cox regression for survival analysis (23, 24) was used to calculate hazard ratios (HR) and 95% confidence intervals (CI), measuring the association between PET parameters and breast cancer relapse or mortality risk. Time-to-recurrence (local/distant) was computed from date of surgery after neoadjuvant chemotherapy to date of recurrence or date of death. Time-to-death was calculated from the date of diagnosis to the date of death, and times for women without recurrence or death were censored by date of last clinical follow-up or by May 4, 2009, whichever occurred first. Predictors with missing data were excluded casewise from Cox proportional hazards models. FDG K1, FDG Ki and SUV levels were log-transformed (base 2) so that a one-unit difference in the hazard ratios would be associated with a doubling of PET measures. After examining univariate models, multivariable Cox models were fitted for DFS and OS, holding constant clinical prognostic factors. The factors considered in the final models included tumor size, histologic subtype (ductal versus lobular), number of positive axillary lymph nodes (ALN), estrogen receptor, (ER), progesterone receptor, (PR), and pathologic response. The proportional hazards assumption was validated by inspection of log-log survival curves. Analyses were performed using Stata/SE for Macintosh, version 10.1 (StataCorp, College Station, Texas) and SAS version 9.2 (SAS Institute, Inc., Cary, NC).
RESULTS
Treatment and Response Characteristics
Greater than 75% of patients presented with T3-T4 tumors (average tumor size 5.2 cm; range, 1.1 to 14 cm) and ≥N1 nodal disease, reflecting common characteristics of LABC (Table 1). Only one patient had a tumor less than 1.5 cm, which was 1.1 cm by ultrasound and 2 cm by physical exam. Nine breast cancers were classified as inflammatory. Sixteen (21%) patients had histologically confirmed disease in the axillary lymph nodes prior to the start of therapy.
TABLE 1.
Subject Demographic and Clinical Characteristics
| Characteristics | N=75 | % |
|---|---|---|
| Age at diagnosis, years | ||
| 30–39 | 16 | 21 |
| 40–49 | 28 | 38 |
| 50–59 | 22 | 29 |
| 60+ | 9 | 12 |
| Race | ||
| Non-Hispanic White | 63 | 84 |
| African American | 7 | 9 |
| Asian/Pacific Islander | 5 | 7 |
| Histology | ||
| Ductal | 69 | 92 |
| Lobular | 6 | 8 |
| Clinical tumor classification | ||
| T1 | 2 | 3 |
| T2 | 16 | 21 |
| T3 | 43 | 57 |
| T4 | 14 | 19 |
| Clinical lymph node classification | ||
| N0 | 14 | 19 |
| N1 | 46 | 61 |
| N2 | 13 | 17 |
| N3 | 2 | 3 |
| Tumor size (cm) | ||
| 0–1.9 | 3 | 4 |
| 2–5 | 38 | 51 |
| >5 | 34 | 45 |
| ER* | ||
| positive | 41 | 55 |
| negative | 34 | 45 |
| PR† | ||
| positive | 34 | 45 |
| negative | 41 | 55 |
| HER-2/neu‡ | ||
| positive | 19 | 26 |
| negative | 55 | 74 |
| Ki-67 Proliferative Index§ | ||
| Other than High | 14 | 23 |
| High‖ | 48 | 77 |
| Menopausal status | ||
| Pre | 47 | 63 |
| Post | 28 | 37 |
estrogen receptor
progesterone receptor
oncogene, unknown, n=1
unknown, n=13 (17%)
>20%
The majority of patients (65/75, 87%) received weekly metronomic doxorubicin-based chemotherapy with daily oral cyclophosphamide and 27 of them followed it with weekly paclitaxel. The remaining patients received a variety of different regimens. The mean chemotherapy duration was 19 weeks (range 8 to 38 weeks). Post-neoadjuvant therapy was performed per institutional standards and was based largely upon post-therapy surgical findings in the breast and axilla. Adjuvant treatment typically involved additional systemic therapy and regional radiotherapy if nodal disease was present. The baseline PET scan was performed a mean of 9 days after the diagnostic biopsy (range 1 to 72). Dynamic PET scans were performed before patients started chemotherapy and at mid-therapy, with an average 11 weeks of therapy (range 6 to 27 weeks).
Surgical management was mastectomy (79%) or lumpectomy (21%), performed an average of 3.3 weeks following the last chemotherapy dose (range, 0.9 to 7.4 weeks) with the exception of 3 delays due to: patient request (9 weeks); plastic surgery coordination (10 weeks); and severe leukopenia (12 weeks).
Twenty-one (28%) patients achieved a primary tumor pCR to neoadjuvant chemotherapy and 54 (72%) achieved other than pCR. Patients less likely to achieve a pCR were those with positive ALN post-therapy (6/45 = 13% pCR, compared to 15/30 = 50% for negative ALN post-therapy, P = 0.001) and ER+ (5/41 = 12% versus 16/34 = 47% for ER-, P = 0.002) or PR+ tumors (3/34 = 9% versus 18/41 = 44% for PR-, P = 0.002). Other clinical prognostic markers were not associated with tumor pathologic response.
The DFS median follow-up time was 4.2 years (range 0.1 to 13.0 years) and the OS median follow-up time was 5.0 years (range 0.6 to 13.4 years). Eighteen (24%) patients relapsed, presenting with metastases to the lung (31%), liver (31%), brain (19%), bone (13%), and lymph nodes (6%). Thirteen patients (17%) died; 10 deaths were due to metastatic breast cancer, one was probable and two were unknown.
PET Measurements and Association with Tumor Phenotypic Features and Pathologic Response
Pre-therapy Ki and SUV PET measures were associated with tumor histologic markers (Table 2, Figure 1). Tumors that were of ductal origin, high grade, ER or PR negative, or highly proliferative had higher average FDG Ki and SUV. In contrast, baseline FDG K1 was not associated with clinical or pathologic markers.
Table 2.
Baseline FDG Delivery, Flux and SUV Measures versus Clinical and Pathologic Breast Tumor Features
| K1 (mL/min/g) |
Ki (mL/min/g) |
SUV |
|||||||
|---|---|---|---|---|---|---|---|---|---|
| Characteristic | mean | SD | P | mean | SD | P | mean | SD | P |
| Tumor histology | |||||||||
| ductal | 0.133 | 0.049 | 0.92 | 0.025 | 0.018 | <.0001 | 5.06 | 2.93 | <.0001 |
| lobular | 0.130 | 0.070 | 0.006 | 0.002 | 2.25 | 0.52 | |||
| Clinically positive nodes | |||||||||
| no | 0.123 | 0.050 | 0.40 | 0.025 | 0.021 | 0.67 | 5.14 | 3.31 | 0.70 |
| yes | 0.135 | 0.051 | 0.023 | 0.018 | 4.77 | 2.85 | |||
| Menopausal status | |||||||||
| Pre | 0.132 | 0.052 | 0.89 | 0.024 | 0.019 | 0.58 | 4.94 | 3.09 | 0.67 |
| Post | 0.134 | 0.050 | 0.022 | 0.017 | 4.65 | 2.64 | |||
| Tumor grade | |||||||||
| I | 0.153 | 0.070 | 0.54 | 0.008 | 0.005 | 0.003 | 2.62 | 0.81 | 0.006 |
| III | 0.131 | 0.050 | 0.018 | 0.013 | 3.96 | 2.32 | |||
| III | 0.131 | 0.050 | 0.029 | 0.020 | 5.67 | 3.12 | |||
| ER expression | |||||||||
| positive | 0.134 | 0.058 | 0.82 | 0.017 | 0.012 | 0.0008 | 3.82 | 2.21 | 0.001 |
| negative | 0.131 | 0.041 | 0.031 | 0.021 | 6.06 | 3.22 | |||
| PR expression | |||||||||
| positive | 0.131 | 0.058 | 0.77 | 0.016 | 0.011 | 0.0009 | 3.62 | 1.80 | 0.0004 |
| negative | 0.134 | 0.045 | 0.029 | 0.021 | 5.84 | 3.28 | |||
| HER-2/neu | |||||||||
| positive | 0.133 | 0.052 | 0.86 | 0.025 | 0.020 | 0.16 | 5.12 | 3.16 | 0.12 |
| negative | 0.135 | 0.051 | 0.019 | 0.013 | 4.11 | 2.01 | |||
| Ki-67 proliferative index | |||||||||
| Other than High | 0.142 | 0.060 | 0.46 | 0.012 | 0.009 | 0.0001 | 3.10 | 1.08 | 0.0002 |
| High | 0.129 | 0.050 | 0.026 | 0.019 | 5.16 | 2.94 | |||
Figure 1.


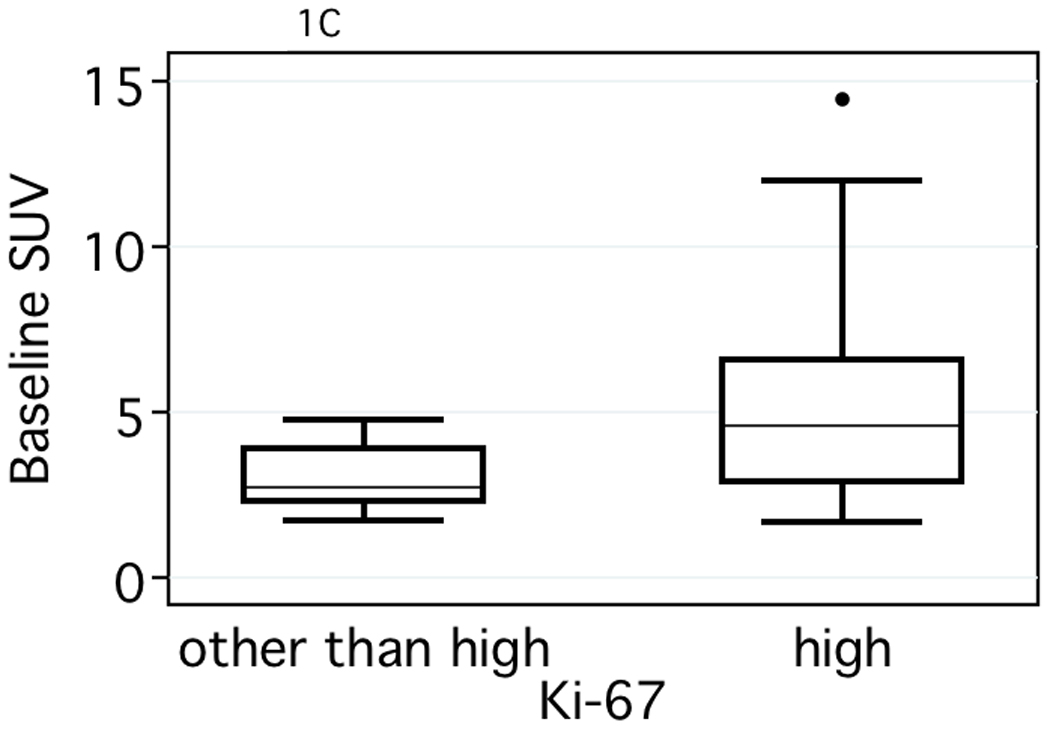
Comparison of baseline Ki and SUV values versus tumor pathologic markers. (A) estrogen receptor status (ER) (P = <.001 for both), (B) tumor grade, (P = .001, Ki and P = .002, SUV) and (C) tumor proliferation (P = .003, Ki and P = .001, SUV).
Baseline PET measures did not predict treatment response; however, changes in kinetic PET measures from baseline to mid-therapy were associated with tumor response. On average, pCR patients had a 76% and 84% decrease in FDG K1 and FDG Ki compared to 27% and 65%, respectively for other than pCR patients (P = <.0001 and P = 0.004). Changes in tumor uptake by SUV were similarly related to response (mean = 65% pCR versus 50% non-pCR, P = <.01). These changes were well beyond test/re-test precision based upon prior studies, including our prior analysis (17). Multivariable logistic regression models were used to predict pCR by PET measures, adjusting for ER and pre-therapy clinical axillary node positivity (additional clinical covariates resulted in overfitting). Predictions from a model including SUV had an area under the ROC curve (AUC) of 0.84 (95% CI, 0.74 – 0.95), while a model including kinetic measures (FDG K1, and FDG Ki) had an AUC of 0.97 (95% CI, 0.94 – 1.0). Using a nonparametric test comparing correlated ROC curves (with different markers predicting the same gold standard) (22), the model using kinetic PET measures (AUC = 0.97) was superior to the model using the SUV (AUC = 0.84, P = 0.005).
Our prior analysis has shown that the level of tracer uptake in tumors pre-therapy may affect the performance of SUV as a measure of change in FDG uptake with therapy (15). To this effect, we compared the percentage change in SUV to the change in Ki for patients divided by tertiles of pre-therapy uptake, similar to prior studies (15). For each group, we noted the maximum percentage change in SUV, recorded as the absolute value of the y-intercept at Ki equal to −100% for the linear fit of percentage change SUV versus percentage change Ki. For patients whose tumors were in the lowest tertile of uptake pre-therapy (pre-therapy SUV < 3), the maximum percentage change was 52%, compared to a maximum 81% change in SUV for patients whose tumors had higher pre-therapy FDG uptake (P = >0.0001). This suggests that for tumors with low pre-therapy uptake, SUV is relatively insensitive to change in FDG kinetics with treatment. We also compared the percent change in SUV, K1, and Ki for the different tertiles of pre-therapy FDG uptake (Figure 2). While there were no differences between tertiles in the mean change in K1 (Figure 2A) or Ki (Figure 2B), changes in SUV were strongly related to magnitude of pre-therapy uptake (Figure 2C). Average change in uptake with therapy was lower for patients whose tumors had the lowest pre-therapy SUV (−41% tertile 1 versus −55% tertile 2 versus −67% tertile 3; P = 0.001). This result indicates that SUV may underestimate the change in FDG uptake in response to therapy in patients with low pre-therapy uptake.
Figure 2.


Comparison of the percent change measures from pre-therapy to mid-therapy versus tertiles of pre-therapy measures for: (A) FDG delivery (K1, mL/min/g), (B) glycolytic flux (Ki, mL/min/g), and (C) standard uptake value (SUV).
PET Measures Association with Relapse and Survival
Pre-therapy PET measures did not predict the likelihood of patient relapse or mortality (Table 3, Univariate Analysis). Mid-therapy functional imaging parameters were associated with DFS and OS in univariate Cox analyses. Patients whose tumors exhibited persistent, elevated FDG Ki on the mid-therapy exam had a 1.37-fold increased risk of breast cancer recurrence and a 1.44 -fold increased mortality risk for each doubling of FDG Ki, respectively. Although the change in K1 and Ki were not necessarily correlated with each other, changes in both K1 and Ki from baseline to mid-therapy were associated with earlier relapse or poorer OS. Changes in SUV were associated with OS only.
Table 3.
Risk of breast cancer recurrence and mortality associated with PET uptake measures
| Disease-free survival |
||||||||
|---|---|---|---|---|---|---|---|---|
| Univariate Analysis |
Multivariate Adjusted Analysis* |
|||||||
| Characteristic | No. at Risk |
No. Recurrences |
HR | 95% Cl | P value† | HR | 95% Cl | P value† |
| Baseline K1‡ | 75 | 18 | 0.63 | 0.32–1.23 | 0.18 | 0.19 | 0.06–0.61 | 0.003 |
| Baseline Ki‡ | 75 | 18 | 1.07 | 0.70–1.63 | 0.76 | 1.13 | 0.61–2.10 | 0.70 |
| Baseline SUV§ | 75 | 18 | 0.91 | 0.49–1.70 | 0.77 | 0.92 | 0.41–2.07 | 0.84 |
| Mid-therapy K1‡ | 75 | 18 | 1.49 | 0.96–2.32 | 0.07 | 1.55 | 0.79–3.04 | 0.19 |
| Mid-therapy Ki‡ | 75 | 18 | 1.37 | 1.06–1.77 | 0.01 | 1.36 | 0.97–1.90 | 0.05 |
| Mid-therapy SUV§ | 75 | 18 | 1.52 | 0.91–2.54 | 0.14 | 1.45 | 0.72–2.91 | 0.31 |
| Change in K1‖ | 75 | 18 | 1.16 | 1.07–1.27 | 0.001 | 1.37 | 1.16–1.62 | <.0001 |
| Change in Ki‖ | 75 | 18 | 1.20 | 1.05–1.37 | 0.01 | 1.20 | 0.99–1.44 | 0.06 |
| Change in SUV‖ | 75 | 18 | 1.22 | 0.97–1.53 | 0.08 | 1.19 | 0.90–1.57 | 0.21 |
|
Overall survival |
||||||||
|
Univariate Analysis |
Multivariate Adjusted Analysis* |
|||||||
| Characteristic |
No. at Risk |
No. Recurrences |
HR | 95% Cl | P value† | HR | 95% Cl | P value† |
| Baseline K1‡ | 75 | 18 | 0.86 | 0.38–1.96 | 0.73 | 0.27 | 0.06–1.21 | 0.07 |
| Baseline Ki‡ | 75 | 18 | 1.13 | 0.68–1.87 | 0.64 | 1.31 | 0.59–2.91 | 0.50 |
| Baseline SUV§ | 75 | 18 | 1.11 | 0.55–2.23 | 0.78 | 1.30 | 0.49–3.49 | 0.50 |
| Mid-therapy K1‡ | 75 | 18 | 1.58 | 0.94–2.66 | 0.08 | 1.88 | 0.85–4.16 | 0.11 |
| Mid-therapy Ki‡ | 75 | 18 | 1.44 | 1.06–1.95 | 0.01 | 1.43 | 0.98–2.07 | 0.04 |
| Mid-therapy SUV§ | 75 | 18 | 1.96 | 1.14–3.34 | 0.03 | 1.88 | 0.87–4.06 | 0.12 |
| Change in K1‖ | 75 | 18 | 1.16 | 1.05–1.28 | 0.005 | 1.33 | 1.12–1.58 | 0.0003 |
| Change in Ki‖ | 75 | 18 | 1.26 | 1.08–1.47 | 0.006 | 1.21 | 0.98–1.49 | 0.07 |
| Change in SUV‖ | 75 | 18 | 1.38 | 1.04–1.84 | 0.02 | 1.27 | 0.91–1.78 | 0.16 |
HR=hazard ratio, CI=confidence interval
Multivariate adjusted HRs adjusted for ER, PR, tumor size (0–1.9, 2–5, >5 cm), histology (ductal/lobular), pCR (pCR vs other than pCR), and axillary lymph node positivity (0, 1–3, 4 or more)
likelihood ratio test
log base 2, mL/min/g × 10−3
log base 2
1 unit=10 percent change
In multivariable Cox modeling (Table 3, Multivariable Adjusted Analysis), the change in FDG K1 delivery was associated with elevated relapse among patients with smaller declines or interval increases in FDG K1 measured over the course of neoadjuvant treatment (HR 1.37, 95% CI, 1.16 – 1.62). For example, a 10 percentage point greater increase in FDG K1 delivery to the primary tumor from baseline to mid-therapy exams inferred a 37% higher recurrence risk to the patient. Greater mortality risks were also observed among patients with persistent or elevated FDG K1 from baseline to mid-therapy PET exams with a 33% greater risk of mortality for each 10% increase in FDG delivery (HR 1.33, 95% CI, 1.12 – 1.58). The elevated recurrence and mortality risks that were observed univariately for change in FDG Ki were of borderline significance in multivariate models (P = 0.06 and P = 0.07 for DFS and OS). SUV changes during treatment were not significant in multivariable models (P = 0.16 and P = 0.21).
DISCUSSION
Numerous studies have shown that FDG PET and PET/CT are valuable and accurate clinical tools for measuring response to chemotherapy in LABC (3–5, 25). Most studies reported to date, and most PET procedures performed in the clinic, use static uptake measures such as SUV to quantify the level of FDG uptake in tumors and to track treatment changes as a measure of response. Some studies have also used FDG kinetic measures to quantify tumor metabolism in LABC treated with chemotherapy (3, 4, 13, 15) and found kinetic measures to be highly predictive of pathologic response and/or patient survival. Prior analyses from smaller patient populations suggested that kinetic measures might offer an advantage in response evaluation and predictive capability (4, 13, 15). The goal of our analysis was to test kinetic versus static measures of FDG uptake as predictors of response and outcome in a larger cohort of LABC patients treated with neoadjuvant chemotherapy, for whom pathologic response, relapse, and mortality had been recorded. Our study posed two questions in comparing static uptake (SUV) to kinetic measures (delivery, K1, and flux, Ki): (1) Do delivery and flux have the same relationship to pre-therapy tumor phenotypic features compared to SUV? (2) Are changes in SUV with therapy similar to changes in delivery and flux in the ability to predict response and outcome? Similar to prior reports (26–30), we found pre-therapy FDG SUV correlated with pathologic tumor characteristics; there were higher SUV values for ductal versus lobular tumors, and for high grade, highly proliferative, or hormone receptor negative tumors. Nearly identical findings were observed for FDG Ki; however, no significant associations were found between FDG delivery (K1) and the phenotypic features tested. These results suggest that kinetic analysis does not add considerably to predicting tumor phenotype from FDG PET imaging, and consequently, that differences in performance as a response metric for static versus kinetic measures are not simply on the basis of association with tumor phenotype.
We did observe differences in the performance of SUV versus kinetic measures as predictors of patient response and outcome. Mid-therapy changes in FDG K1 and Ki were highly predictive of pathologic response and had strong associations with relapse and overall survival in univariate analysis. On the other hand, SUV had a weaker, though still significant, association with pathologic response and OS, but not with relapse. In multivariate analysis that included known clinical and pathologic prognostic factors for LABC, the kinetic measures provided significantly incremental predictive capability, while SUV did not. These results suggest that the use of kinetic analysis in serial FDG PET applied to breast cancer treatment response offers significant advantages over static uptake measures such as SUV.
Why should kinetic measures be more predictive than SUV for serial FDG PET scans over the course of therapy? Our results suggest two factors and the first factor relates to tumors with low pre-therapy FDG uptake. Prior reports have shown that SUV and other static measures have limited sensitivity for evaluating response in patients with low pre-therapy FDG uptake (4, 14, 15, 31). Tumors with lower metabolic rates have a relatively larger proportion of non-metabolized FDG in tissue that contributes to the SUV compared to tumors with higher uptake (32–34). Static measures cannot distinguish between non-phosphorylated FDG, which does not provide specific information on glucose metabolic rate, versus phosphorylated FDG (FDG-6P), which are FDG molecules that have committed to the glucose metabolism pathway. Kinetic analysis, on the other hand, can estimate the flux of FDG from the blood to FDG-6P, which is trapped within cells by phosphorylation during the commitment to the glucose metabolism pathway. As in our prior report (15), we found low baseline SUV values were associated with lower maximum detectable SUV percentage changes from pre-therapy to mid-therapy scans. Furthermore, although pre-therapy uptake was not associated with pathologic response, we did observe a clear trend for lower percent change in SUV with therapy for tumors that had low pre-therapy uptake compared to tumors with higher uptake. A correlation between pre-therapy uptake and change over the course of therapy was not observed for either K1 or Ki. Taken together, these findings suggest that for SUV, but not for kinetic parameters, performance as a response measure depends upon the level of tumor uptake pre-therapy.
A second factor underlying the advantage of kinetic measures over static measures is the ability of dynamic imaging to measure multiple aspects of FDG kinetics at the same time, such as glucose delivery or glycolytic flux. This is in distinction to simple static measures that only indirectly reflect FDG kinetics. We observed that patients with greater reductions in both FDG K1 and FDG Ki over the course of treatment were more likely to achieve a pCR and that changes in both K1 and Ki were strongly associated with DFS and OS. This was not true for changes in SUV. In multivariate analysis that included known predictive and prognostic clinical and pathologic features, we found that the change in FDG delivery (K1) to the tumor over the course of therapy added significantly to predicting relapse and mortality. This was not the case for changes in SUV. Patients with persistent or incremental increases in FDG K1 were more likely to relapse or experience mortality. For example, a patient that had a +20% change in FDG K1 from baseline to mid-therapy exam had a 1.37-fold greater recurrence risk or a 1.33-fold greater mortality risk compared to a patient that had +10% change. Even after adjusting for standard clinical or pathologic markers, the change in glucose delivery to breast tumors remained an independent predictor of patient outcome. The ability to quantify changes in both glucose delivery and metabolic flux potentially offers significant advantages. Glucose delivery appears to provide an indirect measure of tumor perfusion (17, 35–37) as observed by perfusion-based imaging studies like 15O-water PET and dynamic contrast-enhanced (DCE) MRI (12, 13, 38, 39) where perfusion measures were highly predictive in evaluating treatment response. Thus a second important advantage of kinetic analysis over static uptake measures is the ability to quantify multiple aspects of tumor biology, and their changes in response to therapy.
Static acquisition is the most common clinical FDG PET imaging protocol from which SUV measures can easily be determined. However, SUV appears to have some important limitations as a measure of response. In addition to the factors identified in our analysis, there may be other factors in clinical imaging SUV estimation that may further limit its utility. SUV values are dependent on the time interval between tracer injection and imaging. Variations in this interval could confound comparisons between baseline and mid-therapy exams in patients being scanned for therapy monitoring (40). Furthermore, the limited count statistic arising from a short static acquisition may have considerable statistical fluctuation. In our study, SUVs were highly optimized compared to standard clinical imaging; they were taken from fixed time intervals after injection (45–60 minutes), yielding high-count measures from a highly reproducible time interval. Even under these optimized conditions, kinetic analysis offered significant advantages over SUV.
Our results provide an impetus for clinically practical methods capable of estimating kinetic parameters from FDG PET studies. Some studies have suggested estimating tumor perfusion from a short dynamic image performed at the time of FDG injection (36). Dual time point imaging has also been tested and may provide additional data on FDG kinetics; (41, 42) however its values may be more limited in low uptake tumors where there is either a slight increase or minimal decrease in SUV over time (40). Further optimization of kinetic analysis measures may yield insights into practical alternatives that overcome the limitations of purely static measures and lead to the establishment of clinical scenarios where optimized kinetic analysis may be the most helpful, as in the case of low baseline tumor FDG uptake (15).
There are some important limitations to note for this study. The reported PET parameters measured only the most metabolically active portion of the tumor, as an indicator of the most aggressive behavior. LABC can be heterogeneous and analyzing heterogeneity of the entire tumor may further our understanding of it’s biologic processes (43). Second, changes in clinical practice for LABC patients at this institution led to extended neoadjuvant chemotherapy regimens over the duration of this study. However, the majority of patients did receive metronomic doxorubicin-based treatment and a comparison of the changes in PET parameters between the two prevalent neoadjuvant regimens showed no dependence on chemotherapy regimen (data not shown).
In conclusion, additional quantitative kinetic measures can be obtained from dynamic PET imaging compared to static SUV measures. While FDG flux (Ki) and SUV have similar correlation with tumor phenotypic features, the combination of measures of glucose delivery (K1) and Ki from kinetic analysis of dynamic FDG PET offer significant advantages over SUV for predicting response, relapse, and survival from serial FDG PET studies. Changes in FDG delivery (K1), and not SUV, during treatment predicted patient outcome, providing independent prognostic information that is distinct from pathology. These results provide an impetus for development of clinically practical approaches for obtaining FDG kinetic measures for tumor response evaluation.
ACKNOWLEDGMENTS
This work was supported by CA72064, CA42045, and U01-CA148131 from the National Institutes of Health. The authors thank the University of Washington radiochemists for isotope production and the physicists and technologist staff for technical assistance with imaging studies. The authors also acknowledge the physicians and staff of the Breast Cancer Specialty Center at the Seattle Cancer Care Alliance for assistance with patient referrals.
REFERENCES
- 1.Phelps ME, Huang SC, Hoffman EJ, Selin C, Sokoloff L, Kuhl DE. Tomographic measurement of local cerebral glucose metabolic rate in humans with (F-18)2-fluoro-2-deoxy-D-glucose: validation of method. Ann Neurol. 1979;6:371–388. doi: 10.1002/ana.410060502. [DOI] [PubMed] [Google Scholar]
- 2.Reivich M, Alavi A, Wolf A, et al. Glucose metabolic rate kinetic model parameter determination in humans: the lumped constant and rate constants for [18F]fluorodeoxyglucose and [11C]deoxyglucose. J Cereb Blood Flow Metabol. 1985;5:179–192. doi: 10.1038/jcbfm.1985.24. [DOI] [PubMed] [Google Scholar]
- 3.Wahl RL, Zasadny K, Helvie M, Hutchins GD, Weber B, Cody R. Metabolic monitoring of breast cancer chemohormonotherapy using positron emission tomography: initial evaluation. J Clin Oncol. 1993 Nov;11:2101–2111. doi: 10.1200/JCO.1993.11.11.2101. [DOI] [PubMed] [Google Scholar]
- 4.Krak NC, van der Hoeven JJ, Hoekstra OS, Twisk JW, van der Wall E, Lammertsma AA. Measuring [(18)F]FDG uptake in breast cancer during chemotherapy: comparison of analytical methods. Eur J Nucl Med Mol Imaging. 2003 May;30:674–681. doi: 10.1007/s00259-003-1127-z. [DOI] [PubMed] [Google Scholar]
- 5.Lee JH, Rosen EL, Mankoff DA. The role of radiotracer imaging in the diagnosis and management of patients with breast cancer: part 2--response to therapy, other indications, and future directions. J Nucl Med. 2009 May;50:738–748. doi: 10.2967/jnumed.108.061416. [DOI] [PubMed] [Google Scholar]
- 6.Hortobagyi GN, Ames FC, Buzdar AU, et al. Management of stage III primary breast cancer with primary chemotherapy, surgery, and radiation therapy. Cancer. 1988;62:2507–2516. doi: 10.1002/1097-0142(19881215)62:12<2507::aid-cncr2820621210>3.0.co;2-d. [DOI] [PubMed] [Google Scholar]
- 7.Beahrs OH. Staging of cancer. CA Cancer J Clin. 1991;41:121–125. doi: 10.3322/canjclin.41.2.121. [DOI] [PubMed] [Google Scholar]
- 8.Gralow JR, Burstein HJ, Wood W, et al. Preoperative therapy in invasive breast cancer: pathologic assessment and systemic therapy issues in operable disease. J Clin Oncol. 2008 Feb 10;26:814–819. doi: 10.1200/JCO.2007.15.3510. [DOI] [PubMed] [Google Scholar]
- 9.Feldman LD, Hortobagyi GN, Buzdar AU, Ames FC, Blumenschein GR. Pathological assessment of response to induction chemotherapy in breast cancer. Cancer Res. 1986;46:2578–2581. [PubMed] [Google Scholar]
- 10.Machiavelli MR, Romero AO, Perez JE, et al. Prognostic significance of pathological response of primary tumor and metastatic axillary lymph nodes after neoadjuvant chemotherapy for locally advanced breast carcinoma. Cancer J Sci Am. 1998;4:125–131. [PubMed] [Google Scholar]
- 11.Kuerer HM, Newman LA, Buzdar AU, et al. Residual metastatic axillary lymph nodes following neoadjuvant chemotherapy predict disease-free survival in patients with locally advanced breast cancer. Am J Surg. 1998 Dec;176:502–509. doi: 10.1016/s0002-9610(98)00253-0. [DOI] [PubMed] [Google Scholar]
- 12.Mankoff DA, Dunnwald LK, Gralow JR, et al. Changes in blood flow and metabolism in locally advanced breast cancer treated with neoadjuvant chemotherapy. J Nucl Med. 2003;44:1806–1814. [PubMed] [Google Scholar]
- 13.Dunnwald LK, Gralow JR, Ellis GK, et al. Tumor metabolism and blood flow changes by positron emission tomography: relation to survival in patients treated with neoadjuvant chemotherapy for locally advanced breast cancer. J Clin Oncol. 2008 Sep 20;26:4449–4457. doi: 10.1200/JCO.2007.15.4385. [DOI] [PMC free article] [PubMed] [Google Scholar]
- 14.Lammertsma AA, Hoekstra CJ, Giaccone G, Hoekstra OS. How should we analyse FDG PET studies for monitoring tumour response? Eur J Nucl Med Mol Imaging. 2006 Jul;33 Suppl 13:16–21. doi: 10.1007/s00259-006-0131-5. [DOI] [PubMed] [Google Scholar]
- 15.Doot RK, Dunnwald LK, Schubert EK, et al. Dynamic and Static Approaches to Quantifying 18F-FDG Uptake for Measuring Cancer Response to Therapy, Including the Effect of Granulocyte CSF. J Nucl Med. 2007 Jun;48:920–925. doi: 10.2967/jnumed.106.037382. [DOI] [PMC free article] [PubMed] [Google Scholar]
- 16.Mankoff DA, Dunnwald LK, Gralow JR, et al. Blood flow and metabolism in locally advanced breast cancer: relationship to response to therapy. J Nucl Med. 2002;43:500–509. [PubMed] [Google Scholar]
- 17.Tseng J, Dunnwald LK, Schubert EK, et al. 18F-FDG kinetics in locally advanced breast cancer: correlation with tumor blood flow and changes in response to neoadjuvant chemotherapy. J Nucl Med. 2004 Nov;45:1829–1837. [PubMed] [Google Scholar]
- 18.Lewellen TK, Kohlmyer S, Miyaoka R, Schubert S, Stearns C. Investigation of the count rate performance of the General Electric ADVANCE poistron emission tomograph. IEEE Trans Nucl Sci. 1995;42:1051–1057. [Google Scholar]
- 19.Hamacher K, Coenen HH, Stocklin G. Efficient stereospecific synthesis of no-carrier added 2-[18F]-fluoro-2-deoxy-D-glucose using aminopolyether supported nucleophilic substitution. J Nucl Med. 1986;27:235–238. [PubMed] [Google Scholar]
- 20.Fisher B, Bryant J, Wolmark N, et al. Effect of preoperative chemotherapy on the outcome of women with operable breast cancer. J Clin Oncol. 1998 Aug;16:2672–2685. doi: 10.1200/JCO.1998.16.8.2672. [DOI] [PubMed] [Google Scholar]
- 21.McIntosh MW, Pepe MS. Combining several screening tests: optimality of the risk score. Biometrics. 2002 Sep;58:657–664. doi: 10.1111/j.0006-341x.2002.00657.x. [DOI] [PubMed] [Google Scholar]
- 22.DeLong ER, DeLong DM, Clarke-Pearson DL. Comparing the areas under two or more correlated receiver operating characteristic curves: a nonparametric approach. Biometrics. 1988 Sep;44:837–845. [PubMed] [Google Scholar]
- 23.Cox DR. Regression models and life tables (with discussion) J R Stat Soc Ser B. 1972;34:187–220. [Google Scholar]
- 24.Kalbfleisch JD, Prentice RL. The Statistical Analysis of Failure Time Data. 2 ed. New York: John Wiley & Sons; 2002. [Google Scholar]
- 25.Schwarz-Dose J, Untch M, Tiling R, et al. Monitoring primary systemic therapy of large and locally advanced breast cancer by using sequential positron emission tomography imaging with [18F]fluorodeoxyglucose. J Clin Oncol. 2009 Feb 1;27:535–541. doi: 10.1200/JCO.2008.17.2650. [DOI] [PubMed] [Google Scholar]
- 26.Avril N, Rose CA, Schelling M, et al. Breast imaging with positron emission tomography and fluorine-18 fluorodeoxyglucose: use and limitations. J Clin Oncol. 2000 Oct 15;18:3495–3502. doi: 10.1200/JCO.2000.18.20.3495. [DOI] [PubMed] [Google Scholar]
- 27.Avril N, Menzel M, Dose J, et al. Glucose metabolism of breast cancer assessed by 18F-FDG PET: histologic and immunohistochemical tissue analysis. J Nucl Med. 2001 Jan;42:9–16. [PubMed] [Google Scholar]
- 28.Ikenaga N, Otomo N, Toyofuku A, et al. Standardized uptake values for breast carcinomas assessed by fluorodeoxyglucose-positron emission tomography correlate with prognostic factors. The American surgeon. 2007 Nov;73:1151–1157. [PubMed] [Google Scholar]
- 29.Ueda S, Tsuda H, Asakawa H, et al. Clinicopathological and prognostic relevance of uptake level using 18F-fluorodeoxyglucose positron emission tomography/computed tomography fusion imaging (18F-FDG PET/CT) in primary breast cancer. Japanese journal of clinical oncology. 2008 Apr;38:250–258. doi: 10.1093/jjco/hyn019. [DOI] [PubMed] [Google Scholar]
- 30.Gil-Rendo A, Martinez-Regueira F, Zornoza G, Garcia-Velloso MJ, Beorlegui C, Rodriguez-Spiteri N. Association between [18F]fluorodeoxyglucose uptake and prognostic parameters in breast cancer. The British journal of surgery. 2009 Feb;96:166–170. doi: 10.1002/bjs.6459. [DOI] [PubMed] [Google Scholar]
- 31.McDermott GM, Welch A, Staff RT, et al. Monitoring primary breast cancer throughout chemotherapy using FDG-PET. Breast Cancer Res Treat. 2007 Mar;102:75–84. doi: 10.1007/s10549-006-9316-7. [DOI] [PubMed] [Google Scholar]
- 32.Eary JF, Mankoff DA. Tumor metabolic rates in sarcoma using FDG PET. J Nucl Med. 1998 Feb;39:250–254. [PubMed] [Google Scholar]
- 33.Mankoff DA, Muzi M, Krohn KA. Quantitative positron emission tomography imaging to measure tumor response to therapy: what is the best method? Mol Imaging Biol. 2003 Sep-Oct;5:281–285. doi: 10.1016/j.mibio.2003.09.002. [DOI] [PubMed] [Google Scholar]
- 34.Huang SC. Standardized uptake value. Nucl Med Biol. 2000;27:643–646. doi: 10.1016/s0969-8051(00)00155-4. [DOI] [PubMed] [Google Scholar]
- 35.Eby PR, Partridge SC, White SW, et al. Metabolic and vascular features of dynamic contrast-enhanced breast magnetic resonance imaging and (15)O-water positron emission tomography blood flow in breast cancer. Academic radiology. 2008 Oct;15:1246–1254. doi: 10.1016/j.acra.2008.03.019. [DOI] [PMC free article] [PubMed] [Google Scholar]
- 36.Mulani N, Brandon D, Barron B, Lamki L, Gould L. The Standard Uptake Value (SUV). Is It Necessary for Diagnosing Malignant Tissue by F-18-FDG PET? Clin Positron Imaging. 1998 Sep;1:243. doi: 10.1016/s1095-0397(98)00033-8. [DOI] [PubMed] [Google Scholar]
- 37.Zasadny K, Wahl R. Regional FDG uptake versus blood flow in untreated primary breast cancers. J Nucl med. 1993;34 doi: 10.1007/s00259-002-1022-z. 74P. [DOI] [PubMed] [Google Scholar]
- 38.Padhani AR, Hayes C, Assersohn L, et al. Prediction of clinicopathologic response of breast cancer to primary chemotherapy at contrast-enhanced MR imaging: initial clinical results. Radiology. 2006 May;239:361–374. doi: 10.1148/radiol.2392021099. [DOI] [PubMed] [Google Scholar]
- 39.Li KL, Partridge SC, Joe BN, et al. Invasive breast cancer: predicting disease recurrence by using high-spatial-resolution signal enhancement ratio imaging. Radiology. 2008 Jul;248:79–87. doi: 10.1148/radiol.2481070846. [DOI] [PMC free article] [PubMed] [Google Scholar]
- 40.Beaulieu S, Kinahan P, Tseng J, et al. SUV varies with time after injection in (18)F-FDG PET of breast cancer: characterization and method to adjust for time differences. J Nucl Med. 2003 Jul;44:1044–1050. [PubMed] [Google Scholar]
- 41.Kumar R, Loving VA, Chauhan A, Zhuang H, Mitchell S, Alavi A. Potential of dual-time-point imaging to improve breast cancer diagnosis with (18)F-FDG PET. J Nucl Med. 2005 Nov;46:1819–1824. [PubMed] [Google Scholar]
- 42.Mavi A, Urhan M, Yu JQ, et al. Dual time point 18F-FDG PET imaging detects breast cancer with high sensitivity and correlates well with histologic subtypes. J Nucl Med. 2006 Sep;47:1440–1446. [PubMed] [Google Scholar]
- 43.O'Sullivan F. Imaging radiotracer model parameters in PET: a mixture analysis approach. IEEE transactions on medical imaging. 1993;12:399–412. doi: 10.1109/42.241867. [DOI] [PubMed] [Google Scholar]