Abstract
Diabetic patients undergoing hyperbaric oxygen treatments (HBO2) for refractory lower extremity neuropathic ulcers exhibit more than a 2-fold elevation (p=0.004) in circulating stem cells after treatments and the post-HBO2 CD34+ cell population contains 2 to 3-fold higher levels of hypoxia inducible factors (HIF)-1, -2 and -3, as well as thioredoxin-1 (p≤0.003) than cells present in blood prior to HBO2. Skin margins obtained from two day old abdominal wounds exhibit higher expression of CD133, CD34, HIF-1 and Trx-1 versus margins from refractory lower extremity wounds and expression of these proteins in all wounds is increased due to HBO2 treatment (p≤0.003). HBO2 is known to mobilize bone marrow stem cells by stimulating nitric oxide synthase (NOS). We found that NOS activity is acutely increased in patient's platelets following HBO2 and remains elevated for at least 20 hours. We conclude that HBO2 stimulates vasculogenic stem cell mobilization from bone marrow of diabetics and more cells are recruited to skin wounds.
Keywords: CD133, CD34, hypoxia inducible factors, thioredoxin
Introduction
Hyperbaric oxygen therapy (HBO2) has been shown to improve wound healing and reduce amputation rates of diabetic patients with lower extremity wounds refractory to standard management (1-3). Although controlled trials indicate its clinical utility, therapeutic mechanisms of action for HBO2 are unclear. One mechanism demonstrated in animal models involves vasculogenic stem/progenitor cells (SPCs) that are mobilized from bone marrow by short term exposure to HBO2 (4-7). Accelerated blood vessel formation and wound healing due to SPCs mobilized by HBO2 were shown in healthy animals and in a streptozocin diabetic mouse model (5-7). The aim of this study was to evaluate SPCs mobilization and tissue localization in diabetic patients.
SPCs mobilization due to HBO2 was demonstrated in healthy humans and in patients undergoing treatment for radiation necrosis (4). HBO2 mobilizes SPCs by stimulating parenchymal bone marrow cell nitric oxide synthase (type 3 or endothelial NOS [eNOS]) (4-6). Activity of eNOS is controlled by regulatory protein-protein interactions, protein phosphorylation and by dynamic sub-cellular targeting (8). The synthesis and function of eNOS is often impaired in diabetes due to mechanisms linked to hyperglycemia, insulin resistance and augmented superoxide production by mitochondria and NADPH oxidase (9, 10). Therefore, HBO2 may not be as effective for mobilizing SPCs in diabetics based on a number of biochemical mechanisms.
HBO2 mobilizes SPCs characterized by surface antigen expression of the primitive hematopoietic progenitor markers CD34 and CD133, and also CXCR4, the receptor for chemokine stromal cell-derived factor-1 (4). A subset of SPCs called endothelial progenitor cells (EPCs) has emerged as a major interest because of their capacity to home to sites of injury, differentiate into mature endothelial cells and participate in vascular repair. These cells are mobilized from the bone marrow in response to tissue wounding, ischemia and vascular perturbations (11, 12). EPCs express CD34 and CD133 as well as vascular endothelial markers such as CD31 and the vascular endothelial growth factor receptor-2 (VEGF-R2) (13, 14). EPCs are differentiated from hematopoietic SPCs because they have only low intensity expression of CD45 (CD45dim), also called the common leukocyte antigen.
There is also a population of circulating endothelial cells (CECs) with a mature phenotype which are probably derived from blood vessel wall turnover. These cells are increased in patients with some types of cancer and those with vascular injuries related to mechanical, inflammatory, infectious, ischemic and autoimmune stimuli (15). CECs exhibit reduced proliferative potential than bone marrow-derived EPCs and do not express the surface marker CD133.
We had four goals for this preliminary investigation: (1) To validate our method of evaluating circulating SPCs against a standard laboratory scheme; (2) To quantify changes in number and intracellular regulatory protein content of circulating SPCs in diabetics undergoing HBO2; (3) To develop methods to quantitatively evaluate wound site recruitment of SPCs in diabetic patients; and (4) To examine whether eNOS activity was modified by HBO2 in diabetic patients. An important element in this effort was to examine responses to an acute wound because of the heterogeneous nature of lower extremity refractory wounds. There are numerous reasons why diabetic wounds become refractory to clinical management (16, 17). Because abdominal skin is a standard source for skin grafts and wounds predictably heal, we established a protocol whereby abdominal wounds were generated using a small punch biopsy.
Methods and Materials
Patient recruitment and management
All aspects of this investigation were performed with institutional approval. Patients had diabetes mellitus, two had type 1 and all had neuropathic lower extremity ulcers of Wagner grade 3 or more. Neuropathy was defined as an inability to appreciate the 10-gram monofilament esthesiometer per standard neurosensory testing on the plantar aspect of the foot. Patients were excluded if they had an ankle/brachial index (ABI) of < 0.65 (if calcified vessels were suspected based on ABI value and monophasic waveform, the presence of vascular disease to warrant exclusion was determined by use of toe-brachial pressure index of < 0.65), if they had an active Charcot's joint by clinical or radiographic criteria, an ulcer deemed to be related to an etiology other than diabetes (e.g. rheumatoid disease, venous disease, or a vasculitis), the ulcer was not on the plantar/ventral aspect of the foot, if they were on dialysis for severe kidney failure or they were taking immunosuppressive agents.
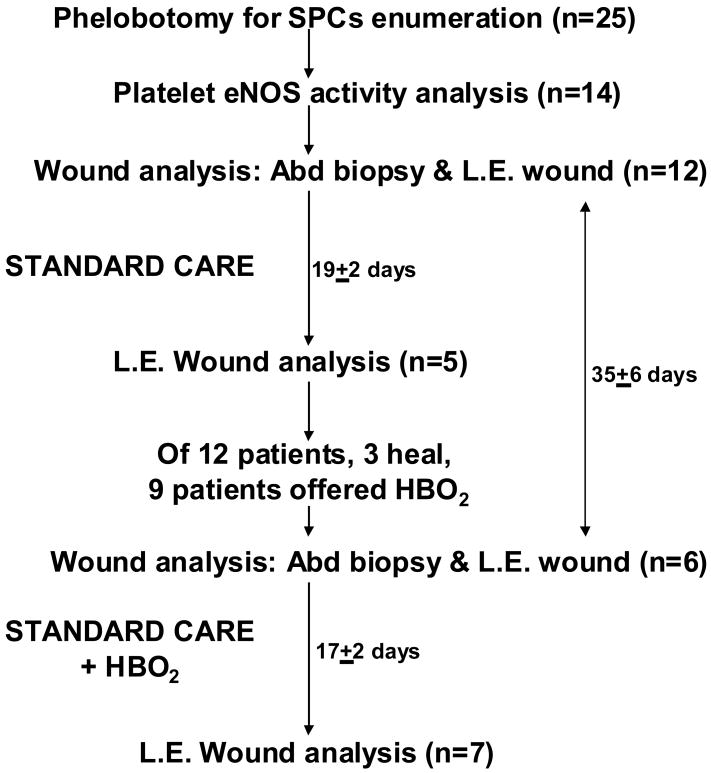
Work was done under two institutionally approved protocols. Initial studies focused solely on investigating circulating SPCs of patients undergoing HBO2 treatments, whereas the second included an analysis of SPCs and also tissues. Therefore, more patients had blood studies performed than had histological analysis of wound tissue. The same inclusion and exclusion criteria were used under both protocols, so circulating SPCs results are not separated between the two protocols. We estimated the required sample size at the outset of the study based on the magnitude of circulating stem cell mobilization in response to HBO2, as we had prior experience with this response from our previous study (4). Using a two-sided t-test with a significance level of 0.05, we estimated that a sample size of 20 patients would provide 80% power to see a difference of .06 percent CD34+ cells in response to HBO2. Figure 1 shows the numbers of patients involved in each aspect of the trial and outlines the types of tissues collected at each step. Twenty-five patients had blood samples drawn, average age was 60.7 ± 2.6 (SE) years, 6 (24%) were women. Patient results were compared against 16 healthy, non-diabetic adults taking no medications for at least 7 days, average age 43.8 ± 3.0 years, 8 (50%) were women.
Figure 1.
Schematic showing number of patients and tissue types obtained for analysis. SPCs = stem/progenitor cells, eNOS = endothelial nitric oxide synthase, Abd biopsy = abdominal biopsy wound, L.E. Wound = lower extremity neuropathic wound, HBO2 = hyperbaric oxygen therapy.
There were 13 patients approached for consent to do both blood cell and wound margin studies, 12 patients consented. Their average age was 56 ± 4 years, 2 (16.7%) were women and wounds had been present for 15 ± 4 months. At time of entry these individuals underwent a 3 mm abdominal skin punch biopsy (described below) and lower extremity wound margin sampling. Two days later a 5 mm punch biopsy was taken that overlapped the 3 mm biopsy site. Three (25%) patients achieved adequate lower extremity wound healing, as determined by their primary physicians, so that they were not offered a course of HBO2 therapy.
HBO2 is a standard therapy offered at our institution to those patients who fail conventional care in approximately 28 days. HBO2 treatments are carried out once per day, Monday through Saturday, at a pressure of 2.0 atmospheres absolute for 2 hours. Among the 9 patients who failed to achieve adequate healing with standard therapy, 1 (11.1%) refused HBO2, 8 (88.9%) were treated and 7 (77.8%) consented to allow collection of at least some tissues in a second cycle of sample collections. This involved obtaining wound and biopsy tissue and collecting blood. Among the 8 who received HBO2, 5 (62.5%) ultimately healed their wounds.
Wound management was supervised by a patient's primary physician and included limb off-loading, regular debridements and wound coverage. Choice of material for wound coverage was at the discretion of the primary physician. Standard surgical practice at our institution is to ‘saucer’ the wound margin by sharp debridement at initial evaluation and is sometimes performed a number of times over weeks. Debrided tissue was placed in 2 % formalin and analyzed as described below.
Materials
Chemicals were purchased from Sigma-Aldrich (St. Louis, MO) unless otherwise noted. Antibodies were purchased from the following sources: R-phycoerythrin (RPE) conjugated mouse anti-human CD34 (Clone 581, a class III CD34 epitope; BD Pharmingen, San Jose, CA), fluorescein isothiocyanate (FITC) conjugated mouse anti-human CXCR4, anti-human HIF-1, HIF-2 and HIF-3, allophycocyanin (APC)-conjugated mouse anti-human VEGF-R2 (R&D Systems, Minneapolis, MN), APC-conjugated CD133 (Miltenyi Biotec, Auburn, CA), anti-thioredoxin-1 (Trx-1) (Cell Signaling Technology, Danvers, MA) that was counterstained with APC-conjugated goat anti-mouse antibody (Molecular Probes, Eugene, Oregon).
Punch biopsy
An aspect of the wound analysis goal in this study pertained to comparing the histology of lower extremity wound margins with margins obtained from what was viewed as normal wound tissue that could be expected to heal promptly. Patients consenting to this procedure underwent a 3 mm punch biopsy to remove skin from the mid-abdomen lateral to the umbilicus and two days later, a second 5 mm punch biopsy at the same site. In this way a 2 mm rim of skin was obtained that could be analyzed. Patients had this performed at initial entry into the trial. If the lower extremity wound demonstrated poor healing over four weeks of care and patients agreed to a course of HBO2, a second punch biopsy was performed at another site on the abdomen prior to the first treatment. The second 5 mm biopsy was performed so that a 2 mm tissue sample was obtained after the second day of HBO2 therapy. Lower extremity wound tissue was also obtained at this time.
Biopsies were performed as follows: Skin was cleaned with isopropyl alcohol followed by povidone iodine solution, infiltrated with 1 % lidocaine and a 3 mm punch biopsy taken. Hemostasis was be achieved by holding direct pressure on the wound and once achieve, the biopsy site was cover with Tegaderm™ (3M Corporation, St. Paul, MN). After 48 hours a second 5 mm punch biopsy was performed at the same site following the same procedure and the punch biopsy wound closed with a suture. In all patients the biopsy wounds healed promptly without adverse effects.
Blood SPCs analysis
Phlebotomy for SPCs analysis was performed before and after a patient's first, 10th and 20th HBO2 treatments. The SPCs enumeration method used in this project was slightly modified from that outlined in our previous report (4). Flow cytometry was performed with a 4-color, dual laser analog FACSCalibur (Becton Dickinson, San Jose, CA) using CellQuest™ (Becton Dickinson, San Jose, CA) acquisition software. All studies included use of a vital nucleic acid dye (DRAQ5) to exclude platelets, un-lysed red cells and debris. All events were plotted in a CD34-PE vs. side scatter plot (SSC-H). Compensation was concentration dependent and determined empirically, all analyses followed standard methods with omission of the negative control staining, the ‘Fluorescence Minus One (FMO) Control Test’ (18). The CD34/DRAQ5 dual-positive cell population was identified based on FMO analysis, thus avoiding use of an arbitrary gating paradigm. Examples of an analysis obtained from a patient before and after undergoing their first HBO2 treatment are shown in Figure 2.
Figure 2.
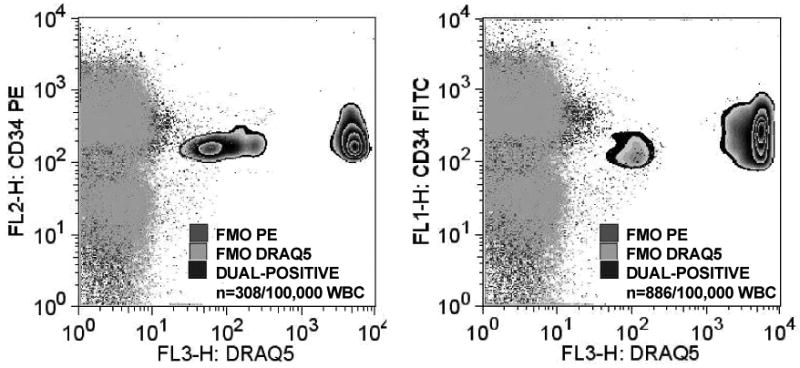
Flow cytometry plots demonstrating identification of SPCs based on fluorescence-minus-one (FMO) using dual markers for surface CD34 and DRAQ5 (DNA marker). SPCs were defined as only those exhibiting both fluorescent markers with intensity at or above 101 fluorescence units.
All cells were analyzed for CD34, CD45 and DRAQ5 and the fourth color was used on sub-sets to analyze for CD133, CXCR4 or CD31. EPCs were quantified in each sample as CD34+, CD45(dim), CD133+ cells multiplied by the fraction of the CD34+, CD45(dim), CD31+ cells. This was done because populations of cells positive for CD133 and CD31 were super-imposable; 96.3 ± 0.5 % of CD34+/CD45(dim) cells expressed CD31.
Standard SPCs analysis paradigms do not include evaluating intracellular proteins, but we have reported that cells mobilized by HBO2 may exhibit substantial differences from cells in animals exposed to only air (7). Therefore, in this trial we also examined intracellular proteins that have been shown to be responsible for augmented vasculogenesis by HBO2. Cells were permeabilized with saponin and stained for HIF-1, -2, -3 and Trx-1 as described previously (7).
The first goal of the project was to establish a standardized method for enumerating the various populations of SPCs in blood that also allows analysis of intracellular proteins. Because this is not a customary practice in studies of SPCs we wanted to be assured that this method was comparable to standard, published methods. There are standard clinical protocols for enumerating SPCs in peripheral blood to assess chemotherapeutic mobilization regimens for transplantation of hematopoietic progenitor cells. These protocols work well for estimating numbers of CD34+ cells, but there is substantial site-to-site variation in quantification schemes. The three major protocols (ProCOUNT, ISHAGE and MILAN) utilize slightly different antibody fluorophores and cell washing/lysis techniques and all have criteria for inclusion of cells within a particular range of sizes (19). This involves an operator-dependent judgment that leads to differences in gating parameters for each analysis. In order to establish that our method was comparable to others, we used the ProCOUNT method (BD Biosciences, San Jose, CA) because among the three standard SPCs counting regimens, it includes a DNA staining step.
Platelet NOS activit
Studies were performed in fourteen patients, 4 (28.6%) were women and their average age was 51 ± 3.6 (SE) years. Platelet samples from normal, healthy controls used as a comparison in these studies came from 14 individuals, 7 (50%) were women and their average age was 43.8 ± 3.0 years. Measurement of nitric oxide (.NO) production in platelets followed published procedures with only minor modifications (20). Blood in citrate-anticoagulated tubes was centrifuged at 500 × G for 10 minutes, the upper layer of platelet-rich plasma (PRP) was removed and diluted with 1/10 volume of acid-citrate-dextrose solution (24.5 g/L dextrose, 22 g/L sodium citrate and 7.3 g citric acid (ACD)). Samples were centrifuged at 1500 × G for 10 minutes and the platelet pellet washed twice with a 6:1 mixture of Hank's balanced salt solution (HBSS) and ACD. Samples were counted and the volume adjusted to achieve 3 × 10⁸ platelets /ml. Platelet samples (100 μl) were incubated with 0.9 ml 1.1 μM diaminodifluoroscein diacetate (DAF-DA) in HBSS at room temperature for 30 minutes. A second tube was also prepared as the first, except that it included 10 μM ATP (which stimulates ·NO synthesis). A third tube was prepared as the first, but included 100 μM L-nitroarginine methyl ester (L-NAME), a NOS inhibitor. After the 30 minute incubation fluorescence (495 nm excitation/ 515 nm emission) was measured in a Perkin Elmer LS 50 B fluorimeter.
Histochemical staining of tissue
Tissue samples were placed in 2 % buffered formalin when obtained at the bedside. Within 24 hours tissue was transferred to phosphate buffered saline (PBS) and stored at 4°C. Tissue was then warmed to room temperature, encased in agarose type 1B (Sigma) and 10 μm sections prepared using a vibrating microtome were placed on lysine-coated slides. Slides were washed with PBS, blocked in 5% goat serum supplemented with 2.5% BSA and incubated overnight at 4°C in the presence of 1:10 dilutions of mouse anti-human antibodies that recognize CD34 and CD133 to stain cell surface proteins. For intracellular staining the next day, after 2 washes in 0.5% BSA sections were permeabilized with 0.1% saponin (Sigma) in PBS containing 0.5% BSA for 20 minutes at room temperature. After two washes in PBS, 1:10 dilutions of antibodies recognizing HIF-1 or Trx-1 were added for 30 minutes at 4°C. After two washes with PBS, slides were analyzed by confocal microscopy.
Digital Image Acquisition
Images were acquired at a 60× magnification with a Bio-Rad Radiance 2000 (Bio-Rad Laboratories, Hercules, CA) attached to a Nikon TE 300 (Nikon Inc., Melville, NY) inverted-stage confocal microscope operated with a red diode laser at 638 nm and krypton lasers at 488 and 543 nm. Five images from each slide were obtained: One from the center and one from each of the four corners. Each image represented an area 169 μm × 169 μm (512 pixels by 512 pixels) and they were saved as 24-bit color TIFF images using Adobe Photoshop 6.0 (Adobe Systems; San Jose, CA).
Image Quantification
Each scanned image was analyzed in an automated fashion using Montage/MetaMorph 4.6 software (Universal Imaging; Downingtown, PA). Before quantitative analysis, a shading correction was performed on each image by creating a white reference image corresponding to a blank area. The slide images were corrected by subtracting the background area using imaging software. This correction removed dust shadow and scaled the light to the same intensity range, resulting in consistent thresholding over multiple image acquisition sessions. It also corrected for gaps or irregularities within individual sections. The minimum intensity for each slide was set at 128 and quantification performed automatically. Therefore, full microscope fields were quantified in an entirely automated, unbiased fashion. All slides for each sample were averaged to establish the mean fluorescence intensity. When dual staining was undertaken, we recorded the fluorescence intensity of individual fluorophores, the overlapping area, as well as the percent of the tissue area exhibiting fluorescence.
Statistics
Statistical analysis of stem cell numbers and quantitative changes in wound protein markers was carried out by repeated measures analysis of variance (RM-ANOVA) followed by the Holm-Sidak test (SigmaStat™, Jandel Scientific, San Rafael, CA). We made an a priori decision to undertake four comparisons: SPCs obtained prior to HBO2 treatment #1 were compared with cells before HBO2 treatments #10 and #20, and after HBO2 treatments # 1, #10 and #20. Correlations between the magnitude of SPCs mobilization due to HBO2 and values of blood glucose measured at time of evaluation for wound care, hemoglobin A1C (HbA1C) and patient age were assessed using the Pearson Product Moment Correlation. Analysis of platelet eNOS activity, biopsy tissue pre- and post-initiation of HBO2 and comparisons of SPCs between control subjects and patients prior to initiation of HBO2 were done by t-test. The level of significance was taken as p≤ 0.05 and results are displayed in figures to show mean and each data point in scatter plots, values shown in the text are mean±SE.
Results
Circulating SPCs characterization
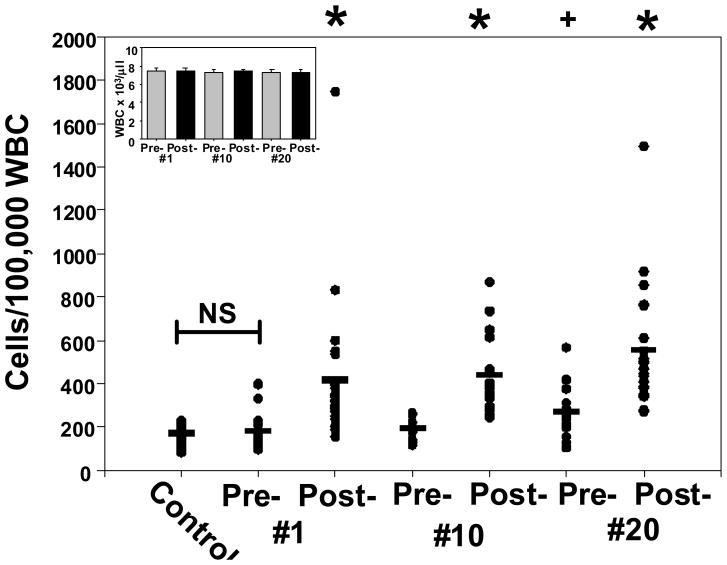
SPCs were quantified in blood obtained before and after HBO2 treatments (Figure 3). Total leukocyte counts were not significantly different over the course of therapy, as shown in the figure inset. The initial screening quantified expression of the CD34 surface glycoprotein on cells that dimly expressed the hematopoietic marker, CD45. Elevations in the CD34+/CD45dim cell population were statistically significant after each HBO2 treatment (p≤0.005). SPCs elevations per 100,000 leukocytes following each HBO2 treatment did not differ in a statistically significant manner between the first and 20th treatments. That is, following treatment #1 the SPCs elevation was 402 ± 63, for treatment #10 it was 424 ± 40 and for treatment #20 it was 543 ± 60 (p=0.32, RM-ANOVA, not significant). Serum glucose among the patients was 156 ± 40 mg/dl and HbA1C was 7.5 ± 0.5 %. Whereas there was a correlation between glucose and HbA1C (p=0.009), no correlation was found between glucose and SPCs mobilization by HBO2 (p=0.62), between HbA1C and SPCs mobilization by HBO2 (p=0.54) or patient age and mobilization by HBO2 (p=0.70). The CD34+/CD45dim cell population in healthy, non-diabetic individuals (control) was not significantly different (p=0.67) from the population in diabetic patients before starting HBO2.
Figure 3.
Circulating CD34+/CD45dim SPCs. Blood samples were from healthy controls (n=16) and diabetic patients undergoing HBO2 treatments. Patient samples were obtained pre- and post-treatment #1 (n=25), treatments #10 (n=23) and #20 (n=23). Horizontal bar shows mean and all values are shown as a scatter plot. Statistical analysis among groups are shown by symbols at the top of the figure as *p≤0.003, + p=0.007 (repeated measures ANOVA).
As mentioned in the Introduction, we wanted to compare our method for counting SPCs with the published standard ProCOUNT method. SPCs from 11 patients were run in parallel. There were no significant differences in pre-HBO2 SPCs counts (p=0.299), post-HBO2 SPCs counts (p=0.273) and the elevations in SPCs associated with HBO2 were similar. That is, according to our method the SPCs count was elevated 2.00 ± 0.12 fold and the ProCOUNT method indicated that the count was elevated 2.08 ± 0.14 fold (no significant difference between methods, p=0.52).
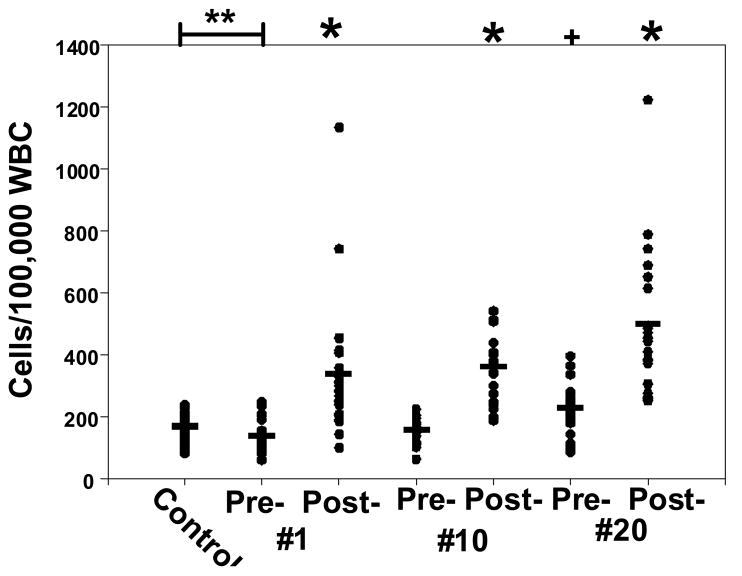
EPCs, the stem cell sub-set exhibiting CD34, CD133 and CD31, and dim expression of CD45 is shown in Figure 4. There were significantly fewer EPCs in diabetic patients prior to starting HBO2 than in the control group (p=0.001). Elevations associated with each HBO2 exposure are shown. Prior to the 20th HBO2 treatment, the EPCs population was significantly higher than that prior to treatment #1 (p=0.013). A separate set of analyses were carried out using antibody to VEGF-R2 as the endothelial lineage surface marker instead of CD31. This analysis gave results identical to those observed when using CD31 (data not shown). Furthermore, consistent with the bone marrow origin of HBO2-mobilized cells, CXCR4 expression on CD34+/CD45dim cells was 98.0 ± 0.1 %.
Figure 4.
Circulating endothelial progenitor cells. Samples were obtained from healthy controls (n=16) and diabetic patients pre- and post-HBO2 treatment #1 (n=25), treatments #10 (n=23) and #20 (n=23). Horizontal bar shows mean and all values are shown as a scatter plot. Statistical analysis among groups are shown by symbols at the top of the figure as *p≤0.005, + p=0.013 (repeated measures ANOVA), **p=0.001 (t-test).
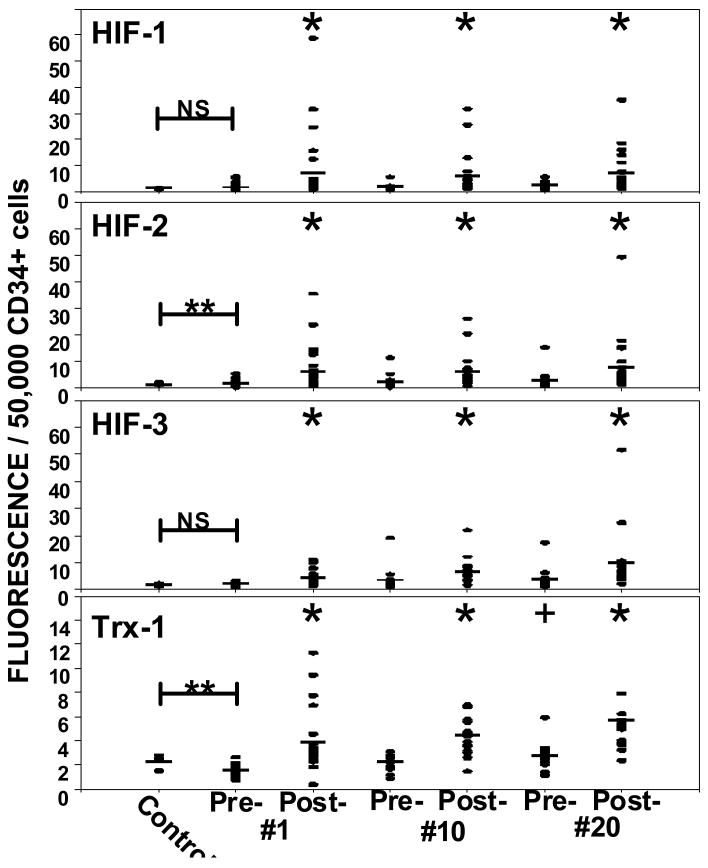
As previously discussed, our method for analyzing SPCs provides the opportunity to probe the concentration of intracellular proteins. Based on previous work, we were interested in evaluating the concentration of HIF isoforms and thioredoxin (Trx-1) in CD34+ cells (Figure 5). HIF-2 and Trx-1 were significantly different between control cells and those obtained prior to the first HBO2 treatment (p=0.007). The concentrations of all four proteins were elevated after each HBO2 treatment (p≤0.006). The Trx-1 value prior to HBO2 treatment # 20 was also significantly different from the value prior to the first HBO2 treatment (p=0.006).
Figure 5.
Intracellular content of hypoxia inducible factor-1 (HIF-1), HIF-2, HIF-3 and thioredoxin-1 (Trx-1) in circulating CD34+/CD45dim SPCs. Samples were obtained from healthy controls (n=16) and diabetic patients pre- and post-HBO2 treatment #1 (n=25), treatments #10 (n=23) and #20 (n=23). Horizontal bar shows mean and all values are shown as a scatter plot. Statistical analysis among groups are shown as *p≤0.006, repeated measures ANOVA, ** p≤0.05, t-test.
Endothelial cells in blood
Circulating endothelial cells (CECs) express CD34 but not CD133 and they can be elevated by a variety of stimuli (15). CECs were quantified by subtracting the EPC population in each patient (Figure 4) from the CD34+/CD45dim population (Figure 3). The control group had 2.2 ± 0.5 CECs/100,000 white cells whereas the diabetic patients had 36.2 ± 6.8 (p<0.001) prior to starting HBO2. CECs counts in blood obtained after each HBO2 treatment exhibited very large variability; the range was from 1 to 266 CECs/100,000 white cells and no values were significantly different from the pre-HBO2 treatment #1 value (RM-ANOVA).
Histochemical analysis
According to the protocol outlined in Methods, six types of wound tissue were collected (see Figure 1). Abdominal biopsy and debrided lower extremity wound margins were obtained from 12 patients undergoing standard wound management. At 19 ± 2 days, while still receiving standard wound care, wound tissue margins were obtained a second time from 5 patients, three of whom went on to heal adequately over the next approximately 10 days so that they were not offered a course of HBO2 therapy. Among the 9 patients who were referred for HBO2, 6 consented to undergo a second abdominal biopsy routine concurrent with obtaining a margin of the lower extremity wound and 7 consented to obtaining wound margins after 17 ± 2 days of standard care plus HBO2 (time interval not significantly different from interval among patients receiving only standard care, p=0.8). As described in Methods, the 5 mm biopsy margins as well as samples of lower extremity wound margins were taken after patients had completed 2 HBO2 treatments. The interval of time between the first biopsy, while undergoing standard wound care, and the second biopsy while receiving standard care and HBO2 was 35 ± 6 days.
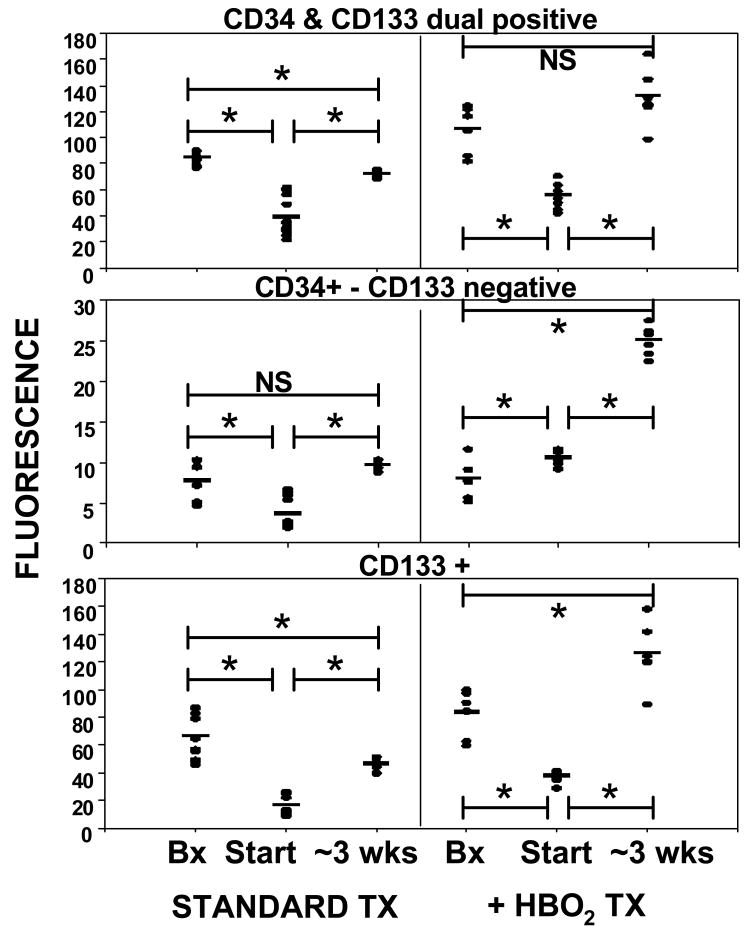
Wound margins were analyzed for expression of CD34, CD133, HIF-1 and Trx-1. Figure 6 shows a number of immunohistochemical images of wound tissue. Figure 7 upper panel shows results for dual-positive stem cell surface marker staining. The second and third panels indicate that the majority of CD133 fluorescence overlapped with CD34. Tissue staining positive for CD34 and negative for CD133 is likely due to endothelium versus recruited SPCs. At the start of standard care, CD34 and CD133 contents in lower extremity wound margins were less than the biopsy margins. With standard wound care, these values rose and became significantly different from the start of care (p≤0.003). Biopsy wound margins taken from patients after 2 days of HBO2 exhibited higher fluorescence due to CD133 and CD34 (dual positive) than biopsy margins obtained at the start of standard care (p=0.034), but no difference in CD34 which did not overlap with CD133 (p=0.83). Lower extremity wounds exhibited less CD133 than did the biopsy margins after 2 days of HBO2 and values rose significantly over the course of HBO2 treatments (p≤0.001). Wound margins had significantly higher CD133 expression after HBO2 than after standard care alone. Lower extremity wound margin CD133 and CD34 expression rose between the start and end of HBO2 therapy (p≤0.001).
Figure 6.
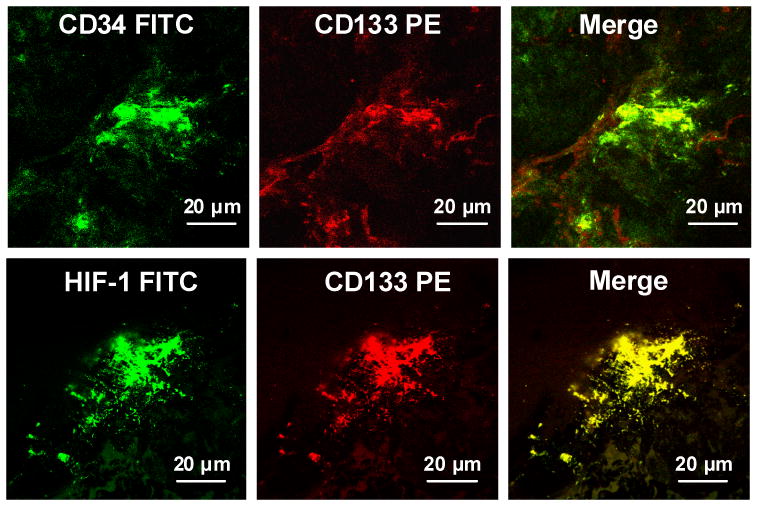
Image of lower extremity wound margin showing immunohistochemical staining for surface markers CD34 and CD133 and intracellular HIF-1.
Figure 7.
CD133 and CD34 expression in tissues. Histochemical analyses expressed as arbitrary fluorescence units were performed on abdominal biopsy wounds (labeled as Bx) and the lower extremity wound at outset (labeled as Start) of standard care and two days after initiation of HBO2. Lower extremity wound margins were obtained for follow-up analysis after ∼ 3 weeks of standard care or standard care plus HBO2. Horizontal bar shows mean and values for all patients are shown as a scatter plot. Statistical analyses between groups are shown as *p≤0.003, t-test. The biopsy margin values for dual-positive CD34 and CD133 were significantly different between samples obtained at the start of standard care and two days after initiating HBO2 (p = 0.034) and for solely CD133+ staining (p = 0.039). Biopsy values for CD34+ - CD133- were not significantly different between samples obtained at the start of standard care and two days after initiating HBO2.
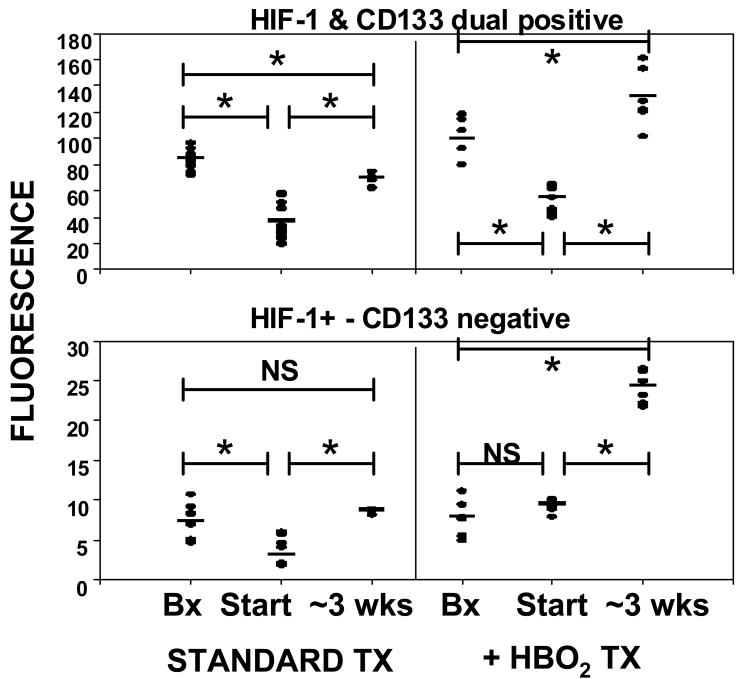
Figure 8 shows analyses of HIF-1 expression in tissues. The upper panel demonstrates overlapping fluorescence intensity for CD133 and HIF-1 (a typical image is shown in the lower panels of Figure 6). Figure 8 lower panel shows HIF-1 staining that did not overlap with CD133.
Figure 8.
CD133 and HIF-1 expression in tissues. Histochemical analyses were performed on abdominal biopsy wounds (labeled as Bx) and the lower extremity wound at outset (labeled as Start) of standard care and two days after initiation of HBO2. Lower extremity wound margins were obtained for follow-up analysis after ∼ 3 weeks of standard care or standard care plus HBO2. Horizontal bar shows mean and all values are shown as a scatter plot. Statistical analyses between groups are shown as *p≤0.001, t-test. Biopsy margin values were not significantly different between samples obtained at the start of standard care and two days after initiating HBO2.
An elevation of fluorescence overlap between two proteins could result from recruitment of more cells and/or more protein per cell. To obtain insight into this issue, computer analysis of the mean percent area on each slide related to fluorescence of a particular protein is shown in Table 1. For example, on average in the standard treatment abdominal biopsy, 0.44 ± 0.02 % of the slide area analyzed exhibited dual positive staining for CD133 and HIF-1, whereas HIF-1 fluorescence that did not overlap with CD133 occurred on 0.36 ± 0.03 % of the slide area. The ordinate scale in Figure 8 demonstrates that the majority of fluorescence related to HIF-1 overlaps with CD133, but the % area analysis (Table 1) reflects that nearly the same magnitude of slide tissue area exhibits overlapping fluorescence for CD133 and HIF-1 as HIF-1 fluorescence that does not overlap with CD133.
Table 1.
Tissue area on slides exhibiting fluorescence for one or more protein markers.
| STD CARE | STD CARE + HBO2 | |||||
|---|---|---|---|---|---|---|
| Biopsy | Start | ∼ 3 weeks | Biopsy | Start | ∼3 weeks | |
| CD133+ & HIF-1+ | 0.44 ± 0.02 % | 0.18 ± 0.02 % * | 0.22 ± 0.01% * | 2.0 ± 0.7 % | 0.28 ± 0.02 % * | 3.90 ± 0.93 % † |
| HIF+ & CD133- | 0.36 ± 0.03 % | 0.12 ± 0.01 % * | 0.25 ± 0.01 % *† | 1.74 ± 0.63 % | 0.22 ± 0.03 % * | 3.53 ± 0.74% † |
| CD133+ & H1F+ | 0.58 ± 0.03% | 0.12 ± 0.01 % * | 0.26 ± 0.02 % *† | 1.91 ± 0.65 % | 0.32 ± 0.02 % * | 4.12 ± 0.92 % † |
| Trx+ & CD133- | 0.33 ± 0.08 % | 0.08 ± 0.01 % * | 0.92 ± 0.02 % *† | 1.72 ± 0.63 % | 1.25 ± 0.21 % | 3.42 ± 0.74 % † |
Values show percent of tissue area exhibiting fluorescence for the marker (s) shown in the left column (mean ± SE). Statistical analyses were performed for tissues while patients were undergoing standard (STD) care, for tissues while patients were undergoing standard care plus HBO2 and between the biopsy margins obtained at the start of standard care and two days after starting HBO2 (t-test). Biopsy = margin of the ‘fresh’ 48 hour-old abdominal biopsy wound margin. Start = lower extremity wound margin taken at the start of standard care or 2 days after starting standard care + HBO2. The column marked (∼ 3 weeks) shows values obtained from lower extremity wound margins taken after 19 ± 2 days of standard care or 17 ± 2 days of standard care + HBO2. To ease viewing the magnitude of statistical differences was not shown, but p values ranged from ≤ 0.001 to < 0.05;
significantly different from biopsy tissue value in the standard care or standard care + HBO2 group,
significantly different from lower extremity wound margin value at start of care (either standard or standard + HBO2). For all four groups shown in left column, the biopsy margin values were significantly different between samples obtained during standard care and standard care + HBO2.
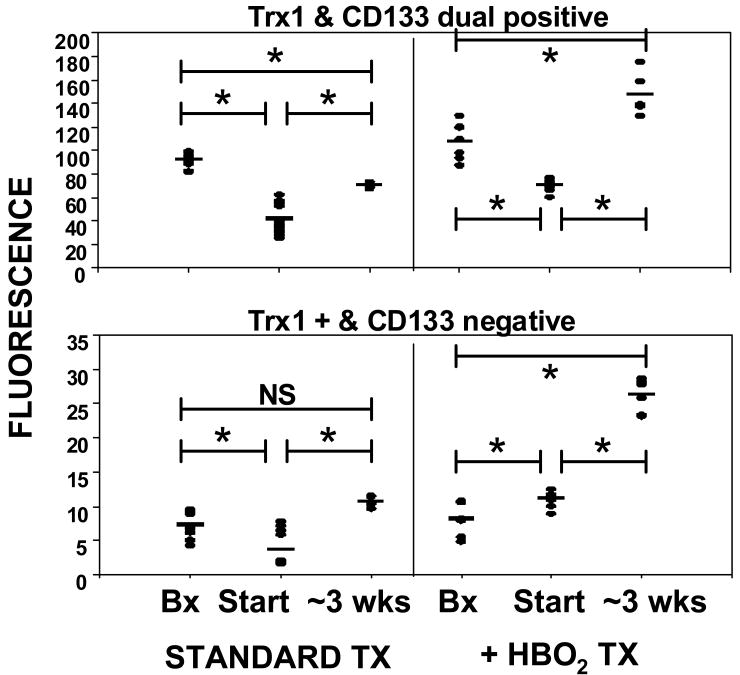
Figure 9 shows analysis of Trx-1 in tissues. The upper panel demonstrates overlapping fluorescence intensity for CD133 and Trx-1, the lower panel shows Trx-1 staining that did not overlap with CD133. Computer analysis of the mean percent area that was fluorescent on each slide is shown in Table 1. As with HIF-1, the ordinate of Figure 9 demonstrates that the majority of fluorescence related to Trx-1 overlaps with CD133 but the % area analysis reflects that the area of Trx-1 fluorescence in tissues unrelated to CD133 was similar or even greater than the area that overlaps with CD133.
Figure 9.
CD133 and Trx-1 expression in tissues. Histochemical analyses were performed on abdominal biopsy wounds (labeled as Bx) and the lower extremity wound at outset (labeled as Start) of standard care and two days after initiation of HBO2. Lower extremity wound margins were obtained for follow-up analysis after ∼ 3 weeks of standard care or standard care plus HBO2. Horizontal bar shows mean and all values are shown as a scatter plot. Statistical analyses between groups are shown as *p≤0.003, t-test. Biopsy margin values were not significantly different between samples obtained at the start of standard care and two days after initiating HBO2.
Platelet ·NO synthesis
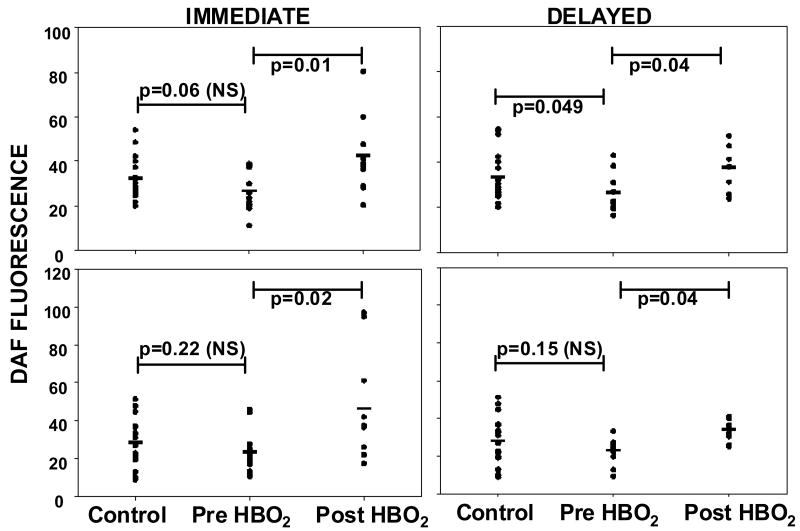
As mentioned in Introduction, eNOS activity is related to SPCs mobilization from bone marrow and enzyme activity may be inhibited in diabetics. To gain insight into this issue we evaluated eNOS activity in platelets assessed as DAF fluorescence (Figure 10). As all fluorescence in these assays was inhibited when L-NAME was added to the platelet suspensions, results are interpreted as ·NO production by platelet eNOS. Prior to HBO2 ·NO synthesis in un-stimulated platelets from diabetic patients was slightly less than in platelets from non-diabetic controls (p=0.06, not significant). Control platelets and those from diabetics prior to HBO2 treatment exhibited similar elevations in enzyme activity caused by incubation with ATP (p=0.22, not significant). In platelets removed immediately following a patient's first HBO2 treatment there was a marked elevation in ·NO synthesis, as well as an augmented response to addition of ATP. If platelet samples were stored at 4°C and re-assayed 22 ± 2 hours later, elevated ·NO synthesis in HBO2-exposed samples persisted (shown in boxes labeled ‘delayed’ in Figure 10). DAF fluorescence before and after HBO2 treatments 10 and 20 were not significantly different from values measured for treatment #1 (p≥0.8). Hemoglobin A1C values among the 14 patients ranged from 5.1 to 13.1, the average was 7.5 ± 0.6. Using a cut-off of 6.5 as indicative of well controlled diabetes, seven patients had HbA1C values ≤ 6.5. There were no differences in responses among patients with HbA1C values above or below 6.5.
Figure 10.
Nitric oxide synthase activity in platelets. Left side figures show un-stimulated platelet DAF fluorescence and fluorescence in platelets stimulated by ATP immediately after platelets were isolated from controls and patients pre- versus post-HBO2. Right side figures show DAF fluorescence in platelets after storage for 22 ± 2 hours. Horizontal bar shows mean and all values are shown as a scatter plot. Statistical analyses between groups are shown as p values for individual comparisons (t-test).
Discussion
Exposure to HBO2 mobilizes SPCs from the bone marrow of diabetic patients, resulting in over a 2-fold increase in the circulating population following each treatment. The SPCs count returned to baseline prior to the 10th HBO2 treatment. Before the 20th treatment the SPCs count was elevated 1.6-fold over that present prior to treatment #1, and as with prior treatments the level doubled following the 20th HBO2 treatment. In contrast to SPCs mobilization stimulated by infusion of growth factors; HBO2 does not concomitantly elevate the circulating leukocyte count which may be thrombogenic (21). The SPCs mobilization response in diabetic patients differs from the pattern found in patients undergoing HBO2 for radiation injuries, where SPCs counts remained elevated following treatments #1 and #10, and reached an eight-fold elevation by the 20th HBO2 treatment (4).
The mechanism for SPCs mobilization by HBO2 was shown in animal trials to be due to stimulation of eNOS in bone marrow parenchyma (4, 5). We found that HBO2 stimulates platelet eNOS in diabetic patients, but whether HBO2-mediated activation differs within the bone marrow cavity or from responses in non-diabetics is unknown. We examined eNOS activity approximately 22 hours after HBO2 to gain further insight into the activation mechanism. Persistently elevated activity, albeit less than that seen immediately after HBO2, argues that the HBO2 effect is more complex than merely providing additional O2 substrate to the enzyme, but more work is needed to clarify biochemical events. One possible mechanism is an enhancement in the association between the NOS enzyme and heat shock protein 90 (22, 23).
Our findings of elevations of CECs and reduced numbers of EPCs in diabetic patients are consistent with reports from others (24, 25). While very small numbers of CECs are present in healthy individuals, their number increases dramatically in diseases with vascular damage, such as cardiovascular diseases, vasculitis, specific infections, and type 1 or 2 diabetes (15). Elevations correlate with disease activity and are closely related to the severity of endothelial lesions. We found elevated levels of CECs in the patients over controls, which may be due to the presence of peripheral skin ulcers as well as other factors. The therapeutic mechanisms of action for HBO2 are related to oxidative stress and so transient elevations in CECs might be expected (26). Clearly, however, many factors influence CECs liberation to the circulation because of the high degree of variability we found in CECs cell counts. In diabetes, not only is there a deficiency in the number of EPCs, these cells also exhibit a functional deficit for forming new blood vessels (9, 16). Functional studies were not performed in this project.
SPCs mobilized by HBO2 are endowed with markedly higher intracellular concentrations of the three HIF isoforms and with Trx-1 than SPCs circulating in blood prior to the treatments. This is likely to be a manifestation of cellular immaturity, as it disappears before the next set of samples obtained before the 10th and 20th HBO2 treatments. These findings are similar to responses in mice (7). The fluorescence measurements are useful for showing relative differences among the cell samples but signal intensities may not quantitatively reflect the magnitude of protein expression per cell. We would anticipate that cells with higher concentrations of HIF isoforms and Trx-1 would have higher functionality. Based on animal studies, HBO2 stimulates SPCs growth and differentiation by engaging a physiological autocrine activation loop responsive to oxidative stress. Hyperoxia influences SPCs recruitment as well as peripheral site differentiation via a pathway involving Trx-1, HIF-1 and HIF-2, with a suppressive action associated with HIF-3 (7). HIF-1 and -2 stimulate transcription of many genes involved with neovascularization.
Wound margin analysis during standard therapy demonstrated higher presence of CD133 in the 2 day-old abdominal biopsy wounds than in the debrided tissue from lower extremity wounds. Rare CD133+ cells are found in most adult human organs and are thought to represent organ-specific stem cells (27, 28). We interpret differences in CD133 content of wound margins in this study to circulating SPCs recruitment because organ-specific CD133+ stem cells do not express CD34 and virtually all CD133 fluorescence overlapped with CD34 in our samples (27). Therefore, less CD133 content in refractory wound margins versus that found in ‘fresh’ wound abdominal biopsy sites seems likely to reflect a relative deficiency of vasculogenic stem cells. Moreover, it is logical that the increase in lower extremity wound CD133 over the course of standard therapy reflects improved wound status (e.g. healing). There were no discernible differences between the samples from patients who achieved adequate healing with standard therapy (n=3) versus those who went on to require HBO2 (n=2). These sample sizes were insufficient to make statements about healed wounds.
Abdominal biopsy wounds of patients undergoing HBO2 exhibited greater CD133 content than biopsy margins when patients were undergoing standard treatment. We interpret this difference as well as the marked elevation in CD133 content of lower extremity wound margins between start and ∼ 3 weeks of HBO2 therapy as arising due to circulating SPCs recruitment. The simple interpretation for these findings is that higher numbers of circulating cells led to greater peripheral site recruitment. It is also possible that hyperoxia enhances homing of SPCs to wounds. In animals HBO2 stimulates growth factor synthesis by tissue-sequestered SPCs, which augments further SPCs recruitment and also neovascularization (7). Improved SPCs functions at peripheral sites by HBO2 have been shown for transplanted cells in ischemic heart muscle, injured nerves and in human pancreas (29-31).
Reduced concentrations of HIF-1 and Trx-1 in the debrided lower extremity wound margins versus biopsy sites would be anticipated to reflect slower healing and increasing the concentration of these proteins should improve healing. Trx-1 can act as a transcription factor and in SPCs, appears to be one of the proximal species responsible for promoting expression and activity of HIF isoforms (32). A physiological oxidative stress that triggers the same pathway is lactate metabolism (33). HIF isoform expression appears to vary with different tissues and possibly with chronology (e.g. looking early or late after wounding or an ischemic insult). One recent model showing accelerated wound healing by HBO2 reported decreased HIF-1 levels at wound margins, along with reduced inflammation and fewer apoptotic cells (34). HIF-1 is a major mediator of VEGF transcription and VEGF is the most specific growth factor for neovascularization (35, 36). In other wound studies, higher levels of HIF-1 were linked to elevated VEGF in wounds in response to hyperoxia (37, 38).
The heterogeneous nature of refractory wounds makes interpretation of finding reduced HIF-1 and Trx-1 concentrations in wounds versus ‘fresh’ biopsy sites difficult. Diabetes impedes HIF-1 synthesis, stability and function by several mechanisms (39, 40). The majority of HIF-1 and Trx-1 in biopsy and lower extremity wounds is associated with CD133 based on Figures 8 and 9. This suggests that recruited SPCs are a major source for these critical regulatory proteins, which has important implications pertaining to wound healing in diabetics. The quantification of percent area in the tissue samples offers further insight into wound dynamics. We interpret elevations in percent area associated with dually positive CD133-and-HIF-1 and CD133-and-Trx-1 between start and end of treatments and also standard care versus HBO2 as reflecting greater CD133 cell recruitment. The percent area due to Trx-1 that did not overlap with CD133 was similar for most samples to the percent area due to HIF-1 that did not overlap with CD133 (Table 1). This is not surprising as we expect changes in local cell metabolic activity during wound healing and an increase related to HBO2.
Like many preliminary studies, our methodology involves a number of novel procedures that could threaten the validity of our conclusions. In particular, as previously mentioned, the small sample size could have led to a type 2 statistical error, wherein we failed to note a significant difference in lower extremity wound CD133 fluorescence between patients that went on to heal with standard therapy and those that underwent HBO2 therapy. Furthermore, we did not undertake functional testing of SPCs angiogenic potential, although such ex vivo tests are subject to their own criticisms and concerns. Our relatively small patient sampling with their different ages and gender distributions could also have influenced conclusions.
This study achieved a number of goals: (1) We conclude that our methodology for quantifying circulating SPCs yields the same cell counts as the standard ProCOUNT method and has advantages of not relying on arbitrary gaiting and concurrently allows probing intracellular protein concentrations. (2) HBO2 stimulates SPCs mobilization in diabetics. The rapid mobilization (within 2 hours) by HBO2 allows demonstration that cells newly released from bone marrow possess elevated HIF isoforms and Trx-1 in comparison to SPCs present prior to hyperoxia. (3) SPCs homing to ‘fresh’ abdominal biopsy wounds exceeds that found in refractory lower extremity wounds and differences in wound margin content of HIF-1 and Trx-1 are closely linked to recruited CD133+ cells. HBO2 elevates SPCs recruitment and therefore wound margin presence of HIF-1 and Trx-1 of both wound types. (4) Platelet eNOS activity in diabetics is stimulated by HBO2.
Based on these findings, we conclude that HBO2 stimulates vasculogenic stem cell mobilization from the bone marrow and migration to skin wounds in diabetic individuals. There is need for a larger clinical trial aimed at further defining the causal relationship between SPCs mobilization and recruitment to lower extremity wounds, and ultimate wound healing, in diabetic patients. Another aim for future work is to more clearly resolve the basis for differences in SPCs mobilization responses among diabetics versus post-irradiation patients.
Acknowledgments
Funds for this work were provided by the National Institutes of Health grants R29-DK080376 (Thom) and K24-AR002212 (Margolis), and the Office of Naval Research grant N00014-06-0363 (Thom). GU was supported by an educational grant from the Turkish Navy.
References
- 1.Duzgun AP, Satir AZ, Ozozan O, Saylam B, Kulah B, Caskun F. Effect of hyperbaric oxygen therapy on healing of diabetic foot ulcers. J Foot Ankle Surg. 2008;47:515–9. doi: 10.1053/j.jfas.2008.08.002. [DOI] [PubMed] [Google Scholar]
- 2.Londahl M, Katzman P, Nilsson A, Hammarlund C. Hyperbaric oxygen therapy facilitates healing of chronic foot ulcers in patients with diabetes. Diab Care. 2010;33:998–1003. doi: 10.2337/dc09-1754. [DOI] [PMC free article] [PubMed] [Google Scholar]
- 3.Goldman RJ. Hyperbaric oxygen therapy for wound healing and limb salvage: a systematic review. Phys Med and Rehabil. 2009;1:471–89. doi: 10.1016/j.pmrj.2009.03.012. [DOI] [PubMed] [Google Scholar]
- 4.Thom SR, Bhopale VM, Velazquez OC, Goldstein LJ, Thom LH, Buerk DG. Stem cell mobilization by hyperbaric oxygen. Am J Physiol Heart Circ Physiol. 2006;290(4):H1378–86. doi: 10.1152/ajpheart.00888.2005. [DOI] [PubMed] [Google Scholar]
- 5.Goldstein LJ, Gallagher KA, Bauer SM, Bauer RJ, Baireddy V, Liu ZJ, Buerk DG, Thom SR, Velazquez OC. Endothelial progenitor cell release into circulation is triggered by hyperoxia-induced increases in bone marrow nitric oxide. Stem Cells. 2006;24(10):2309–18. doi: 10.1634/stemcells.2006-0010. [DOI] [PubMed] [Google Scholar]
- 6.Gallagher KA, Liu ZJ, Xiao M, Chen H, Goldstein LJ, Buerk DG, Nedeau A, Thom SR, Velazquez OC. Diabetic impairments in NO-mediated endothelial progenitor cell mobilization and homing are reversed by hyperoxia and SDF-1 alpha. J Clin Invest. 2007;117(5):1249–59. doi: 10.1172/JCI29710. [DOI] [PMC free article] [PubMed] [Google Scholar]
- 7.Milovanova T, Bhopale VM, Sorokina EM, Moore JS, Hunt TK, Hauer-Jensen M, Velazquez OC, Thom SR. Hyperbaric oxygen stimulates vasculogenic stem cell growth and differentiation in vivo. J Appl Physiol. 2009;106:711–28. doi: 10.1152/japplphysiol.91054.2008. [DOI] [PMC free article] [PubMed] [Google Scholar]
- 8.Fulton D, Gratton JP, Sessa WC. Post-translational control of endothelial nitric oxide synthase: Why isn't calcium/calmodulin enough? Journal of Pharmacology and Experimental Therapeutics. 2001;299:818–24. [PubMed] [Google Scholar]
- 9.Brownlee M. The pathobiology of diabetic complications: a unifying mechanism. Diabetes. 2005;54(6):1615–25. doi: 10.2337/diabetes.54.6.1615. [DOI] [PubMed] [Google Scholar]
- 10.Hink U, Li H, Mollnau H, Oelze M, Matheis E, Hartmann M, Skatchkov M, Thaiss F, Stahl RA, Warnholtz A, Meinertz T, Griendling K, Harrison DG, Forstermann U, Munzel T. Mechanisms underlying endothelial dysfunction in diabetes mellitus. Circ Res. 2001;88(2):E14–22. doi: 10.1161/01.res.88.2.e14. [DOI] [PubMed] [Google Scholar]
- 11.Massa M, Rosti V, Ferrario M, Campanelli R, Ramajoli I, Rosso R, De Ferrari GM, Ferlini M, Goffredo L, Bertoletti A, Klersy C, Pecci A, Moratti R, Tavazzi L. Increased circulating hematopoietic and endothelial progenitor cells in the early phase of acute myocardial infarction. Blood. 2005;105:199–206. doi: 10.1182/blood-2004-05-1831. [DOI] [PubMed] [Google Scholar]
- 12.Morris LM, Klanke CA, Lang SA, Pokall S, Maldonado AR, Vuletin JF, Alaee D, Keswani SG, Lim FY, Crombleholme TM. Characterization of endothelial progenitor cells mobilization following cutaneous wounding. Wound Rep Regen. 2010;18:383–90. doi: 10.1111/j.1524-475X.2010.00596.x. [DOI] [PMC free article] [PubMed] [Google Scholar]
- 13.Asahara T, Murohara T, Sullivan A, Silver M, van der Zee R, Li T, Witzenbichler B, Schatteman G, Isner JM. Isolation of putative progenitor endothelial cells for angiogenesis. Science. 1997;275(5302):964–7. doi: 10.1126/science.275.5302.964. [DOI] [PubMed] [Google Scholar]
- 14.Peichev M, Naiyer AJ, Pereira D, Zhu Z, Lane WJ, Williams M, Oz MC, Hicklin DJ, Witte L, Moore MA, Rafii S. Expression of VEGFR-2 and AC133 by circulating human CD34(+) cells identifies a population of functional endothelial precursors. Blood. 2000;95(3):952–8. [PubMed] [Google Scholar]
- 15.Bertolini F, Shaked Y, Mancuso P, Kerbel RS. The multifaceted circulating endothelial cell in cancer: towards marker and target identification. Nat Rev Cancer. 2006;6:835–45. doi: 10.1038/nrc1971. [DOI] [PubMed] [Google Scholar]
- 16.Brem H, Tomic-Canic M. Cellular and molecular basis of wound healing in diabetes. J Clin Invest. 2007;117(5):1219–22. doi: 10.1172/JCI32169. [DOI] [PMC free article] [PubMed] [Google Scholar]
- 17.Falanga V. Wound healing and its impairment in the diabetic foot. Lancet. 2005;366:1736–43. doi: 10.1016/S0140-6736(05)67700-8. [DOI] [PubMed] [Google Scholar]
- 18.Tung JW, Parks DR, Moore WA, Herzenberg LA, Herzenberg LA. New approaches to fluorescence compensation and visualization of FACS data. Clin Immunol. 2004;110:277–83. doi: 10.1016/j.clim.2003.11.016. [DOI] [PubMed] [Google Scholar]
- 19.Moretti S, Dabusti M, Castagnari B, Tieghi A, Ferrari L, Campioni D, Punturieri M, Dominici M, Castoldi GL, Lanza F. Comparison of single and dual platform methodologies for the estimation of CD34+ hematopoietic progenitor cells: correlation with colony assay. Int J Biol Markers. 2002;17:259–67. doi: 10.5301/jbm.2008.5044. [DOI] [PubMed] [Google Scholar]
- 20.Ku CJ, Karunarathne W, Kenyon S, Root P, Spence D. Fluorescence determination of nitric oxide production in stimulated and activated platelets. Anal Chem. 2007;79:2421–6. doi: 10.1021/ac061572q. [DOI] [PubMed] [Google Scholar]
- 21.Powell TM, Paul JD, Hill JM, Thompson M, Benjamin M, Rodrigo M, McCoy JP, Read EJ, Khuu HM, Leitman SF, Finkel T, Cannon RO., 3rd Granulocyte colony-stimulating factor mobilizes functional endothelial progenitor cells in patients with coronary artery disease. ArterThromb Vasc Biol. 2005;25:296–301. doi: 10.1161/01.ATV.0000151690.43777.e4. [DOI] [PubMed] [Google Scholar]
- 22.Thom SR, Bhopale V, Fisher D, Manevich Y, Huang PL, Buerk DG. Stimulation of nitric oxide synthase in cerebral cortex due to elevated partial pressures of oxygen: an oxidative stress response. J Neurobiol. 2002;51(2):85–100. doi: 10.1002/neu.10044. [DOI] [PubMed] [Google Scholar]
- 23.Cabigas BP, Su J, Hutchins W, Shi Y, Schaefer RB, Recinos RF, Nilakantan V, Kindwall E, Niezgoda JA, Baker JE. Hyperoxic and hyperbaric-induced cardioprotection: role of nitric oxide synthase 3. Cardiovasc Res. 2006;72(1):143–51. doi: 10.1016/j.cardiores.2006.06.031. [DOI] [PubMed] [Google Scholar]
- 24.Fadini GP, Sartore S, Albiero M, Baesso I, Murphy E, Menegolo M, Grego F, Vigili de Kreutzenberg S, Tiengo A, Agostini C, Avogaro A. Number and function of endothelial progenitor cells as a marker of severity for diabetic vasculopathy. ArterThrombVasc Biol. 2006;26:2140–6. doi: 10.1161/01.ATV.0000237750.44469.88. [DOI] [PubMed] [Google Scholar]
- 25.McClung JA, Naseer N, Saleem M, Rossi GP, Weiss MB, Abraham NG, Kappas A. Circulating endothelial cells are elevated in patients with type 2 diabetes mellitus independently of HbA1c. Diabetologia. 2005;48:345–50. doi: 10.1007/s00125-004-1647-5. [DOI] [PubMed] [Google Scholar]
- 26.Thom SR. Oxidative stress is fundamental to hyperbaric oxygen therapy. J Appl Physiol. 2009;106:988–95. doi: 10.1152/japplphysiol.91004.2008. [DOI] [PMC free article] [PubMed] [Google Scholar]
- 27.Sagrinati C, Netti G, Mazzinghi B, Lazzeri E, Liotta F, Frosali F, Ronconi E, Meini C, Gacci M, Squecco R, Carini M, Gesualdo L, Francini F, Maggi E, Annunziato F, Lasagni L, Serio M, Romagnani S, Romagnani P. Isolation and characterization of multipotent progenitor cells from the Bowman's capsule of adult human kidneys. J Am Soc Nephrol. 2006;17:2443–56. doi: 10.1681/ASN.2006010089. [DOI] [PubMed] [Google Scholar]
- 28.Ricci-Vitiani L, Lombardi D, Pilozzi E, Biffoni M, Todaro M, Peschle C, De Maria R. Identification and expansion of human colon-cancer-initiating cells. Nature. 2007;445:111–5. doi: 10.1038/nature05384. [DOI] [PubMed] [Google Scholar]
- 29.Khan M, Meduru S, Mohan I, Kuppusamy M, Wisel S, Kulkarni A, Rivera BK, Hamlin RL, Kuppusamy P. Hyperbaric oxygenation enhances transplanted cell graft and functional recovery in the infarct heart. J Mol Cell Cardiol. 2009;47:275–87. doi: 10.1016/j.yjmcc.2009.04.005. [DOI] [PMC free article] [PubMed] [Google Scholar]
- 30.Pan H, Chin C, Yang D, Ho S, Chen C, Hwang S, et al. Human amniotic fluid mesenchymal stem cells in combination with hyperbaric oxygen augment peripheral nerve regeneration. Neurochem Res. 2009;34:1304–16. doi: 10.1007/s11064-008-9910-7. [DOI] [PubMed] [Google Scholar]
- 31.Estrada E, Valacchi F, Nicora E, Brieva S, Esteve C, Echevarria L, Froud T, Bernetti K, Cayetano SM, Velazquez O, Alejandro R, Ricordi C. Combined treatment of intrapancreatic autologous bone marrow stem cells and hyperbaric oxygen in type 2 diabetes mellitus. Cell Transplant. 2008;17:1295–304. doi: 10.3727/096368908787648119. [DOI] [PubMed] [Google Scholar]
- 32.Welsh S, Bellamy W, Briehl M, Powis G. The redox protein thioredoxin-1 (Trx-1) increases hypoxia-inducible factor-1alpha protein expression: Trx-1 overexpression results in increased vascular endothelial growth factor production and enhanced tumor angiogenesis. Cancer Res. 2002;62:5089–95. [PubMed] [Google Scholar]
- 33.Milovanova T, Bhopale VM, Sorokina EM, Moore JS, Hunt TK, Velazquez OC, Thom SR. Lactate stimulates vasculogenic stem cells via the thioredoxin system and engages an autocrine activation loop involving hypoxia inducible factor-1. Mol Biol Cell. 2008;28:6248–61. doi: 10.1128/MCB.00795-08. [DOI] [PMC free article] [PubMed] [Google Scholar]
- 34.Zhang Q, Chang Q, Cox RA, Gong X, Gould LJ. Hyperbaric oxygen attenuates apoptosis and decreases inflammation in an ischemic wound model. J Invest Dermatol. 2008;128(8):2102–12. doi: 10.1038/jid.2008.53. [DOI] [PubMed] [Google Scholar]
- 35.Schroedl C, McClintock DS, Budinger GR, Chandel NS. Hypoxic but not anoxic stabilization of HIF-1alpha requires mitochondrial reactive oxygen species. Am J Physiol Lung Cell Mol Physiol. 2002;283(5):L922–31. doi: 10.1152/ajplung.00014.2002. [DOI] [PubMed] [Google Scholar]
- 36.Semenza GL. HIF-1 and mechanisms of hypoxia sensing. Curr Opin Cell Biol. 2001;13:167–71. doi: 10.1016/s0955-0674(00)00194-0. [DOI] [PubMed] [Google Scholar]
- 37.Hunt TK, Aslam RS, Beckert S, Wagner S, Ghani QP, Hussain MZ, Roy S, Sen CK. Aerobically derived lactate stimulates revascularization and tissue repair via redox mechanisms. Antioxid Redox Signal. 2007;9(8):1115–24. doi: 10.1089/ars.2007.1674. [DOI] [PMC free article] [PubMed] [Google Scholar]
- 38.Sheikh AY, Gibson JJ, Rollins MD, Hopf HW, Hussain Z, Hunt TK. Effect of hyperoxia on vascular endothelial growth factor levels in a wound model. Arch Surg. 2000;135(11):1293–7. doi: 10.1001/archsurg.135.11.1293. [DOI] [PubMed] [Google Scholar]
- 39.Catrina SB, Okamoto K, Pereira T, Brismar K, Poellinger L. Hyperglycemia regulates hypoxia-inducible factor-1a protein stability and function. Diabetes. 2004;53:3226–32. doi: 10.2337/diabetes.53.12.3226. [DOI] [PubMed] [Google Scholar]
- 40.Gao W, Ferguson G, Connell P, Walshe T, Murphy R, Birney YA, O'Brien C, Cahill PA. High glucose concentrations alter hypoxia-induced control of vascular smooth muscle cell growth via a HIF-1a dependent pathway. J Mol Cell Cardiol. 2007;42:609–19. doi: 10.1016/j.yjmcc.2006.12.006. [DOI] [PubMed] [Google Scholar]


