

Abstract
An electronic circuit was designed and constructed that can switch an r.f. signal between two amplitude levels at very fast speed (less than 10 ns). The circuit incorporates a TTL control for convenient interfacing to existing equipment. The attenuation of the more attenuated state can be adjusted to be up to 12 dB more than for the less attenuated state. The initial application was in Pulsed Electron Paramagnetic Resonance (EPR) spectroscopy to produce a π/2 – π pulse sequence with pulses of equal time duration and 6 dB difference in amplitude. A new method for measuring electron spin echoes for narrow, homogeneously-broadened lines is described.
Keywords: Excitation bandwidth, fast switching, two-pulse spin echo
INTRODUCTION
Because of hardware limitations, many pulsed EPR experiments are currently performed with the same amplitude for all pulses, and turning angles are varied by changing pulse lengths. To achieve the largest B1 at X-band, it is common to operate pulsed travelling wave tube amplifiers in the saturated region, where the output power is a maximum, and the output is independent of the input pulse power over a fairly wide range. For some experiments it is desirable to have pulses of different B1 as well as different pulse lengths (see, for example, (1–3)), which is usually achieved by having parallel pulse forming channels that can have very different level-set attenuations, as in the commercial Bruker E580 pulsed spectrometers. To create tailored (shaped) pulses, it usually is necessary to operate in a region in which the output of the amplifier is a linear function of the input power. Shaped pulses are increasingly commonly used in NMR and EPR (see, for example (1–5)). In the VHF RF range being explored for in vivo imaging (6,7), there are pulsed RF amplifiers available that are linear over a wide power range (8,9). To create shaped pulses, current technology favors using an arbitrary waveform generator, and mixing the output, if needed, with a higher frequency to perform the magnetic resonance, as cited in these papers and reviews. The input to the circuit described in this paper could be so shaped.
Provided that bandwidth is not limited by the resonator Q, the excitation bandwidth is inversely proportional to the pulse length, which means that in spin echo experiments with different pulse lengths, the excitation bandwidths are different for the two pulses. The motivation for the circuit described in this paper was to use maximum bandwidths in excitation pulses in pulsed EPR experiments. In the traditional way of producing a 2-pulse echo sequence, for example, the π/2 pulse has length t and the π pulse has length 2t. While one would like to obtain the wide bandwidth produced by the π/2 pulse, the experimental bandwidth is limited by the more selective π pulse. The solution would be to make both pulses the same length with the π pulse at 6 dB greater amplitude than the π/2 pulse. The problem with this approach has been the difficulty of switching the power level in the limited time between the two pulses. Because EPR spin-spin relaxation times typically are short, the time between pulses may be as little as 50 ns. One solution to the problem is to create two paths with different attenuations, and switch the RF between the two paths. The circuit described here overcomes this problem by providing a fast switching time, convenient TTL interface, convenient attenuation adjustment, selectable logic sense and selectable TTL termination impedance.
A limitation of either the two-path approach or the switched attenuation approach described in this paper is the pulsed RF/microwave amplifier itself. It is common, when using a traveling wave tube (TWT) amplifier, to run it in the saturated mode to maximize the output power. In such a mode one would have to empirically adjust the relative attenuation of the input to have the output pulses differ by 6 dB. It might require more than one of the circuits of the type described here to achieve enough attenuation difference. The circuit described here can be implemented for any amplifier for which the response curve is sufficiently linear that the 12 dB dynamic range is sufficient to achieve a 6 dB difference in output. Initial application has been at 250 MHz, where a Tomco BT04000 amplifier was used that has an output that is a linear function of input power up to 4kW output. This amplifier is similar to the 2 kW amplifier previously reported (10).
INSTRUMENT DESIGN
Circuit Description
The schematic diagram of the switched attenuator circuit is shown in figure 1. The TTL control signal is supplied from an external source at SMA connector J3. Jumpers JP1 and JP2 provide a means of selecting either a 50 ohm termination or a high impedance 10 kohm termination. Inverting stage U1F provides thresholding and edge sharpening. Stage U1B inverts the control signal again and jumpers JP3, JP4 and JP5 provide a means of selection of the logic sense of the control signal. Transistor stage Q1 is a level shifting stage that shifts the control voltage from the 0V, 5V voltage space to the −5V, 0V space. Stage U2A operates in the negative voltage space and provides a fast transitioning, low impedance drive to the attenuation adjustment pot R9. The adjustment pot R9 in parallel with R10 provide a very low impedance drive to the attenuator switch chip, U3. The low impedance drive is necessary to prevent the gate capacitance of U3 from slowing down the switching transitions. The SMA connectors J1 and J2 provide a bi-directional pair for the r.f. in and out. The complete specifications for the switched attenuator are shown in Table 1. This design is based around the AT-250 “Voltage Variable Absorptive Attenuator” chip manufactured by MA-COM and available from Richardson Electronics of LaFox, Illinois, USA under stock number AT-250-PIN.
Figure 1.

Circuit diagram for switched attenuator.
Table 1.
Specifications
| Parameter | Typical Value | Max | Min |
|---|---|---|---|
| r.f. power level | Linear to +12 dBm at input | +20 dBm | |
| r.f. impedance level | 50 ohms | ||
| r.f. frequency | Tested at 250 MHz | 2 GHz | DC |
| Insertion loss, minimum attenuation setting | 3 dB | 3.8 dB | |
| Attenuation setting | 0 to 12 dB, 10 turn pot adjustable (plus insertion loss) | ||
| Switching time, high to low attenuation | 4 ns | 6 ns | |
| Switching time, low to high attenuation | 8 ns | 12 ns | |
| Insertion delay, TTL to r.f. switch point | 50 ns | 70 ns | |
| TTL threshold | 1.5 V | ||
| TTL input impedance | 50 ohms or 10k ohms, jumper selectable. | ||
| TTL to attenuation logic sense | Normal or reverse, jumper selectable | ||
| Power supplies, nominal | + 5V @ 15 ma, − 5V @ 15 ma, current measured at 50% switching duty cycle | ± 25 ma | |
| Power supplies, tolerance | +0.25 V | −0.25V | |
| Power connector | 3-pin Molex, mating connector with leads supplied | ||
| r.f. and TTL connectors | (3) SMA Female | ||
| Enclosure size | 2.5″ × 1.5″ × 0.75″ plus mounting base | ||
| Series connection | Multiple units can be connected in series to achieve greater attenuation settings (at the expense of total insertion loss) |
Mechanical and packaging
The switched attenuator was designed to fit in a 2.5″ × 1.5″ × 0.75″ aluminum box. The circuit card is 2.2″ × 1.2″ and is arranged to have components soldered to both sides. Figure 2 shows the finished assembly.
Figure 2.
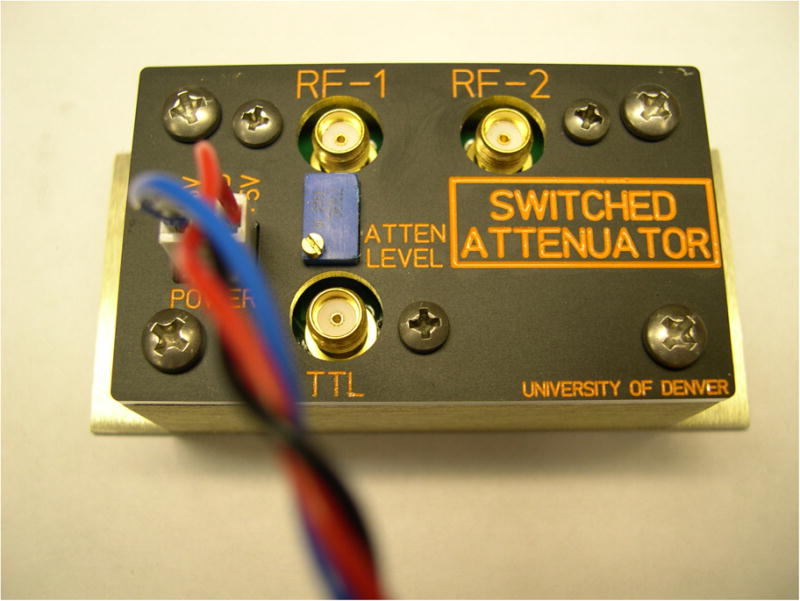
Photograph of the switched attenuator assembly.
SAMPLE APPLICATION AND RESULTS
Two pulse electron spin echo
For many EPR experiments, especially two-pulse spin echo EPR imaging, it is important to have the same bandwidth for both pulses. To test the performance of the circuit described in this paper, experimental bandwidths were compared for two cases: (1) two equal amplitude pulses with the second pulse twice as long as the first and (2) two pulses with equal length and the voltage amplitude of the second pulse twice as large as the first. Experimental results were compared with simulations.
In principle, the system bandwidth, including effects of resonator Q, excitation bandwidth, and spectral lineshape, could be characterized by measuring the free induction decay (FID) for a series of offsets from resonance in either magnetic field or frequency. However, the instrumental deadtime causes uncertainties in the Fourier transforms of the FID. Since a spin echo is approximately two back-to-back FIDs, Fourier transformation of the time trace for an echo, beginning at the peak and extending well into the baseline, is a more accurate way to define the spectrum than an FID including a deadtime.
Two-pulse spin echo experiments
Measurements were made on a locally-constructed 250 MHz EPR spectrometer (11) with a cross-loop-resonator (CLR) (12). The resonator was adjusted to have the same frequency for the excitation and detection sections of the resonator. This CLR has Q =120 for both excitation and detection resonators which corresponds to a 3 dB bandwidth of about 2 MHz. To keep the bandwidths of the rectangular pulses less than the bandwidth of the resonator, 800 and 1600 ns pulse lengths were used for case 1 and two 800 ns pulses were used for case 2. Q-spoiling was applied at the excitation resonator 50 ns after the second pulse (12). A de-oxygenated sample of lithium phthalocyanine (LiPc) with full width at half height = 50 mG was used to ensure that the narrow bandwidth of the pulses excited the full spectrum. For both cases the time between the end of the first pulse and the beginning of the second pulse was 400 ns, which is short relative to T2 ~ 2.25 μs. This relaxation time is similar to the value of 2.5 μs reported previously (13). Data acquisition was controlled with Bruker XEpr and PulseSpel software. Eight-step phase cycling was used to cancel the free induction decay (FID) after each of the pulses, imperfections in pulses, and reflections in the resonator, so that the two-pulse coherence could be detected.
Spin echoes are formed by refocusing the spin response from multiple spin packets with different resonant frequencies. The LiPc lineshape is approximately Lorentzian, with negligible inhomogeneous broadening. For extended samples a magnetic field gradient can be applied to a sample with an homogeneously broadened lineshape to introduce inhomogeneous broadening. However the spatial extent of the LiPc sample was so small that available gradients did not produce significant inhomogeneous broadening. Instead of using a gradient, the time response was recorded in quadrature at 128 evenly-spaced magnetic field positions over a range of 2.3 G (6.44 MHz). Data were stored in a 128 × 4096 point complex array. Summation of data at the same time point for each of the 128 magnetic field positions gives a 1D time dependent signal that is equivalent to the echo that would have been obtained in the presence of a magnetic field gradient over an extended sample. By inspection of this summation the time point that corresponds to the peak of the echo, techo, was determined. From the 128 × 4096 point array, data at each magnetic field starting at the time techo, and extending to the end of the time axis were selected. The resulting array was Fourier transformed with respect to the time axis. Each row in the resulting array is the EPR spectrum at the corresponding magnetic field offset. The amplitude was determined from the magnitude spectrum, which was calculated as the square root of the sum of the squares of the real and imaginary components at each frequency point. The amplitudes as a function of magnetic field offset that were obtained for the two cases are shown in Figure 4.
Figure 4.
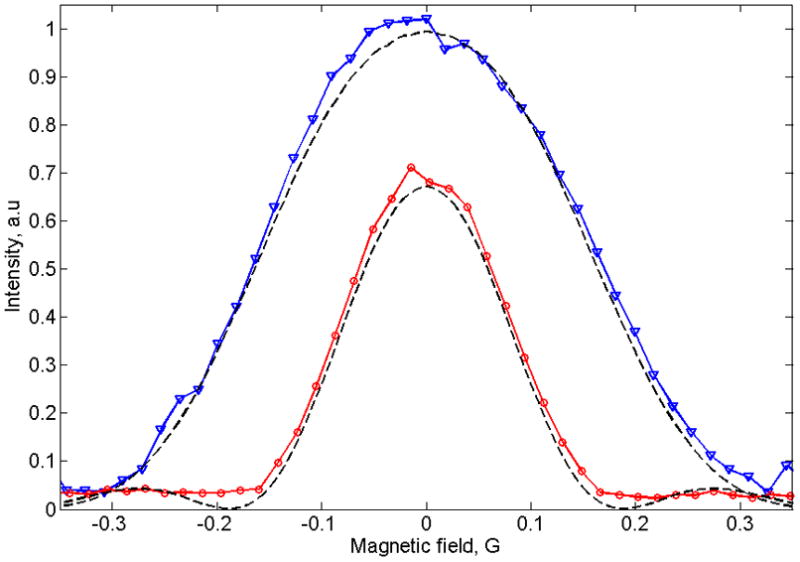
Amplitudes of EPR signals as a function of offset from resonance for equal amplitude pulses, case 1 (red circles) and for two equal length pulses, case 2 (blue triangles). Numerical simulations are shown as black dashed lines.
Simulations
Simulations were performed by numerical integration of the Bloch equations using the ode45 MatLab solver of ordinary differential equations. The equations were solved in the rotating frame at the Larmor frequency. The time domain B1 function was constructed in four steps:
A profile with two rectangular pulses was formed with pulse lengths of 800 and 1600 ns for case 1 and 800ns and 800ns lengths for case 2. The time between the end of the first pulse and the beginning of the second was 400 ns. B1 amplitudes were 1 and 1 for case 1 and 1 and 2 for case 2.
To take account of the Q of the excitation resonator, the profile was multiplied by the complex function (1−ix)/(1+x2) in the frequency domain, where x = ωQ1/(πv0), Q1 is the resonator Q value, ω is the offset, and v0 is the RF frequency. This multiplication rounds the edges of the pulses and makes them longer.
Q-spoiling after the second pulse was simulated by truncation of the elongated response pulse 50 ns after what had been the end of the square excitation pulse. The amplitudes of the B1 profiles were iteratively adjusted to ensure that the first and the second pulses turn the magnetization vector by 90° and 180°, respectively. This was done by solving the Bloch equations for various RF amplitudes at the resonance condition.
To simulate 8-step phase cycling, the phase of each pulse was altered, so that the magnetization was turned around the x, -x, y, or -y axis. The solutions to the Bloch equations for different magnetic field offsets from the resonance were calculated, echo positions found, and complex EPR signals calculated. The magnitude spectrum was calculated as the square root of the sum of the squares of the real and imaginary components at each frequency point. To take account of the effect of the detection resonator on the instrumental response function, the profile of amplitude as a function of offset was multiplied by the absolute value of the function (1−ix)/(1+x2), where x=ωQ2/(πv0), ω is the offset, and Q2 is the Q of the detection resonator.
Results of the simulations, which are shown in Fig. 4, agree well with the experimental data for both cases. The difference in intensities of the two profiles is the result of observing the echo for case 1 with 800 and 1600 ns pulses, 800 ns later than for case 2 with two 800 ns pulses. The intensity difference predicted for the two cases is approximately exp(−Δ/T2) = exp(−800/2250)=0.7, where Δ is the difference in the echo position for the two cases. The full widths at half height of the bandwidths in the simulated profiles were 0.35 and 0.18 G for the two cases, respectively. Given the good match between experiment and simulation, these values are useful estimates of the difference in the experimental bandwidths for the two cases.
These results demonstrate that for this resonator and these pulse widths, the use of equal pulse widths and adjustment of the pulse amplitude provides about a factor of 2 increase in bandwidth. The bandwidths obtained in these experiments are specific to the resonator and pulse widths. If the bandwidth were limited by resonator Q, the improvement in bandwidth by using variable amplitude pulses would be smaller.
The device has also been used in an amplifier production application to measure the 1 dB compression point of r.f. amplifiers, although this application does not require the high speed switching characteristic of the device described.
Figure 3.

Switching speed of the attenuator circuit. The transition time from high attenuation to low attenuation at 250 MHz is shown to be about 1-1/2 r.f. cycles or about 6 ns. The transition time from low attenuation to high attenuation is similar.
Acknowledgments
This work was supported by NIH NIBIB grant P41EB002034 (H. J. Halpern, PI). We thank Shane Dillon of Tomco Technologies of SA, Australia for providing the switching chips and advice, and for testing the completed device.
References
- 1.Kessler H, Mronga S, Gemmecker G. Multi-Dimensional NMR Experiments Using Selective Pulses. Magn Reson Chem. 1991;29:527–557. [Google Scholar]
- 2.Schweiger A. Pulsed Electron Spin Resonance Spectroscopy: Basic Principles, Techniques, and Examples of Applications. Angew Chem Int Ed Engl. 1991;30:265–292. [Google Scholar]
- 3.Schweiger A, Jeschke G. Principles of Pulse Electron Paramagnetic Resonance. Oxford: Oxford University Press; 2001. [Google Scholar]
- 4.Devasahayam N, Murugesan R, Matsumoto K, Mitchell JB, Cook JA, Subramanian S, Krishna MC. Tailored sinc pulses for uniform excitation and artifact-free radio frequency time-domain EPR imaging. J Magn Reson. 2004;168:110–117. doi: 10.1016/j.jmr.2004.01.016. [DOI] [PubMed] [Google Scholar]
- 5.Bernstein MA, King KF, Zhou XJ. Handbook of MRI Pulse Sequences. Burlington, MA: Elsevier Academic Press; 2004. [Google Scholar]
- 6.Eaton SS, Eaton GR, Berliner LJ, editors. Biol Magn Reson. Vol. 23. New York: Kluwer Academic/Plenum Press; 2005. Biomedical EPR - Part A: Free Radicals, Metals, Medicine, and Physiology. [Google Scholar]
- 7.Berliner LJ, editor. Biol Magn Reson. Vol. 18. New York: Kluwer Academic; 2003. In Vivo EPR (ESR): Theory and Application. [Google Scholar]
- 8.Bourg J, Krishna MC, Mitchell JB, Tschudin RG, Pohida TJ, Friauf WS, Smith PD, Metcalfe J, Harrington F, Subramanian S. Radiofrequency FT EPR spectroscopy and imaging. J Magn Reson B. 1993;102:112–115. [Google Scholar]
- 9.Quine RW, Eaton GR, Dillon S. Fast-Response VHF Pulsed 2 KW Power Amplifiers. Conc Magn Reson B (Magn Reson Engin) 2006;29B:185–190. [Google Scholar]
- 10.Quine RW, Eaton GR, Dillon S, Myer D. Fast-response VHF pulsed power amplifiers. Conc Magn Reson B (Magn Reson Engin) 2005;27B:1–7. [Google Scholar]
- 11.Quine RW, Rinard GA, Eaton SS, Eaton GR. A pulsed and continuous wave 250 MHz electron paramagnetic resonance spectrometer. Magn Reson Engineer. 2002;15:59–91. [Google Scholar]
- 12.Rinard GA, Quine RW, Eaton GR, Eaton SS. 250 MHz crossed loop resonator for pulsed electron paramagnetic resonance. Magn Reson Engineer. 2002;15:37–46. [Google Scholar]
- 13.Stoner JW, Szymanski D, Eaton SS, Quine RW, Rinard GA, Eaton GR. Direct-detected rapid-scan EPR at 250 MHz. J Magn Res. 2004;170:127–135. doi: 10.1016/j.jmr.2004.06.008. [DOI] [PubMed] [Google Scholar]