Abstract
EEG and field potential rhythms established in the cortex and thalamus may accommodate the propagation of seizures. This article describes the interaction between thalamus and cortex during pentylenetetrazol (PTZ) seizures in rats with and without prior treatment with ethosuximide (ESM), a well-known antiepileptic drug (AED) that raises the threshold for seizures, was given before PTZ. The AED was given before PTZ convulsant administration. We track this thalamo-cortical association with a novel measure we have called the cross-bicoherence gain, or BISCOH. This quantity allows us to measure the spectral coherence in a purely higher order spectralmethodology. BISCOH is able to track the formation of nonlinearities at specific frequencies in the recorded EEG. BISCOH showed a strong increase in low alpha wave harmonic generationat 10 and 12.5 Hz after ESM treatment (p < 0.02 and p < 0.007, respectively). Conventional coherence failed to show distinctive and significant changes in thalamo-cortical coupling after ESM treatment at those frequencies and instead showed changes at 5 Hz. This rise in cortical rhythms is evidence of harmonic generation or new frequency formation in the thalamo-cortical system with AED therapy. BISCOH could become a powerful tool in unraveling changes in coherence due to neuroelectric modulation resulting from drug treatment or electrical stimulation.
Keywords: Higher order spectral analysis, bicoherence, coherence, AED, ethosuximide, thalamocortical pathways anterior thalamus
1. Introduction
Anti-epileptic drugs can help us unravel some complex functional neuroanatomy through selective activation of EEG pathways and their respective generated rhythms.1 Alterations of neural rhythms can occur with the use of different anti-epileptic drug (AED) regimens. Drug therapies induce their own special effects on the EEGs of treated patients.2–5 Neuromodulatory effects occur with many drugs. An increase in EEG beta frequency effects has been known to occur with certain types of AEDs. These effects are prominently called harmonic beta effects.6
These neuromodulation effects are critical in that they can help us monitor the level of drug treatments. We will see in this article that these drug effects actually shed some light on the preferential activation of certain thalamocortical circuits. We will show that the coupling between different areas of the brain can change after administration of the AED.
Ethosuximide (ESM) is one AED known to create strong high frequency effects in cortical field potential realizations. Classic studies from the late 1970’s showed this using paired pulse electrical stimulation directly to the thalamus that evoked enhanced cortical potentials at higher frequencies under ESM.7 Mares identified two different spike-wave epilepsies by their reaction to ESM.8 Similarly thalamocortical slice preparations using both patch clamp and field potential studies studies showed that cortical burst types were altered with the addition of ESM.9
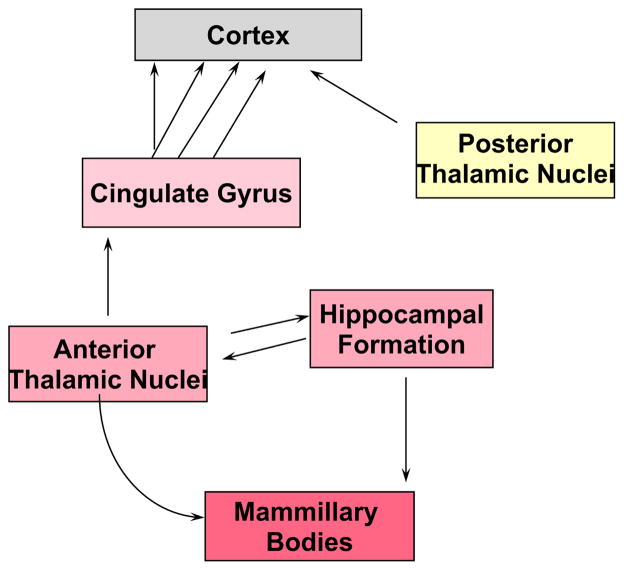
ESM was used to identify the anterior thalamus nuclei (AN) as an essential element in the pentylenetetrazol (PTZ) model of epileptic seizures using14 C-deoxyglucose autoradiography. Mirski discovered a brainstem to thalamus pathway incorporating the mammillothalamic tracts and AN. AN itself is selectively activated during threshold stages of PTZ seizures in rodents1 (Fig. 1). The experimental paradigm used ESM, (an anticonvulsant against PTZ) in conjunction with PTZ to create a stable pre-ictal period with cortical EEG bursting. This was called a threshold state.
Fig. 1.
Anterior Thalamus with its major rostral — caudal connections in the rat brain.
AN was also shown to be an important constituent of thalamocortical seizure propagation networks using EEG signal analysis as well. Using partial coherence of the EEG during PTZ seizures, we demonstrated that AN and cortex (CTX) interact strongly.10,11 Despite spectral differences, the partial coherence between cortex and AN was significantly higher than that between cortex and another thalamic target, the posterior thalamus (PT) especially at the lower frequency 1–3 Hz bands. This coherence corresponded to the propagation of the characteristic 2–3 Hz pacing rhythms of PTZ clonic seizures. Partial coherence measures pointed to AN activity imparting the observed correlation between cortex and PT at low frequencies10,11 and supported stimulation work indicating that AN could “drive” cortical and other subcortical responses. The most robust band of AN/CTX coherence was centered around the spike-wave clonic frequency of 1–3 Hz. Partial multiple coherence-analysis techniques were used to remove the possible signal contributions from two nuclei: hippocampus as well as PT. The AN/CTX coherence remained fully preserved in the low-frequency bands.
Now we turn to the bispectrally-based coherence to show that seizure coherence can be modulated by pre-treatment with an anti-convulsant. We devise a new bispectrally-based coherence method in order to measure increased nonlinear synchronization between cortex and AN after ESM.
The landmark study of the EEG and the bispectrum was the work of Huber et al.12 An early application of bispectral analysis of EEG is by Dumermuth et al. who used this technique to detect quadratic phase coupling.13 Dumermuth and Molinari present several examples of EEG with harmonic or nonlinear beta components.6 These include the mu rhythm, frontal theta or alpha activity, 14 + 6/sec positive seizure spikes, photic driving and monophasic sleep spindles in babies as well as spiky, i.e. monophasic alpha rhythm. 6,14 Barnett et al.15 studied the interaction of component waves in the EEG in awake and sleep subjects. They found significant quadratic phase coupling of the EEG components only in awake subjects with high levels of alpha wave activity. More recently, Ning et al.16 distinguished the different stages of vigilance using the bispectrum of EEG recorded from the rat hippocampus. In one recent study non-linear spectral analysis, in particular the bispectrum, was used to study interactions between the electrocerebral activity resulting from stimulation of the left and right visual fields.17 The bispectrum’s phase preservation property was used to achieve better EP reconstruction than averaging.18
Likewise the bispectrum has been used to monitor level of anesthesia and other intraoperative parameters.19–25 Sherman and Zoltowski used parametric bispectral analysis to uncover the sinusoidal nature of the human alpha rhythm.26,27 A clear and very pervasive use of the bispectrum is the BIS™ Index (Aspect Medical Systems, Framingham, MA). Currently it is used primarily in the OR for depth of anesthesia management and consciousness level maintenance.19–25
The seizure EEG contains a lot of information of high bispectral content.28 We exploit this information by creating a new coherence measure known as the BISCOH or BISpectrum-based COHerence, which directly measures changes in coherence using the bispectrum. It will differentiate between coherence changes that are due primarily to nonlinearities and those due to multiple uncorrelated inputs and noise. The advantage of this measure is that we will understand more about the coupling between two different neuronal areas than conventional coherence measures can achieve. The bispectrum has been useful for seizure detection in a number of studies.29,30 The bispectrum is useful for characterizing nonlinearities from the perspective of coupling between frequencies. Nonlinearities are also considered for seizure detection.31–34
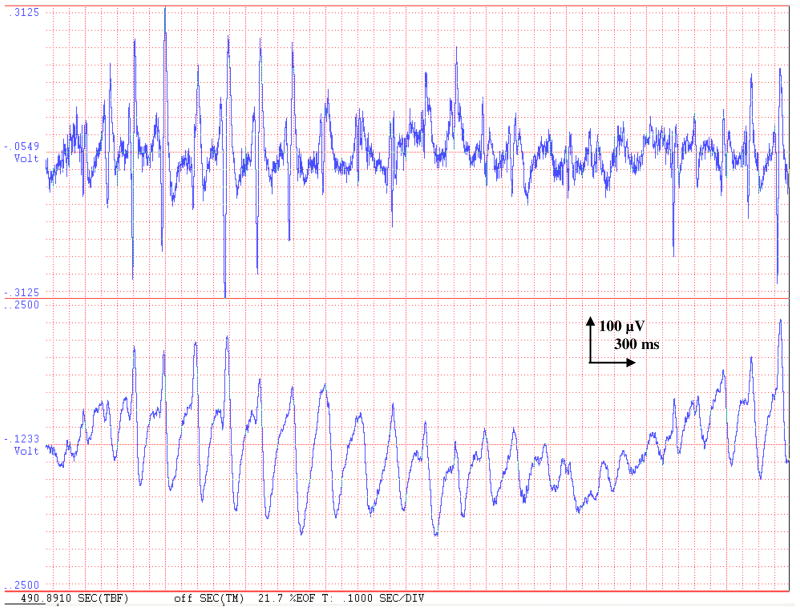
Coherence really exhibits just the linear correspondence between two different signals. Coherence processing is very important for understanding various disease states using the EEG.35,36 Nonlinearities in a channel and extraneous uncorrelated inputs cause a deterioration of coherence between two different signal sites. Previously we have shown that CTX shows strong electrical association with AN during the early portion of clonic seizures in the rat PTZ model.10 Now we are set to study the evident coherence under the use of AEDs. Modulation of this association after ESM infusion is examined by BISCOH. We need BISCOH to tackle situations where there are excessive nonlinearities in a channel. In Fig. 2 we see a comparison of ictal activity in the thalamus (bottom panel) and cortex (upper panel). Although the cortex and AN signals stay pretty much synchronized with one another, we can easily see that cortical signal is spikier and has a lot more of the higher frequency components that AN lacks.
Fig. 2.
Shows seizure activity in the frontal cortex (top trace) as well as AN (bottom trace). It is very clear that both signals are tightly coupled to one another at the repetition frequency of 5 Hz. This would generate moderate coherence between time series. A casual glance at the signals reveals that although the coherence is close to one, the cortical signal has a wider bandwidth is there is plenty of spike-wave and higher frequency component presents. These are new frequency terms that do not have a subcortical origin, but are generated locally in the cortex. This harmonic generation causes loss of coherence. Newer procedures must be used to singularly isolate the nonlinearity.
2. Methods of Coherence Estimation Through Higher Order Spectral Analysis
We wish to define the bispectrum of a signal and cross-bispectrum between two signals. We start with a simple example. Let’s assume that the frequencies of three sinusoids have an arithmetic relationship, namely f1 + f2 = f3, and
| (1) |
The frequencies are said to be harmonically related. In one case (Case I) where we have completely random phase (ϕ) sinusoids, there is no phase coupling and the bispectrum is zero. However, if the phase of each sine wave observes a similarly fixed, arithmetic relationship (Case II), there is phase coupling and the bispectrum would have a peak in the 2-D bispectral domain at the intersection of 2πf1 and 2πf2 coordinates. This example shows how three-wave coupling or a non-zero bispectrum is generated. This is shown schematically in Fig. 3. By multiplying one sine wave by another, we get two new sine waves at the sum and difference frequencies of the original sine waves. Each one of these “harmonic” frequencies is said to be phase-coupled to the original two sine waves. Then the resulting cross-bispectrum would have peaks at the sum and difference harmonic frequencies in regions ω2 > 0 and ω2 < 0, respectively.
Fig. 3.
Shows a zero and non-zero bispectral peak corresponding to the random phase (Case I) and phase locking (Case II).
Our method for coherence measurement from the bispectrum and cross-bispectrum is derived below. We will calculate a quantity called the cross-bicoherence gain or simply the bicoherence gain function. Unlike the conventional coherence function, it can generate coherences above unity. These large deviations in coherences can indicate the presence of quadratic nonlinearities as discussed before.
The bispectrum (auto-bispectrum) of a linear process, x(t) which is defined as:
| (2) |
where is the 3rd order cumulant of the input noise which is white and non-Gaussian and Hx(ω) is the frequency response function of the system that generates x(t). From Brillinger and Rosenblatt37 the bispectrum of a system with output y(t) with input x(t) and linear frequency response Hy (f) is:
| (3) |
and, correspondingly, the cross-bispectrum is represented by the following.
| (4) |
Then, the auto-bicoherence and cross-bicoherence expressions38 are respectively:
| (5a) |
and
| (5b) |
where Sxx(ω) and Syy (ω) are the respective power spectra of x(t) and y(t).
By dividing the cross-bispectrum by the bispectrum, we get an estimate of the frequency response:
| (6) |
Similarly the square of the ratio of the denominators of (5a) and (5b) yield the following as well,
| (7) |
Then the ratio of (5a) and (5b) yields the cross-bicoherence gain (2-D BISCOH or , which is similar in structure to the coherence calculated in Bendat and Piersol.39
| (8) |
Patterns in -Gains above 1.0
Values above 1.0 show gains in nonlinearities or quadratic phase couplings at specified frequency combinations. They may also indicate large noise power in the x-channel as well. Gains below 1.0: These usually indicate either noise in the output signal (at the y(t) sensor) or multiple uncorrelated input time series, xi(t), i = 1, … , N. Normally non-linear signals might also be contaminated with noise etc. that make the gains drop below 1.
Averaging along slices: Creating the 1D-BISCOH from 2D-BISCOH
We will isolate and highlight slices resulting from new frequency growth at ω3. By such an EEG analysis we see an intense growth in frequency couplings as seen earlier in Fig. 3. If we sum or project along similar lines with the same slope and then average, we arrive at the 1-D BISCOH. To arrive at the expression for the 1-D BISCOH we sum up along slices in cross bispectral domain such that ω3 = ω = −ω1 + ω2 = constant. Our summation results in a new coherence estimator culled from slices of the bispectrum ω3 = ω = −ω1 + ω2 or
| (9) |
where Nω is the number of bispectral estimates in the particular slice.
3. Experimental Study — Alteration of Anterior Thalamic-Cortex BISCOH with ESM Treatment
We implanted cortical screw and unilateral AN, PT and hippocampal depth electrodes in N = 8 (4 experimental; 4 control) rats. In day 2, baseline field potential recordings were recorded after jugular catheterization. Initially, a 100 mg/kg bolus dose of intravenous AED ESM is given for the experimental group. After 15 min, slow PTZ infusion at a rate of 5.5 mg/kg/min through the cannula begins and we see a steady growth of bursting events in the EEG which culminate in a seizure. Coherence processing of the EEG was performed through BISCOH with projections (slice averages) as described above. 1D-BISCOHs created from 2D-BISCOHs by averaging along slices of the bispectrum.
The research protocol was approved by the Johns Hopkins Medical Institutional Review Board Committee for laboratory investigation. Male Sprague-Dawley rats (n = 8, 250–300 gm) were anesthetized with a 1–2% halogen in oxygen mixture and placed on a Kopf stereotaxic frame. Continued anesthesia was delivered via a nose cone supplying the anesthetic gas. The scalp was sagittally incised and 1% lidocaine was applied to wound margins using a 30 G infiltrating needle. Four skull screw EEG electrodes were placed bifrontally and posteriorly behind bregma. A dental drill with a 2 mm bit was used for penetration through the skull for depth electrode placement. Bipolar insulated steel electrodes (0.125 mm dia., 2 mm tip separation) were placed in AN and PT. Three animals had additional depth electrodes placed in hippocampus (HPC). Coordinates for placement of AN and PT electrodes were derived from a stereotactic atlas (Paxino/Watson): AN −1.5 mm posterior to bregma (−1.5B), 1.5 mm lateral to midline (1.5L) and 6.0 mm ventral to cortical surface (6.0V); PT −4.3 mm B, 1.5 mm L and 6.0 mm V; HPC−4.5 mm B, 4.0 mm L and 2.6 mm V. Depth electrodes (.25 mm polyimide insulated stainless steel twisted pairs) were attached to a cortical pedestal (Plastic Products) and together with surface EEG electrodes secured to the skull with Durelon powder cement.
Animals were allowed to recover for two days with ad lib food and water. The animals were briefly re-anesthetized for placement of a jugular venous catheter, and recovered for a minimum of 1 hr. Baseline EEG was recorded for at least 60 sec prior to the infusion of PTZ (100 mg/ml, Sigma Chemical, St. Louis), administered at 5.5 mg/kg/min. Behavior and EEGs were both continuously monitored and the extent of seizure stages as noted according to the modified clinical Racine scale40: 0- no seizure; 1- oral facial twitch; 2- head bob; 3- myoclonic jerk, 4- fore-limb clonus; 5- rearing clonic; 6- rearing and falling clonic with forelimb clonus. All the animals passed through stages Racine values from 0 to 6.
Analog EEG data were amplified with a Grass model 8D-10 8-channel portable polygraph with internal 0.3 Hz high-pass and 70 Hz low-pass filter cutoffs. A 60 Hz notch was also employed. Baseline analog EEG recordings and those from the first tonic-clonic seizure exhibited by each animal were collected using a 7 channel FM data recorder (TEAC MR-30). Artifact-free, 8 second signal epochs were extracted from each period, with the seizure period consisting of cortical spike-wave activity with a sustained rate of 2 Hz or greater. This epoch length was selected so that the estimated spectral values have high frequency resolution. The data were subsequently digitized utilizing CODAS (DATAQ Instruments Inc., Akron, OH) at a sampling rate of 1000 Hz. Subsequent digital analysis was performed on signals low pass filtered with a FIR filter with 100 Hz cutoff and decimation-in-time by a factor of 4 resulting in a sampling rate of 250 Hz. Histological follow-up using hematoxylineosin staining per animal confirmed the position of the electrodes.
4. Results
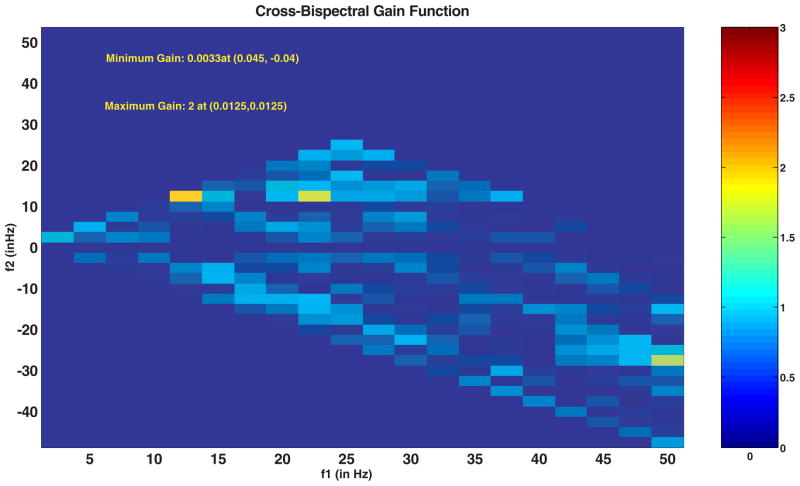
Our method for measurement of coherence from the bispectrum is useful to detect the particular frequencies contributing to the nonlinearities in recorded signals. These nonlinearities are generated from the combination of frequencies in the signals recorded from AN (input) and in the CTX (output). We calculate the 2-D bispectrally-based coherence or 2-D BIS-COH based primarily on (7). This function is shown for an 8 second AN-CTX epoch at 1000 Hz sampling rate in Fig. 4. We used an eight second window to achieve a compromise between the need for averaging multiple epochs in the bispectrum and the stationarity of the alpha wave.16,41 This is much longer than the epoch length (under 3 sec) used in Chua29 for seizure detection. The frequency resolution of BISCOH is 2.5 Hz meaning that there are twenty-400 pt epochs together to generate the BISCOH estimate. A typical 2-D BISCOH in this case is shown in Fig. 4. Quantities above 1.0 (out of the blue portion of the legend spectrum) show large gains in nonlinearties or frequency couplings at specified frequency combinations. One large frequency coupling occurs at (f1, f2) = (12.5, 12.5 Hz) or the sum frequency of 25 Hz. The other is at (f1, f2) = (20, 12.5 Hz) or summing to 32.5 Hz. The cross-bispectrum does not have all of the symmetries that the auto-bispectrum does. For instance, in the cross-bispectrum all of the points below the f2 = 0 axis, correspond to the difference frequency synthesis. The correspondence here would be f3 = −f1 − f2. This is a different interpretation of “negative frequency.”
Fig. 4.
Shows a typical cross-bicoherence gain function or 2D BISCOH function of ictal signals recorded for AN and CTX. The color bar shows the level of nonlinearities with signals greater than one have a deliberate gain in nonlinearities from input to output. Noise or other uncorrelated signals contribute to gains less than one (blue zone).
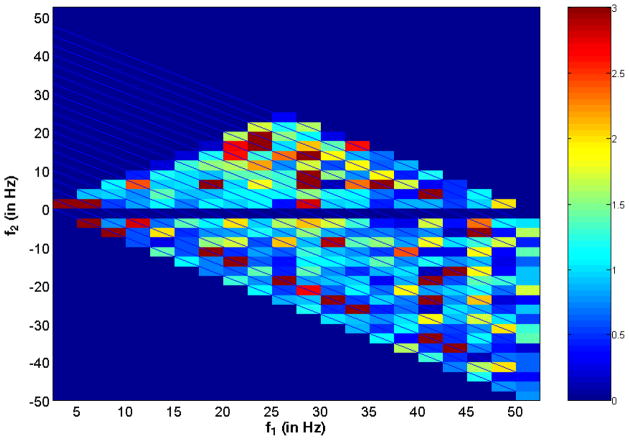
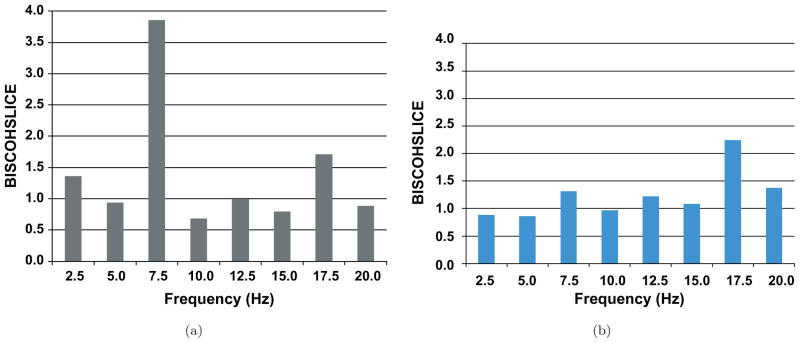
In Fig. 5 we show the process of generating a 1-D BISCOH from a 2-D BISCOH taken from a different animal. The BISCOH is taken between AN and CTX. Through the use of several affine slices, we are able to capture constituent frequencies f1 + f2 that sum to a resultant frequency, f3. If we sum or project along all lines with the same slope and then average along those slices, we arrive at the 1-D BISCOH. After taking all of the slices shown in Fig. 5, we generate a resultant sample 1-D BISCOH is shown in Fig. 6(a) over different (f3 = constant) lines. We see an intense growth in nonlinearities along this line at frequency f3 = 7.5 Hz. We see along the spectrum all the way to 50 Hz that there are various frequency components exhibiting strong nonlinearities. The maximum appears to be at 7.5 Hz. Other high frequency components also experience growth or harmonic generation studying cortex. Low frequencies, 15 Hz and below, show deficits in coherence.
Fig. 5.
Shows the process of taking affine slices that intersect frequencies on the f1 = 0 axis. The intercept of each slice is the resultant or summative frequency. We average BISCOH values along all of the slices shown to produce the 1-D BISCOH. This is taken from a different animal than the animal showcased in Fig.
Fig. 6.
(a) Shows the sample 1D-BISCOH or the bispectrally-derived coherence resulting from summing or taking projections along diagonal slices of the 2D-BISCOH in Fig. 5. All slices have same slope as the sample white lines in Fig. 3 summing to frequencies that these line intersects on the f1 = 0 axis. As we can see the 7.5 Hz component in cortex is strongly coupled in a nonlinearly sense to AN. It has an average gain of greater than 3.5. Other high frequency components at 18 Hz and above also exhibit strong nonlinear couplings of varying strengths. Frequencies components 15 Hz and below have BISCOHs below one which usually mean that noise or uncorrelated sinusoids at the output are the sources of low coherence with cortex. Frequency generation from thalamus to cortex is typically seen in theta and high beta and gamma bands. (b) Shows a similar 1D-BISCOH plot taken for hippocampus-to-CTX.
In the accompanying Fig. 6(b) we show a similar 1-D BISCOH summation for the hippocampus to cortex. This figure was generated from data taken at the same time as the anterior thalamus to cortex BISCOH plots above. This figure shows a different configuration of nonlinear coherences than the AN especially as the BISCOH value is elevated for 17.5 Hz.
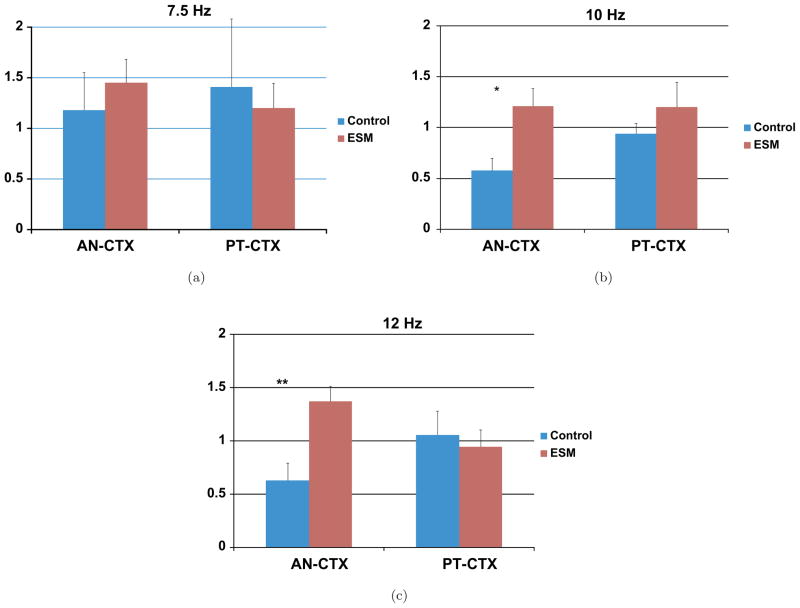
For the entire cohort we see that ESM causes a significant rise in seizure threshold. Time-to-clonic was 738 vs. 1219 seconds for the control and experimental groups, respectively. Statistical significance was reached for both uni- and multi-variate tests of BISCOH at two alpha rhythm frequencies at 10 and 12.5 Hz. Simple t-tests show growth in AN-CTX 2-D BISCOH at p < 0.02 and p < 0.007 levels for the 10 and 12.5 Hz, respectively. Repeated Measures ANOVA coupled with Bonferroni and Scheffe measures show differences at each frequency at the p < 0.05 level. A table listing the complete rundown of statistics for the AN-CTX treatment is shown in Table 1. In Figs. 7(a)–7(c) we show individual frequency plots for 7.5, 10 and 12.5 Hz, respectively for different electrode BISCOH pairs and treatments. There is a growth in nonlinearities for the AN-CTX coherence through 1-D BISCOH after pre-treatment with ESM. No such growth occurs for PT-CTX coherence.
Table 1.
Statistical results table: ESM treatment effects: an-ctx coherence.
| Frequency component | BISCOH RESULTS | Ordinary coherence: univariate results | ||
|---|---|---|---|---|
| Univariate | Multivariate comparison interval |
|||
| Bonferroni | Scheffe | |||
| 5 Hz | 0.388 | NA | NA | 0.017 |
| 7.5 Hz | 0.278 | NA | NA | 0.427 |
| 10 Hz | 0.013 | 0.05 | 0.05 | 0.838 |
| 12 Hz | 0.006 | 0.05 | 0.05 | 0.114 |
Fig. 7.
Shows plots of averaged AN-CTX and PT-CTX 1D-BISCOH for 4 control and 4 ESM-treated animals for different frequencies showing increases in nonlinearities at the frequencies, 7.5, 10 and 12.5 Hz. Data was taken first 8 seconds of initial ictal episode. The solid color bars represent saline controls whereas vertical and horizontal plots represent ESM-treated AN-CTX and PT-CTX BISCOH sums, respectively. There is a significant change in AN-CTX 2D-BISCOH when treated with anti-epileptic drug. A growth in non-linearity accompanies the addition of the drug. Significant growth in nonlinearities occurs with the addition of this AED. The growth in nonlinearities is evident particularly around the alpha band frequency band. At 10 and 12.5 Hz there is a great rise in BISCOH.
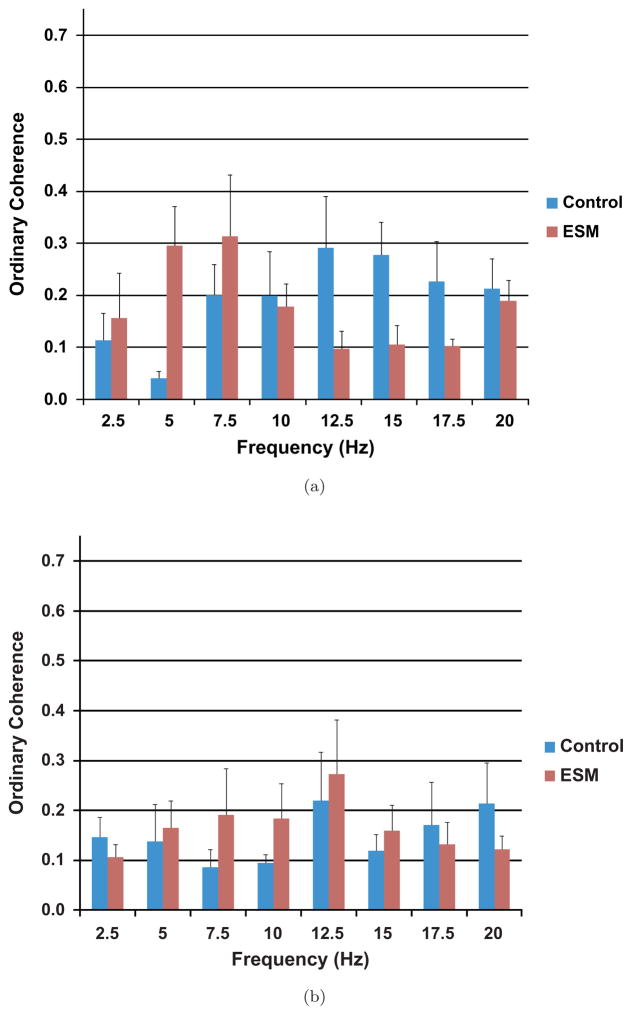
In normal coherence processing a growth in nonlinearities would have resulted in a reduction in coherence — the most often used measure of interchannel synchrony. Traditional coherence processing lumps nonlinearities, extraneous noise and multiple inputs together with an identical loss in coherence. We show the performance of traditional coherence in Fig. 8. In Fig. 8 we see that there is also an increase in coherence after administration of the ESM. This is not a significant increase except at 5 Hz which, however, is not among the frequencies found to be significant from the 1-D BISCOH calculations. It is true that our BISCH desynchronization results in a coherence loss at 5 Hz in both AN and CTX. However, BISCOH shows that there is a higher level of synchrony established at new frequencies that are arithmetically related to one another. Therefore this shows new harmonics being generated in the cortex at these alpha frequencies with the addition of ESM. This parallels the evidence of the enhancement of thalamocortical rhythms in slice preparations recorded in the presence of ESM.9
Fig. 8.
(a) Shows plots of the conventional coherence for untreated animals and ESM-treated animals. There are no significant differences between the treated and untreated AN-CTX coherences except at 5 Hz. The frequencies showing significant differences for the 1-D BISCOH do not have similar responses for the conventional or ordinary coherence. (b) Shows a similar profile for PT to CTX coherences for control and ESM-treated animals.
5. Conclusions
We have provided evidence for the preferential association of cortex with anterior thalamus in the past. There has been evidence for the modulation of brain rhythms with addition of AEDs. In this study we have shown that there is definitely coherence new frequencies in the cortex after AED injection to raise seizure threshold and delay seizure onset.
The above conjectures are supported by the use of a novel measure of coherence (BISCOH) that employs the bispectrum. Unlike the conventional coherence this method detects nonlinear interactions between frequencies in a signal that may be produced and does not simply illustrate lack of fit to linear modeling of conventional coherence function.42
In the traditional sense, we would call this phenomenon of lowered values of conventional coherence, “desynchronization.” Yet with BISCOH we see an increase in synchrony between two channels. This increase comes from nonlinearities being generated in the alpha frequency range. These are new challenges for coherence methods.
References
- 1.Mirski MA, Ferrendelli JA. Selective metabolic activation of the mamillary bodies and their connections during ethosuximide-induced suppression of pentylenetetrazol seizures. Epilepsia. 1985;51:194–203. doi: 10.1111/j.1528-1157.1986.tb03528.x. [DOI] [PubMed] [Google Scholar]
- 2.Frost JD, Jr, Kellaway P, Hrachovy RA, Glaze DG, Mizrahi EM. Changes in epileptic spike configuration associated with attainment of seizure control. Ann Neurol. 1986;20:723–726. doi: 10.1002/ana.410200612. [DOI] [PubMed] [Google Scholar]
- 3.Kellaway P, Frost JD, Jr, Crawley JW. Time modulation of spike-and-wave activity in generalized epilepsy. Ann Neurol. 1980;8:491–500. doi: 10.1002/ana.410080506. [DOI] [PubMed] [Google Scholar]
- 4.Hrachovy RA, Frost JD, Jr, Kellaway P, Zion T. A controlled study of prednisone therapy in infantile spasms. Epilepsia. 1979;20:403–407. doi: 10.1111/j.1528-1157.1979.tb04820.x. [DOI] [PubMed] [Google Scholar]
- 5.Frost JD, Jr, Carrie JR, Borda RP, Kellaway P. The effects of dalmane (flurazepam hydrochloride) on human EEG characteristics. Electroencephalogr Clin Neurophysiol. 1973;34:171–175. doi: 10.1016/0013-4694(73)90044-8. [DOI] [PubMed] [Google Scholar]
- 6.Dumermuth G, Gasser T, Hecker A, Herdan M, Lange B. Exploration of EEG components in the beta frequency range. In: Kellaway P, Petersen I, editors. Quantitative Analytic Studies in Epilepsy. New York: Raven; 1976. pp. 533–558. [Google Scholar]
- 7.Nowack WJ, Johnson RN, Englander RN, Hanna GR. Effects of valproate and ethosuximide on thalamocortical excitability. Neurology. 1979;29:96–99. doi: 10.1212/wnl.29.1.96. [DOI] [PubMed] [Google Scholar]
- 8.Mares P, Kubova H, Mockova M. Two models of epileptic spike-and-wave rhythm in rats are differently influenced by ethosuximide. Physiol Res. 1997;46:397–402. [PubMed] [Google Scholar]
- 9.Zhang YF, Gibbs JW, Coulter DA. Anticonvulsant drug effects on spontaneous thalamo-cortical rhythms in vitro: Ethosuximide, trimethadione, and dimethadione. Epilepsy Res. 1996;23:15–36. doi: 10.1016/0920-1211(95)00079-8. [DOI] [PubMed] [Google Scholar]
- 10.Mirski MA, Tsai YC, Rossell LA, Thakor NV, Sherman DL. Anterior thalamic mediation of experimental seizures: Selective EEG spectral coherence. Epilepsia. 2003;44:355–365. doi: 10.1046/j.1528-1157.2003.33502.x. [DOI] [PubMed] [Google Scholar]
- 11.Sherman D, Tsai YC, Rossell LA, Mirski MA, Thakor NV. Spectral analysis of a thalamus-to-cortex seizure pathway. IEEE Trans BME. 1997;44:657–663. doi: 10.1109/10.605422. [DOI] [PubMed] [Google Scholar]
- 12.Huber PJ, Kleiner B, Gasser T, Dumermuth G. Statistical methods for investigating phase relations in stationary stochastic processes. IEEE Trans Audio Elec AU-19. 1971:78–86. [Google Scholar]
- 13.Dumermuth G, Huber PJ, Kleiner B, Gasser T. Analysis of the interrelations between frequency bands of the EEG by means of the bispectrum: A preliminary study. Electroenceph Clin Neurophysiol. 1971;31:137–148. doi: 10.1016/0013-4694(71)90183-0. [DOI] [PubMed] [Google Scholar]
- 14.Dumermuth G, Molinari L. Spectral analysis of EEG background activity. In: Gevins A, Remond A, editors. Methods of Analysis of Brain Electrical and Magnetic Signals: EEG Handbook. New York: Elseview Science Publishers; 1987. [Google Scholar]
- 15.Barnett TP, Johnson LC, Naitoh P, Hicks N, Nute C. Bispectrum analysis of the electroencephalogram during waking and sleeping. Science. 1971;172:401–403. doi: 10.1126/science.172.3981.401. [DOI] [PubMed] [Google Scholar]
- 16.Ning T, Bronzino JD. Nonlinear analysis of the hippocampal subfields of CA1 and the dentate gyrus. IEEE Trans Biomed Eng. 1993;40:870–876. doi: 10.1109/10.245607. [DOI] [PubMed] [Google Scholar]
- 17.Shils JL, Litt M, Skolnick BE, Stecker MM. Bispectral analysis of visual interactions in humans. Electroencephalogr Clin Neurophysiol. 1996;98:113–125. doi: 10.1016/0013-4694(95)00230-8. [DOI] [PubMed] [Google Scholar]
- 18.Nakamura M. Waveform and latency estimation from neuroelectric signals using the bispectrum. Methods Inf Med. 1994;33:32–34. [PubMed] [Google Scholar]
- 19.Sebel PS, Lang E, Rampil IJ, et al. A multicenter study of bispectral electroencephalogram analysis for monitoring anesthetic effect. Anesth Analg. 1997;84:891–899. doi: 10.1097/00000539-199704000-00035. [DOI] [PubMed] [Google Scholar]
- 20.Glass PS, Bloom M, Kearse L, Rosow C, Sebel P, Manberg P. Bispectral analysis measures sedation and memory effects of propofol, midazolam, isoflurane, and alfentanil in healthy volunteers. Anesthesiology. 1997;86:836–847. doi: 10.1097/00000542-199704000-00014. [DOI] [PubMed] [Google Scholar]
- 21.Sebel PS, Bowles SM, Saini V, Chamoun N. EEG bispectrum predicts movement during thiopental/isoflurane anesthesia. J Clin Monit. 1995;11:83–91. doi: 10.1007/BF01617729. [DOI] [PubMed] [Google Scholar]
- 22.Bannister CF, Brosius KK, Sigl JC, Meyer BJ, Sebel PS. The effect of bispectral index monitoring on anesthetic use and recovery in children anesthetized with sevoflurane in nitrous oxide. Anesth Analg. 2001;92:877–881. doi: 10.1097/00000539-200104000-00015. [DOI] [PubMed] [Google Scholar]
- 23.Kearse LA, Jr, Manberg P, DeBros F, Chamoun N, Sinai V. Bispectral analysis of the electroencephalogram during induction of anesthesia may predict hemodynamic responses to laryngoscopy and intubation. Electroencephalogr Clin Neurophysiol. 1994;90:194–200. doi: 10.1016/0013-4694(94)90091-4. [DOI] [PubMed] [Google Scholar]
- 24.Kearse LA, Jr, Manberg P, Chamoun N, deBros F, Zaslavsky A. Bispectral analysis of the electroencephalogram correlates with patient movement to skin incision during propofol/nitrous oxide anesthesia. Anesthesiology. 1994;81:1365–1370. doi: 10.1097/00000542-199412000-00010. [DOI] [PubMed] [Google Scholar]
- 25.Kearse LA, Jr, Rosow C, Zaslavsky A, Connors P, Dershwitz M, Denman W. Bispectral analysis of the electroencephalogram predicts conscious processing of information during propofol sedation and hypnosis. Anesthesiology. 1998;88:25–34. doi: 10.1097/00000542-199801000-00007. [DOI] [PubMed] [Google Scholar]
- 26.Sherman DL, Zoltowski MD. Matrix-based higher order spectral for three-wave coupling processes. IEEE Trans Signal Processing. 1994;42:332–48. [Google Scholar]
- 27.Sherman DL, Zoltowski MD. Decomposing the alpha rhythms: Comparative performance evaluation of parametric bispectral algorithms for EEG. Conference Proceedings IEEE Sixth SP Workshop on Statistical Signal and Array Processing; 1992. pp. 522–525. [Google Scholar]
- 28.Al-Nashash H, Sabesan S, Krishnan B, et al. Single channel EEG analysis. In: Tong S, Thakor NV, editors. Quantitative EEG Analysis Methods and Clinical Applications. Norwood, MA: Artech House; 2009. pp. 51–107. [Google Scholar]
- 29.Chua KC, Chandran V, Acharya R, Lim CM. Automatic identification of epilepsy by HOS and power spectrum parameters using EEG signals: A comparative study. Conf Proc IEEE Eng Med Biol Soc. 2008;2008:3824–3827. doi: 10.1109/IEMBS.2008.4650043. [DOI] [PubMed] [Google Scholar]
- 30.Sartorius A, Schmahl C. Bispectral index monitoring during dissociative pseudo-seizure. World J Biol Psychiatry. 2009;10:603–605. doi: 10.1080/15622970701530933. [DOI] [PubMed] [Google Scholar]
- 31.Adeli H, Ghosh-Dastidar S, Dadmehr N. A wavelet-chaos methodology for analysis of EEGs and EEG subbands to detect seizure and epilepsy. IEEE Trans Biomed Eng. 2007;54:205–211. doi: 10.1109/TBME.2006.886855. [DOI] [PubMed] [Google Scholar]
- 32.Ghosh-Dastidar S, Adeli H. A new supervised learning algorithm for multiple spiking neural networks with application in epilepsy and seizure detection. Neural Netw. 2009;22:1419–1431. doi: 10.1016/j.neunet.2009.04.003. [DOI] [PubMed] [Google Scholar]
- 33.Iasemidis LD, Olson LD, Savit RS, Sackellares JC. Time dependencies in the occurrences of epileptic seizures. Epilepsy Res. 1994;17:81–94. doi: 10.1016/0920-1211(94)90081-7. [DOI] [PubMed] [Google Scholar]
- 34.Iasemidis LD, Sackellares JC, Zaveri HP, Williams WJ. Phase space topography and the Lyapunov exponent of electrocorticograms in partial seizures. Brain Topography. 1990;2:187–201. doi: 10.1007/BF01140588. [DOI] [PubMed] [Google Scholar]
- 35.Sankari Z, Adeli H. Intrahemispheric, interhemispheric, and distal EEG coherence in Alzheimer’s disease. Clin Neurophysiol. doi: 10.1016/j.clinph.2010.09.008. [Epub ahead of publication] [DOI] [PubMed] [Google Scholar]
- 36.Sankari Z, Adeli H. Probabilistic neural networks for EEG-based diagnosis of Alzheimer’s disease using conventional and wavelet coherence. J Neursci Meth. 2011 doi: 10.1016/j.jneumeth.2011.01.027. in press. [DOI] [PubMed] [Google Scholar]
- 37.Brillinger DR, Rosenblatt M. Computation and Interpretation of kth-Order Spectra. In: Harris B, editor. Spectral Analysis of Time Series. New York: Wiley; 1967. pp. 189–232. [Google Scholar]
- 38.Nikias CL, Petropulu A. Higher Order Spectral Analysis: A Nonlinear Signal Processing Framework. Englewood Cliffs, NJ: Prentice-Hall; 1993. [Google Scholar]
- 39.Bendat JS, Piersol AG. Random Data: Analysis and Measurement Procedures. New York: John Wiley & Sons; 1986. [Google Scholar]
- 40.Racine RJ. Modification of seizure activity by electrical stimulation; motor seizures. Electroencehphalogr Clin Neurophsyiol. 1972;32:281. doi: 10.1016/0013-4694(72)90177-0. [DOI] [PubMed] [Google Scholar]
- 41.Raghuveer MR. Time-domain approaches to quadratic phase coupling estimation. IEEE Trans Auto Control. 1990;AC-35:48–56. [Google Scholar]
- 42.Cadzow JA, Solomon OM. Linear modelling and the coherence function. IEEE Trans Acoust Speech Signal Processing ASSP-35. 1987:19–28. [Google Scholar]


