

Abstract
Oxidative stress was previously implicated in regulation of ceramide metabolism. Here, its effects on dihydroceramide desaturase were investigated. To stimulate oxidative stress HEK293, MCF7, A549, and SMS-KCNR cells were treated with hydrogen peroxide, menadione, or tert-butylhydroperoxide. In all cell lines, an increase in dihydroceramide was observed upon oxidative stress as measured by LC/MS. In contrast, total ceramide levels were relatively unchanged. Mechanistically, dihydroceramide desaturase activity was measured by an in-situ assay and was decreased in a time- and dose-dependent fashion. Interestingly, no detectable changes in the protein levels were observed, suggesting that oxidative stress does not induce degradation of dihydroceramide desaturase. In summary, oxidative stress leads to potent inhibition of dihydroceramide desaturase resulting in significant elevation in dihydroceramide levels in vivo.
Keywords: oxidative stress, ceramide, sphingolipids
INTRODUCTION
Sphingolipids comprise a group of cellular lipids with important regulatory functions [1]. Different species of sphingolipids have been implicated in a variety of cellular processes. Two well known bioactive sphingolipids, ceramide and sphingosine 1-phosphate have been shown to be involved in regulation of proliferation, differentiation, angiogenesis, senescence, and apoptosis [2, 3]. Generation of different bioactive sphingolipids results from either de-novo synthesis or break down of complex sphingolipids [4]. Due to their signaling properties, maintaining cellular homeostasis requires tight control of sphingolipid levels in the cell.
Dihydroceramide desaturase facilitates the last step of de-novo ceramide synthesis, i.e., addition of the 4,5-trans-double bond to the sphingoid backbone of dihydroceramide. Enzymatic activity of dihydroceramide desaturase has been described using rat liver microsomes [5, 6], and the gene encoding the enzyme (DEGS-1) was identified by Ternes et al [7]. Dihydroceramide desaturase belongs to the desaturase/hydroxylase family of enzymes characterized by the presence of conserved histidine motifs in the active site [8, 9] and appears to be the main ceramide desaturase in human cells [10].
Dihydroceramide is thought to be an inactive precursor of the well-known bioactive sphingolipid ceramide, especially in the regulation of apoptosis. Nevertheless, it was shown recently that accumulation of dihydroceramide after downregulation of DEGS-1 leads to cell cycle arrest [10]. Furthermore, dihydroceramide inhibits ceramide channel formation [11] and induces autophagy [12, 13]. In addition, γ-Tocopherol (vitamin E available from diet) was shown to inhibit prostate and lung cancer cells proliferation, through mechanism involving dihydroceramide and dihydrosphingosine accumulation [14]. Among chemopreventive agents, recent data described that the synthetic retinoid fenretinide N-(4-hydroxyphenyl)-retinamide (4-HPR) induces accumulation of dihydroceramide in cells [10]. Furthermore, 4-HPR has been shown to induce dose/time dependent cell cycle arrest, autophagy and/or apoptotic cell death in several cancer cell lines. In addition, reactive oxygen species (ROS) have been suggested to be involved in 4-HPR-mediated effects [15–19]. ROS (or redox environment) have also been suggested to play a “second messenger” role in cell cycle regulation [20–22]. These results suggested the possibility that ROS may modulate the activity of dihydroceramide desaturase.
Since dihydroceramide desaturase is a key enzyme regulating ceramide vs. dihydroceramide availability in the cell, understanding how its activity can be regulated is of high importance. Here we show that hydrogen peroxide and tert-butylhydroperoxide, as well as the intracellular ROS-inducer, menadione (2-methyl-1,4-naphtoquinone), were able to effectively inhibit dihydroceramide desaturase activity.
MATERIALS AND METHODS
Materials
Minimal Essential Medium (MEM), RPMI 1640, and Dulbecco’s Modified Eagle Medium (DMEM) were from GIBCO/Invitrogen (Carlsbad, CA). Red phenol free RPMI 1640 (L-Glutamine free) and L-Glutamine were from Sigma (St. Louis, MO). The HEK293, MCF-7, and A549 cell lines were purchased from American Tissue Culture Collection (Manassas, VA). The SMS-KCNR cell line was obtained from Dr. C. Pat Reynolds (Texas Tech University, Amarilo, TX). D-erythro-2-N-[12′-(1″-Pyridinium)dodecanoyl]-sphingosine bromide (D-erythro-C12-ceramide; C12-CCPS) and D-erythro-2-N-[12′-(1″-pyridinium)dodecanoyl]-4,5-dihydrosphingosine bromide (D-erythro-C12-dihydroceramide; C12-dhCCPS) were synthesized and kindly provided by the Lipidomics Core Facility of the Medical University of South Carolina [23]. Anti-DEGS-1 antibody (MLD 3906) was a generous gift from Dr. Gordon N. Gill (University of California, San Diego). CM-H2DCFDA (#C6827) and CellTracker Green CMFDA (#C7025) were from Molecular Probes (Eugene, OR). Menadione, hydrogen peroxide, tert-butylhydroperoxide, and all other chemicals were from Sigma (St. Louis, MO). The radio-labeled substrate, N-Octanoyl-[4,5-3H]-D-erythro-dihydrosphingosine, was purchased from American radiolabeled chemicals (St. Louis, MO). The unlabeled substrate, N-Octanoyl-D-erythro-dihydrosphingosine and Cyclopropenylceramide (C8-CPPC) was purchased from Matreya, LLC (Pleasant Gap, PA)
Cell Culture
HEK293 (Human Embryonic Kidney) cells were maintained in MEM supplemented with 10% (v/v) fetal bovine serum (FBS) in a 5% CO2 incubator at 37 C. Cells were passaged every 3–4 days to maintain logarithmic growth. MCF-7 (Human Breast Adenocarcinoma) and SMS-KCNR (Human Neuroblastoma) cells were maintained in 1640 RPMI, while A549 (Human Lung Carcinoma) cells were maintained in DMEM supplemented with 10% (v/v) FBS and cultured as above.
Treatments
All solutions were freshly prepared for each experiment. Hydrogen peroxide and tert-butylhydroperoxide stock solutions were diluted in culture medium whereas menadione was first dissolved in ethanol and then in culture medium
In Situ Dihydroceramide Desaturase Assay
This assay has been described previously. Briefly, cells were incubated with 500nM C12-dhCCPS for 1h followed by treatment with menadione, hydrogen peroxide or tert-butylhydroperoxide for the indicated times. Cells were collected on ice, washed with PBS, lipids were extracted, and levels of C12-dhCCPS and its product (C12-CCPS) were detected by LC/MS as described previously [10].
In Vitro Dihydroceramide Desaturase Assay
Assay was performed as described by Rahmaniyan et al. (manuscript in preparation). Briefly, SMS-KCNR cells were grown in T-150 flasks with a density of 3 millions/flask. Experiments were performed at about 85% confluence. Cells were treated with 200 M of peroxide for 1 hour and 2.5 M of C8CPPC for 4hrs. The medium was removed and flasks were washed twice with ice-cold PBS. Cells were scraped and centrifuged at 1000×g. Total cell homogenate was prepared from the pellet as described [24]. Briefly the pellet was resuspended in homogenization buffer (50mM sucrose, 5mM HEPES, pH 7.4) and kept on ice for 10 minutes. Then, the suspension was homogenized employing a 1ml insulin syringe using 10 strokes. Cell homogenates were spun at 250g for 5min at 4°C to remove unbroken cells.
All reactions were performed using 400μg of total cell homogenate and 20 minutes incubation time at 37°C unless stated otherwise. 2nM of labeled substrate (equal to 0.125μCi, and about 100.000dpm) and 500 nM unlabeled substrate were used in all reactions. The assay was performed as described [6] [25]. In this procedure the enzyme activity is determined by formation of tritiated water that accompanies the 4,5-double bond formation if the substrate is labeled appropriately. N-Octanoyl-[4,5-3H]-D-erythro-dihydrosphingosine was the substrate with its correspondent unlabeled substrate, and NADH was used as a co-factor.
For the direct in vitro assay 400μg of total cell homogenate or 100μg of rat liver microsomes (RLM) have been used. RLM have been prepared as described [26]. The direct in vitro assay was performed as described above except that peroxide (250μM, 1mM, and 5mM) was added directly to the assay tube with a total volume of 1ml. In calculating the results, the amount of radioactivity was divided by 2 to take into account only the amount of radioactivity that is relevant to the enzyme activity. This is important due to the action of the enzyme in abstracting only one of the two hydrogen atoms, only one of which is ‘randomly’ labeled with tritium.
Measurements of endogenous ceramide and dihydroceramide levels
After treatment, cells were harvested on ice, lipids were extracted, and levels of endogenous sphingolipids were measured by LC/MS analysis at the Lipidomics Core Facility of the Medical University of South Carolina. LC/MS results were normalized to phosphates.
Detection of DEGS-1 by Western blotting
Protein samples were boiled for 10min in reducing SDS-sample buffer and separated by 10% polyacrylamide gels. Proteins were transferred to PVDF membranes, blocked with PBS, 0.1% Tween 20 containing 5% nonfat dried milk, washed with PBS-Tween, and incubated for 1h at room temperature with rabbit polyclonal anti-DEGS-1 (1:1000) in PBS/0.1% Tween 20 containing 5% nonfat dried milk. The blots were washed with PBS-Tween and incubated with secondary antibody conjugated with horseradish peroxidase in PBS-Tween containing 5% nonfat dried milk. Detection was performed using enhanced chemiluminescence reagent (Pierce; Rockford, IL). Loading was normalized to β-actin using mouse monoclonal anti-β-actin antibody (SIGMA, St. Louis, MO).
Reactive Oxygen Species
For ROS detection in SMS-KCNR cells, 50000cells/well (50 l central drop) were seeded in a 24-well plate and experiments performed after cell attachment (about 5h after seeding). Cells were loaded for 30min (5% CO2 incubator at 37 C) with freshly prepared 10M CM-H2DCFDA (10mM stock in DMSO; final concentration in PBS). Probe containing PBS was replaced by red-phenol free culture medium and cells incubated for another 15min. Basal fluorescence intensity was measured (ex.485nm/em.530nm, Fluoroskan Ascent plate reader (Labsystems)) before adding hydrogen peroxide, menadione or tert-butylhydroperoxide. ROS production for each time point was calculated as % of fluorescence of each well related to corresponding basal values. Probe-free cells were used as internal autofluorescence control. A modified protocol was used for HEK293 cells; 24-well plates were polylysine-coated (0.01%, 1h at 37°C), washed 3 times with H2O, and dried. 50000cells/well (50 l central drop) were seeded and 450 l red-phenol free culture medium was added after 1h. Cells were incubated for minimum 2 days. Fresh medium was added before the experiment. Red-phenol free RPMI 1640 was used for CM-H2DCFDA loading; treatment and fluorescence measurement performed as mentioned for SMS-KCNR cells.
Cellular Thiol Content
SMS-KCNR cells 50000cells/well (50 l central drop) were seeded in a 24-well plate. After attachment, cells were treated for 30min and treatment containing culture medium was replaced by freshly prepared 10 M CellTracker Green CMFDA (10mM stock in DMSO; final concentration in red-phenol free RPMI 1640. After 30min (5% CO2 incubator at 37 C), probe containing RPMI 1640 was replaced by red-phenol free culture medium for another 30min and by PBS prior measuring fluorescence (ex.485nm/em.530nm, Fluoroskan Ascent plate reader (Labsystems)). Thiol content was calculated as % of fluorescence related to untreated control cells.
Statistical Analysis
Statistical significance was determined using an unpaired two-tailed t test and analysis of variance (ANOVA) with Bonferroni post-test to correct for multiple comparisons (GraphPad Prism, version 4). p values of <0.05 were considered to be statistically significant.
RESULTS
Hydrogen peroxide leads to an increase in dihydroceramide without significant effects on ceramide levels in several cell lines
Hydrogen peroxide (H2O2) was implicated in modulating cellular levels of sphingolipids by increasing ceramide [27–29], but there was no distinction between ceramide and dihydroceramide in those studies. In order to determine which cellular species are increased upon H2O2 treatment, LC/MS analyses were performed. Four different cell lines (HEK293, MCF-7, SMS-KCNR, and A549) were used for these studies. Upon treatment with H2O2 for 1 hour, a significant increase in dihydroceramide levels was observed in all cell lines (Fig. 1A, B, C, D). Importantly, the increase was observed for all the dihydroceramide species that were identified (Table 1). In contrast, no increase in ceramide levels was observed after the treatment. These results demonstrate that, unlike previously concluded, H2O2 leads to a selective increase in dihydroceramide and not ceramide. It should be also noted that in 3 of these cell lines total ceramide levels were 7–20 fold higher than the levels of dihydroceramide. In addition, lack of increase in dihydrosphinogosine levels (Table 1) suggested that the peroxide has no significant effect on de novo ceramide synthesis.
Figure 1. Effects of hydrogen peroxide on dihydroceramide and ceramide levels.

(A) HEK293, (B) MCF-7, (C) SMS-KCNR, and (D) A549 cells were treated with 200μM hydrogen peroxide for 1 hour. Bars represent levels of total dihydroceramide (left) and total ceramide (right) measured by LC/MS. * p<0.05, **p<0.01, ***p<0.001.
Table 1.
Effect of hydrogen peroxide on ceramide and dihydroceramide species in HEK293 cells treated with 200μM H2O2 for 1h.
| dhC14- Cer |
dhC16- Cer |
dhC18- Cer |
dhC20- Cer |
dhC22- Cer |
dhC22:1- Cer |
dhC24- Cer |
dhC24:1- Cer |
dhC26- Cer |
dhC26:1- Cer |
DHSph | Sph | |
|---|---|---|---|---|---|---|---|---|---|---|---|---|
| Control | 0.00072±0.00007 | 0.01106±0.002 | 0.00103±0.0003 | 0.00344±0.0007 | 0.00077±0.00009 | 0.00182±0.00023 | 0.00160±0.0002 | 0.00131±0.00014 | 0.00037±0.00014 | 0.00005±0.00002 | 0.000812±0.00015 | 0.00479±0.0004 |
| H2O2 | 0.00290*±0.00154 | 0.05528**±0.01802 | 0.00216**±0.00052 | 0.00440±0.00047 | 0.00386**±0.00129 | 0.00197±0.00024 | 0.01288***±0.00165 | 0.00974**±0.00352 | 0.00043±0.00042 | 0.00030**±0.00011 | 0.00095±0.00025 | 0.00387 ±00038 |
| C14-Cer | C16-Cer | C18-Cer | C18:1-Cer | C20-Cer | C20:1-Cer | C22-Cer | C22:1-Cer | C24-Cer | C24:1-Cer | C26-Cer | C26:1-Cer | |
| Control | 0.00168±0.00026 | 0.14530±0.02186 | 0.01659±0.00267 | 0.00382±0.00063 | 0.02039±0.00229 | 0.00234±0.00036 | 0.03420±0.00546 | 0.00301±0.00007 | 0.10791±0.01305 | 0.07417±0.00624 | 0.00187±0.00016 | 0.00169±0.00062 |
| H2O2 | 0.00207±0.00038 | 0.14767±0.03153 | 0.01984±0.00087 | 0.00480±0.00056 | 0.02172±0.00281 | 0.00301±0.00066 | 0.03843±0.00480 | 0.00329±0.00029 | 0.10328±0.00891 | 0.06998±0.00517 | 0.00216*±0.00011 | 0.00169 ±0.00025 |
Values are shown as pmoles/nmole of Pi and are mean ±S.D. of three independent experiments done in duplicate.
p<0.05,
p<0.01,
p<0.001.
Hydrogen peroxide inhibits dihydroceramide desaturase activity in a time and dose dependent manner without affecting cellular levels of DEGS-1
To determine if the observed increase in dihydroceramide results from inhibition of dihydroceramide desaturase, an in situ desaturase assay was employed. In this assay, cells are labeled with C12-dhCCPS prior to peroxide treatment, and conversion of C12-dhCCPS to the desaturated C12-CCPS is measured by mass spectrometry, thus providing a quantitation of cellular activity of the desaturase. Using this assay, it was observed that in HEK293 cells (Fig. 2A, left panel), the degree of conversion was decreased with concentrations of H2O2 as low as 25μM and dropped significantly with 100μM H2O2. In SMS-KCNR cells, H2O2 also induced a dose-dependent decrease on C12-CCPS production (Fig. 2A, right panel). Data from both cell lines implicate strong effect of hydrogen peroxide on dihydroceramide desaturase activity. As additional evidence, cellular levels of endogenous dihydroceramide were measured in the same samples and a comparable dose dependent increase in dihydroceramide levels was observed (Fig. 2B).
Figure 2. Effects of hydrogen peroxide on in situ dihydroceramide desaturase activity.


HEK293 and SMS-KCNR cells were labeled with C12-dhCCPS for 1 hour and then treated with the indicated concentration of hydrogen peroxide for 1h (A,B) or with 200μM hydrogen peroxide for the indicated time (C,D). Percent of conversion of C12-dhCCPS into C12-CCPS (A,C) as well as levels of endogenous dihydroceramide (B,D) were measured by LC/MS. * p<0.05, **p<0.01, ***p<0.001.
Next, the effect of H2O2 over time was examined. Treatment of HEK293 and SMS-KCNR cells with 200μM H2O2 inhibited conversion of C12-dhCCPS into C12-CCPS as rapidly as at 5 minutes in both cell lines (Fig. 2C). Furthermore, increases in endogenous dihydroceramide in HEK293 and SMS-KCNR cells were also observed after 5 minutes of 200μM hydrogen peroxide and followed a clear time dependent pattern (Fig. 2D).
In order to establish if H2O2 decreases desaturase activity due to degradation of dihydroceramide desaturase, DEGS-1 protein levels were measured by western blot in cells after treatment with various concentrations of hydrogen peroxide. Treatment as high as 400μM did not affect DEGS-1 levels in HEK293 or SMS-KCNR cells, indicating that there is no degradation of DEGS-1 upon H2O2 treatment (Fig. 3). Taken together, these results demonstrate that H2O2 has strong inhibitory effects on dihydroceramide desaturase activity.
Figure 3. Effects of hydrogen peroxide on DEGS-1 protein levels.

HEK293 and SMS-KCNR cells were treated with the indicated concentrations of hydrogen peroxide for 1h. After treatment, cells were harvested and lysed. Levels of endogenous DEGS-1 were determined by Western blot. Blots were stripped and reprobed for β-actin to normalize for loading. Insets are representative of two independent experiments.
Hydrogen peroxide inhibits dihydroceramide desaturase activity in situ but not in vitro
The above results on inhibition of cellular activity without a change in protein levels raised the possibility that H2O2 may cause an inactivation of the desaturase. First, the direct effect of H2O2 on desaturase activity was determined. The direct in-vitro assay at 20min (a time at which the assay is in the linear range) showed that peroxide inhibited the desaturase activity in RLM by only 7% at concentration of 250μM, 14% at 1mM and 29% at 5mM. By contrast, a known dihydroceramide desaturase inhibitor (C8CPPC) resulted in strong inhibition of the enzyme (Table 2). Using total cell homogenate, the activity was inhibited by 27% at a concentration of 5mM (Table 2). Moreover, a time course with 250μM peroxide did not show strongly significant inhibition even at 2h (Table 3). These results implied lack of profound direct enzyme inhibition by peroxide. Taken together, the above results show that H2O2 inhibited the activity of the desaturase in cells but not directly in vivo.
Table 2.
Direct effect of hydrogen peroxide on desaturase activity in vitro.
| Rat liver microsomes | nmol/min/g |
|---|---|
| Control | 0.43±0.04 |
| 250μM H2O2 | 0.4±0.052 |
| 1mM H2O2 | 0.37±0.032 |
| 5mM H2O2 | 0.31±0.019 |
| Rat liver microsomes | nmol/min/g |
| Control | 0.588±0.045 |
| 500nM C8CPPC | 0.37±0.044** |
| 750nM C8CPPC | 0.243±0.025*** |
| 1μM C8CPPC | 0.201±0.023*** |
| Cell Lysate | pmol/min/g |
| Control | 161.23±40.03 |
| 5mM H2O2 | 118.06±31.45 |
Values are mean ±S.D. of two separate experiments done in triplicate.
p<0.05,
p<0.01,
p<0.001.
Table 3.
Time course of direct effect of hydrogen peroxide (250μM) on desaturase activity in vitro measured in rat liver microsomes.
| Control | H2O2 | |
|---|---|---|
| 20min | 0.221±0.049 | 0.232±0.05 |
| 40min | 0.24±0.031 | 0.203±0.015 |
| 60min | 0.217±0.023 | 0.181±0.014* |
| 90min | 0.205±0.023 | 0.192±0.023 |
| 120min | 0.159±0.016 | 0.16±0.016 |
Values are shown as nmol/min/g and are mean ±S.D. of two separate experiments.
p<0.05.
In order to determine if H2O2 induced indirect inactivation of the desaturase, cells were first treated with H2O2 and then dihydroceramide desaturase activity was measured in vitro in cell lysates. For the in vitro assay, labeled dh-Cer (0.125 Ci=100,000dpm) (2nM final concentration) was used. Treating the cells with hydrogen peroxide inhibited the desaturase activity by 40% after 1hr of treatment at a concentration of 200 M (Table 4). To validate the assay, desaturase inhibitor, C8CPPC, was used as a positive control, and this compound showed approximately 88% inhibition of desaturase activity after 4 hours treatment at a concentration of 2.5 M (Table 4). Thus, H2O2 appears to induce indirect inactivation of the desaturase in cells.
Table 4.
Effect of hydrogen peroxide and C8CPPC on desaturase activity in vitro in SMS-KCNR cells.
| H2O2 (200μM, 1h) | C8CPPC (2.5 μM, 4h) | ||
|---|---|---|---|
| control | 100 ±5.15 | control | 100 ±9.06 |
| H2O2 | 59.44 ±5.47** | C8CPPC | 11.37 ±1.44*** |
Values are shown as pmol/min/g and are mean ±S.D. of two separate experiments done in triplicate.
p<0.01,
p<0.001.
Oxidative stress leads to inhibition of dihydroceramide desaturase
To establish if other ROS-inducing agents can also inhibit dihydroceramide desaturase, the effects of tert-butylhydroperoxide and menadione were examined. As 4-HPR was shown to increase intracellular ROS [18, 19] and affect dihydroceramide desaturase activity [10] in SMS-KCNR cells, this cell lines was used for further studies. Initially, the levels of ROS production in the cells upon treatment were determined. All compounds tested induced a time dependent increase of ROS; (Fig. 4). Similar to the effect of peroxide on dihydroceramide desaturase inhibition and dihydroceramide accumulation (Fig. 2C,D), H2O2 induced a time and dose dependent increase in intracellular ROS production. ROS increase in HEK293 cells could be detected as early as within 5minutes with H2O2 200 M (Fig. 4A, right panel). In SMS-KCNR cells, as low as 25 M were enough to increase ROS production within 5minutes (Fig. 4A). In addition, tert-butylhydroperoxide and menadione led to increase in ROS in SMS-KCNR cells at concentrations used (Fig. 4B,C). Of note, different reagents (H2O2, tert-butylhydroperoxide and menadione) showed different capacity to induce CM-H2DCFDA-reacting ROS species. Additionally, intracellular thiol levels were measured in SMS-KCNR cells. After 30 minutes of treatment, H2O2 induced a clear dose-dependent decrease with concentrations 50 M; values with tested tert-butylhydroperoxide and menadione concentrations were similar to those with 200–400 M H2O2 (Fig. 4D). Next, the effects of tert-butylhydroperoxide and menadione on endogenous ceramide and dihydroceramide levels were determined. Similarly to H2O2, both t-butyl hydroperoxide and menadione led to a several fold increase of dihydroceramide in SMS-KCNR cells (Fig. 5A) with no significant changes in ceramide levels observed (Fig. 5B).
Figure 4. Effects of hydrogen peroxide, menadione and tert-butylhydroperoxide on ROS and thiol levels.

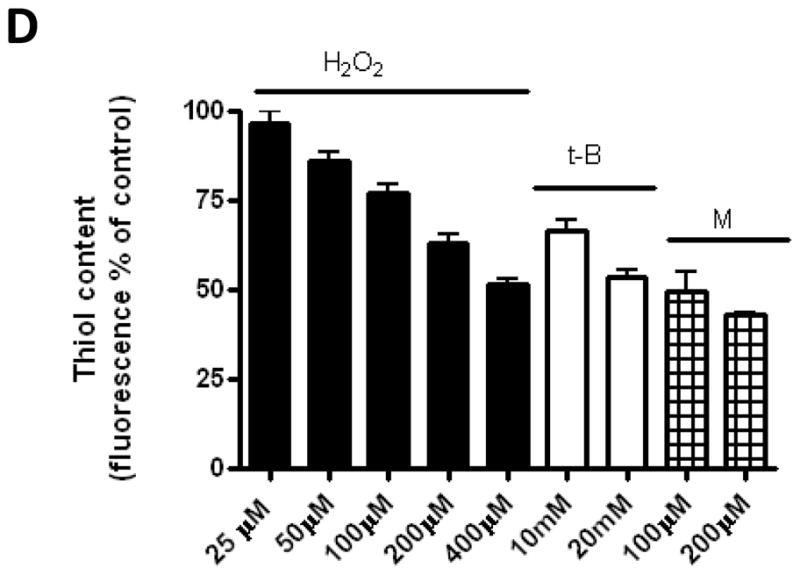
For ROS measurement (A,B,C) HEK293 and SMS-KCNR cells were loaded with CM-H2DCFDA and treated as indicated. Fluorescence was measured at the indicated time points, and ROS production was calculated as % of fluorescence related to the corresponding basal value. Data are shown as averages of at least 3 independent experiments performed in triplicate for SMS-KCNR cells and as a representative experiment performed in triplicate for HEK293 cells. For thiol measurements (D) SMS-KCNR cells were treated as indicated for 30min prior to loading with thiol-reacting probe (CMFDA). Data shown is average of at least 3 independent experiments performed in triplicate.
Figure 5. Effects of menadione and tert-butylhydroperoxide on dihydroceramide desaturase activity.


SMS-KCNR cells were treated with indicated concentrations of hydrogen peroxide, menadione and tert-butylhydroperoxide for 1h. Levels of endogenous ceramide and dihydroceramide (A,B) as well as dihydroceramide desaturase activity (C) were measured by LC/MS. Average of 2 independent experiments performed in duplicates. ***p<0.001. (D) In situ assay with addition of substrate (C12-dhCCPS) together with inhibitors (left panel) or for 1h after pretreatment with inhibitors (right panel). (E) After treatment with menadione and tert-butylhydroperoxide levels of endogenous DEGS-1 were determined by Western blot. Blots were stripped and re-probed for β-actin to normalize for loading. Insets are representative of two independent experiments.
Subsequently, in situ desaturase assays were performed. Both oxidants strongly inhibited the conversion of C12-dhCCPS into C12-CCPS in magnitudes comparable to 200 μM H2O2 over a 1 hour treatment (Fig. 5C). Similar experiments were performed with addition of C12-dhCCPS together with inhibitors or for 1 hour after pretreatment with inhibitors (Fig.5D). Inhibition of desaturase was even more pronounced under these assay conditions. As with H2O2, tert-butylhydroperoxide did not have significant effect on DEGS-1 protein level (Fig. 5E). Menadione only slightly reduced DEGS-1 level, but this decrease does not fully account for the potent enzyme inhibition provoked by this compound. Overall, these results show that oxidative stress effectively inhibits dihydroceramide desaturase activity.
DISCUSSION
Dihydroceramide desaturase is an important enzyme that has the potential to modulate dihydroceramide vs. ceramide levels in the cell. Despite its key role in ceramide synthesis, processes that regulate dihydroceramide desaturase activity have not been well defined. Data presented herein demonstrate that dihydroceramide desaturase activity can be modulated by oxidative stress. The treatment of cells with H2O2, menadione, and tert-butylhydroperoxide led to potent inhibition of desaturase activity and accumulation of dihydroceramide in several cell lines.
Previous studies showing formation of ceramide in cells treated with H2O2 were based on the DAG kinase assay [27–29]. Although a well established technique that allows rapid measurement of ceramide formation, this assay is limited in that it does not readily differentiate between ceramide and its precursor, dihydroceramide. Work presented here employed LC-MS technology that allows precise identification of ceramide species generated upon oxidative stress. Treatment with H2O2 led to accumulation of dihydroceramide in cells without significant changes in ceramide levels. Notably, all detectable species of dihydroceramide were increased upon peroxide treatment (Table 1). Similar results were obtained using tert-butylhydroperoxide as well as menadione, a synthetic derivative of vitamin K3 with antitumor properties [30], which was previously shown to inhibit desaturase activity in rat liver microsomes [6]. Taken together, this indicates that oxidative stress leads to accumulation of dihydroceramide and not ceramide in different cell lines.
Importantly, the results point to indirect inhibition and inactivation of the desaturase by oxidative stress. Thus, in addition to detecting changes in endogenous sphingolipids, an in situ desaturase assay was performed in cells treated with ROS-inducing agents. In all instances, cellular conversion of C12-dhCCPS into C12-CCPS was strongly inhibited reflecting a decrease in desaturase activity. This was confirmed by in vitro assays performed on cell lysates from cells treated with peroxide which showed that the enzyme became inactivated following treatment of cells with peroxide. However, the fact that the direct in vitro assay using RLM or cell lysate did not show significant direct effects of peroxide on desaturase activity suggests that the inhibition of the enzyme is indirect. Dihydroceramide desaturase, like other desaturase systems is thought to involve a series of coupled reactions that transport electrons from NAD(P)H to a terminal desaturase that reduces oxygen [6, 25]. NAD(P)H however is added to reaction and should be present in both RLM and cell homogenates. Therefore, the results suggest that the inhibition of the dihydroceramide desaturase activity is mediated by secondary metabolites in the cell upon peroxide treatment.
Along these lines and since oxidative stress inducers employed by this work have been previously shown to regulate glutathione levels [31–33], it was important to define the relationship between dihydroceramide desaturase activity and cellular thiol levels. Glutathione is the most abundant thiol species in the cell and it plays a particularly important role in the regulation of the cellular redox status. Moreover, the glutathione/glutathione disulfide (GSH/GSSG) ratio has been described as an important redox indicator and disruption of its level was shown to be involved in many pathological processes [34]. In our hands, all treatments affecting dihydroceramide desaturase activity led to depletion of cellular thiol levels. Interestingly, treatments inducing similar dihydroceramide desaturase inhibition levels showed comparable thiol depletion capacity despite differences in the range of ROS production. Of note, it was recently shown that resveratrol, a polyphenol with antioxidant properties, can also cause inhibition of dihydroceramide desaturase [12]. Similarly, affecting cellular levels of thiols was shown to inhibit dihydroceramide desaturase activity [5]. This implies that not only ROS induction, but any changes in the cellular redox state can modulate dihydroceramide desaturase activity.
It is interesting that the levels of ceramide showed either no significant changes or modest decreases. Two factors may contribute to the selective accumulation of dihydroceramide without significant drops in the total levels of ceramide. First, the levels of ceramide in most cells are several fold higher than those of dihydroceramide and thus over the time course of these studies, dihydroceramide may accumulate at the expense of minimal changes in ceramide (less than 10%). The only exception in the current studies was the A549 cell line which contains relatively high basal levels of dihydroceramide. The second reason for the apparent lack of changes in ceramide levels relates to the dynamic nature of sphingolipid metabolism and the fact that the current analysis reveals only snapshots of the levels of total lipid mass and not fluxes in those levels. Thus, additional mechanisms such as attenuation of incorporation of ceramide into complex sphingolipids and/or increased turnover of complex sphingolipids could serve to further attenuate changes in total ceramide mass. Moreover, oxidative stress may have additional effects on sphingolipid metabolism. For example, previous work has shown that peroxide also increases neutral sphingomyelinase (N-SMase) activity [28, 35] and depletion of cellular glutathione can activate N-SMases [36]. Consistent with this, in our hands, 1h peroxide treatment induced an approximately 30% increase in N-SMase activity (in vitro) in A549 cells (data not shown). However, unlike previous studies, no detectable increases in ceramide levels by H2O2 were observed. Although it is possible that increases in ceramide due to N-SMase activation could be masked by decreases in ceramide that would result from inhibition of desaturase activity, we also observed no significant effect of H2O2 on sphingomyelin levels in A549 cells (data not shown). Nevertheless, our data do not exclude the possibility that there is some degree of N-SMase activation with peroxide treatment.
This work addressed the role of oxidative stress in ceramide metabolism. The desaturation reaction has been shown to be NAD(P)H-dependent [5, 6], thus cellular redox state is important for this process. Disturbing cellular redox balance among other effects would profoundly influence dihydroceramide vs. ceramide levels in the cell.
Acknowledgments
Special acknowledgements to Lipidomics Core at Medical University of South Carolina for LC-MS analysis.
FUNDING
This work was supported by NIH grants CA87584 to Y.A.H., CA100767, RR17677, Rally Foundation for Childhood Cancer Research, Monica Kreber Golf Tournament, Chase After a Cure Foundation to JMK, and grant AP-2004-6497 from the Spanish Ministry of Science and Innovation to A. Apraiz.Lipidomic s Core was supported by NIH grant C06 RR01882.
Abbreviations
- 4-HPR
N-(4-hydroxyphenyl)-retinamide
- ROS
reactive oxygen species
- C12-CCPS
D-erythro-2-N-[12′-(1″-Pyridinium)dodecanoyl]-sphingosine bromide (D-erythro-C12-ceramide)
- C12-dhCCPS
D-erythro-2-N-[12′-(1″-pyridinium)dodecanoyl]-4,5-dihydrosphingosine bromide (D-erythro-C12-dihydroceramide
- NADH
nicotinamide adenine dinucleotide
- RLM
rat liver microsomes
- SDS
sodium dodecyl sulfate
- PVDF
polyvinylidene fluoride
- DMSO
Dimethyl sulfoxide
- H2O2
hydrogen peroxide
- DAG
diacylglycerol
- GSH
glutathione
- GSSH
glutathione disulfate
References
- 1.Hannun YA, Obeid LM. Principles of bioactive lipid signalling: lessons from sphingolipids. Nat Rev Mol Cell Biol. 2008;9:139–150. doi: 10.1038/nrm2329. [DOI] [PubMed] [Google Scholar]
- 2.Bartke N, Hannun YA. Bioactive sphingolipids: metabolism and function. J Lipid Res. 2009;50(Suppl):S91–96. doi: 10.1194/jlr.R800080-JLR200. [DOI] [PMC free article] [PubMed] [Google Scholar]
- 3.Maceyka M, Milstien S, Spiegel S. Sphingosine-1-phosphate: the Swiss army knife of sphingolipid signaling. J Lipid Res. 2009;50(Suppl):S272–276. doi: 10.1194/jlr.R800065-JLR200. [DOI] [PMC free article] [PubMed] [Google Scholar]
- 4.Kitatani K, Idkowiak-Baldys J, Hannun YA. The sphingolipid salvage pathway in ceramide metabolism and signaling. Cell Signal. 2008;20:1010–1018. doi: 10.1016/j.cellsig.2007.12.006. [DOI] [PMC free article] [PubMed] [Google Scholar]
- 5.Michel C, van Echten-Deckert G, Rother J, Sandhoff K, Wang E, Merrill AH., Jr Characterization of ceramide synthesis. A dihydroceramide desaturase introduces the 4,5-trans-double bond of sphingosine at the level of dihydroceramide. J Biol Chem. 1997;272:22432–22437. doi: 10.1074/jbc.272.36.22432. [DOI] [PubMed] [Google Scholar]
- 6.Geeraert L, Mannaerts GP, van Veldhoven PP. Conversion of dihydroceramide into ceramide: involvement of a desaturase. Biochem J. 1997;327 ( Pt 1):125–132. doi: 10.1042/bj3270125. [DOI] [PMC free article] [PubMed] [Google Scholar]
- 7.Ternes P, Franke S, Zahringer U, Sperling P, Heinz E. Identification and characterization of a sphingolipid delta 4-desaturase family. J Biol Chem. 2002;277:25512–25518. doi: 10.1074/jbc.M202947200. [DOI] [PubMed] [Google Scholar]
- 8.Taton M, Husselstein T, Benveniste P, Rahier A. Role of highly conserved residues in the reaction catalyzed by recombinant Delta7-sterol-C5(6)-desaturase studied by site-directed mutagenesis. Biochemistry. 2000;39:701–711. doi: 10.1021/bi991467t. [DOI] [PubMed] [Google Scholar]
- 9.Idkowiak-Baldys J, Takemoto JY, Grilley MM. Structure-function studies of yeast C-4 sphingolipid long chain base hydroxylase. Biochim Biophys Acta. 2003;1618:17–24. doi: 10.1016/j.bbamem.2003.09.012. [DOI] [PubMed] [Google Scholar]
- 10.Kraveka JM, Li L, Szulc ZM, Bielawski J, Ogretmen B, Hannun YA, Obeid LM, Bielawska A. Involvement of dihydroceramide desaturase in cell cycle progression in human neuroblastoma cells. J Biol Chem. 2007;282:16718–16728. doi: 10.1074/jbc.M700647200. [DOI] [PMC free article] [PubMed] [Google Scholar]
- 11.Stiban J, Fistere D, Colombini M. Dihydroceramide hinders ceramide channel formation: Implications on apoptosis. Apoptosis. 2006;11:773–780. doi: 10.1007/s10495-006-5882-8. [DOI] [PubMed] [Google Scholar]
- 12.Signorelli P, Munoz-Olaya JM, Gagliostro V, Casas J, Ghidoni R, Fabrias G. Dihydroceramide intracellular increase in response to resveratrol treatment mediates autophagy in gastric cancer cells. Cancer Lett. 2009;282:238–243. doi: 10.1016/j.canlet.2009.03.020. [DOI] [PubMed] [Google Scholar]
- 13.Zheng W, Kollmeyer J, Symolon H, Momin A, Munter E, Wang E, Kelly S, Allegood JC, Liu Y, Peng Q, Ramaraju H, Sullards MC, Cabot M, Merrill AH., Jr Ceramides and other bioactive sphingolipid backbones in health and disease: lipidomic analysis, metabolism and roles in membrane structure, dynamics, signaling and autophagy. Biochim Biophys Acta. 2006;1758:1864–1884. doi: 10.1016/j.bbamem.2006.08.009. [DOI] [PubMed] [Google Scholar]
- 14.Jiang Q, Wong J, Fyrst H, Saba JD, Ames BN. gamma-Tocopherol or combinations of vitamin E forms induce cell death in human prostate cancer cells by interrupting sphingolipid synthesis. Proc Natl Acad Sci U S A. 2004;101:17825–17830. doi: 10.1073/pnas.0408340102. [DOI] [PMC free article] [PubMed] [Google Scholar]
- 15.DiPietrantonio AM, Hsieh TC, Olson SC, Wu JM. Regulation of G1/S transition and induction of apoptosis in HL-60 leukemia cells by fenretinide (4HPR) Int J Cancer. 1998;78:53–61. doi: 10.1002/(sici)1097-0215(19980925)78:1<53::aid-ijc10>3.0.co;2-6. [DOI] [PubMed] [Google Scholar]
- 16.Darwiche N, Hatoum A, Dbaibo G, Kadara H, Nasr R, Abou-Lteif G, Bazzi R, Hermine O, de The H, Bazarbachi A. N-(4-hydroxyphenyl)retinamide induces growth arrest and apoptosis in HTLV-I-transformed cells. Leukemia. 2004;18:607–615. doi: 10.1038/sj.leu.2403245. [DOI] [PubMed] [Google Scholar]
- 17.Tiwari M, Bajpai VK, Sahasrabuddhe AA, Kumar A, Sinha RA, Behari S, Godbole MM. Inhibition of N-(4-hydroxyphenyl)retinamide-induced autophagy at a lower dose enhances cell death in malignant glioma cells. Carcinogenesis. 2008;29:600–609. doi: 10.1093/carcin/bgm264. [DOI] [PubMed] [Google Scholar]
- 18.Lovat PE, Ranalli M, Corazzari M, Raffaghello L, Pearson AD, Ponzoni M, Piacentini M, Melino G, Redfern CP. Mechanisms of free-radical induction in relation to fenretinide-induced apoptosis of neuroblastoma. J Cell Biochem. 2003;89:698–708. doi: 10.1002/jcb.10551. [DOI] [PubMed] [Google Scholar]
- 19.Darwiche N, Abou-Lteif G, Bazarbachi A. Reactive oxygen species mediate N-(4-hydroxyphenyl)retinamide-induced cell death in malignant T cells and are inhibited by the HTLV-I oncoprotein Tax. Leukemia. 2007;21:261–269. doi: 10.1038/sj.leu.2404472. [DOI] [PubMed] [Google Scholar]
- 20.Menon SG, Goswami PC. A redox cycle within the cell cycle: ring in the old with the new. Oncogene. 2007;26:1101–1109. doi: 10.1038/sj.onc.1209895. [DOI] [PubMed] [Google Scholar]
- 21.Sarsour E, Kumar MG, Chaudhuri L, Kalen AL, Goswami P. Redox Control of the Cell Cycle in Health and Disease. Antioxid Redox Signal. 2009 doi: 10.1089/ars.2009.2513. [DOI] [PMC free article] [PubMed] [Google Scholar]
- 22.Burhans WC, Heintz NH. The cell cycle is a redox cycle: Linking phase-specific targets to cell fate. Free Radic Biol Med. 2009 doi: 10.1016/j.freeradbiomed.2009.05.026. [DOI] [PubMed] [Google Scholar]
- 23.Szulc ZM, Bielawski J, Gracz H, Gustilo M, Mayroo N, Hannun YA, Obeid LM, Bielawska A. Tailoring structure-function and targeting properties of ceramides by site-specific cationization. Bioorg Med Chem. 2006;14:7083–7104. doi: 10.1016/j.bmc.2006.07.016. [DOI] [PubMed] [Google Scholar]
- 24.Sukhodub AL, Burchell A. Preparation of intact microsomes from cultured mammalian H4IIE cells. J Pharmacol Toxicol Methods. 2005;52:330–334. doi: 10.1016/j.vascn.2005.04.016. [DOI] [PubMed] [Google Scholar]
- 25.Schulze H, Michel C, van Echten-Deckert G. Dihydroceramide desaturase. Methods Enzymol. 2000;311:22–30. doi: 10.1016/s0076-6879(00)11063-8. [DOI] [PubMed] [Google Scholar]
- 26.Rinaldi R, Aniya Y, Svensson R, Eliasson E, Swedmark S, Shimoji M, Morgenstern R. NADPH dependent activation of microsomal glutathione transferase 1. Chem Biol Interact. 2004;147:163–172. doi: 10.1016/j.cbi.2003.12.004. [DOI] [PubMed] [Google Scholar]
- 27.Goldkorn T, Balaban N, Shannon M, Chea V, Matsukuma K, Gilchrist D, Wang H, Chan C. H2O2 acts on cellular membranes to generate ceramide signaling and initiate apoptosis in tracheobronchial epithelial cells. J Cell Sci. 1998;111 ( Pt 21):3209–3220. doi: 10.1242/jcs.111.21.3209. [DOI] [PubMed] [Google Scholar]
- 28.Chan C, Goldkorn T. Ceramide path in human lung cell death. Am J Respir Cell Mol Biol. 2000;22:460–468. doi: 10.1165/ajrcmb.22.4.3376. [DOI] [PubMed] [Google Scholar]
- 29.Lavrentiadou SN, Chan C, Kawcak T, Ravid T, Tsaba A, van der Vliet A, Rasooly R, Goldkorn T. Ceramide-mediated apoptosis in lung epithelial cells is regulated by glutathione. Am J Respir Cell Mol Biol. 2001;25:676–684. doi: 10.1165/ajrcmb.25.6.4321. [DOI] [PMC free article] [PubMed] [Google Scholar]
- 30.Chlebowski RT, Dietrich M, Akman S, Block JB. Vitamin K3 inhibition of malignant murine cell growth and human tumor colony formation. Cancer Treat Rep. 1985;69:527–532. [PubMed] [Google Scholar]
- 31.Applegate MA, Humphries KM, Szweda LI. Reversible inhibition of alpha-ketoglutarate dehydrogenase by hydrogen peroxide: glutathionylation and protection of lipoic acid. Biochemistry. 2008;47:473–478. doi: 10.1021/bi7017464. [DOI] [PubMed] [Google Scholar]
- 32.Ogasawara Y, Funakoshi M, Ishii K. Glucose metabolism is accelerated by exposure to t-butylhydroperoxide during NADH consumption in human erythrocytes. Blood Cells Mol Dis. 2008;41:237–243. doi: 10.1016/j.bcmd.2008.05.007. [DOI] [PubMed] [Google Scholar]
- 33.McAmis WC, Schaeffer RC, Jr, Baynes JW, Wolf MB. Menadione causes endothelial barrier failure by a direct effect on intracellular thiols, independent of reactive oxidant production. Biochim Biophys Acta. 2003;1641:43–53. doi: 10.1016/s0167-4889(03)00063-6. [DOI] [PubMed] [Google Scholar]
- 34.Ballatori N, Krance SM, Notenboom S, Shi S, Tieu K, Hammond CL. Glutathione dysregulation and the etiology and progression of human diseases. Biol Chem. 2009;390:191–214. doi: 10.1515/BC.2009.033. [DOI] [PMC free article] [PubMed] [Google Scholar]
- 35.Levy M, Castillo SS, Goldkorn T. nSMase2 activation and trafficking are modulated by oxidative stress to induce apoptosis. Biochem Biophys Res Commun. 2006;344:900–905. doi: 10.1016/j.bbrc.2006.04.013. [DOI] [PMC free article] [PubMed] [Google Scholar]
- 36.Liu B, Andrieu-Abadie N, Levade T, Zhang P, Obeid LM, Hannun YA. Glutathione regulation of neutral sphingomyelinase in tumor necrosis factor-alpha-induced cell death. J Biol Chem. 1998;273:11313–11320. doi: 10.1074/jbc.273.18.11313. [DOI] [PubMed] [Google Scholar]