

Abstract
Objectives
To examine the variability of physical activity environments and outdoor play-policies in child-care centers, and to determine if they are associated with center demographic characteristics
Design
Telephone survey—the Early Learning Environments Physical Activity and Nutrition Telephone Survey (ELEPhANTS)
Setting
Child-care centers in Hamilton County (Cincinnati area), Ohio, 2008–9.
Participants
Directors of all 185 licensed full-time child-care centers in Hamilton County.
Outcome Measures
Descriptive measures of center playground and indoor physical activity environments, and weather-related outdoor-play policies.
Results
162 (88%) centers responded. Most (93%) centers reported an on-site playground, but only half reported their playgrounds as large, at least 1/3rd covered in shade, or having a variety of portable play equipment. Only half reported having a dedicated indoor gross-motor room where children could be active during inclement weather. Only 20% of centers allowed children to go outside in temperatures below 32°F, and 43% of centers reported allowing children outdoors during light rain. A higher percent of children receiving tuition-assistance was associated with lower quality physical activity facilities and stricter weather-related practices. National accreditation was associated with more physical-activity promoting practices.
Conclusion
We found considerable variability in the indoor and outdoor playground offerings among child-care centers, even within a single county of Ohio. Per center policy and limited inside options, children’s active opportunities are curtailed due to sub-freezing temperatures or light rain. Policy change and parent/teacher education may be needed to ensure children achieve ample opportunity for daily physical activity.
Introduction
For preschool-aged children daily physical activity is essential for obesity prevention and for learning age-appropriate gross-motor, fine motor, cognitive and social-emotional skills.1–7 Over half of U.S. children age 3 to 6 years are in child care centers,8 and many spend long hours there.9 Unfortunately in these settings children are sedentary most (70–83%) of their time, excluding nap, and most are not getting adequate amounts of physical activity,10–12 perhaps contributing to the increasing rates of obesity among U.S. children.13–16
Pre-school children’s physical activity levels vary widely across centers. Indeed, the center a child attends explains substantial variability (27–47%) in physical activity of children across centers,10, 11, 17 while child factors such as age, race, gender, BMI, and socio-economic status all combined explain only a small part (3–10%)10, 11 of such variability. Because this is a new and emerging area of inquiry,18 little is known about why physical activity levels vary across centers, or about the physical activity environments in these centers--including facilities and outdoor-play policies--that might contribute to the variability in physical activity levels. A better understanding of current conditions, and the extent to which these conditions vary by center demographic characteristics (e.g., for-profit status, race/ethnicity and socioeconomic status of population served), is essential to ensure that all children have adequate opportunities to achieve recommended levels of physical activity.19, 20
Evidence from a few studies21–23 suggest that variations in playground and indoor gross-motor room offerings (including size and variety of fixed and portable play equipment) may explain the variability in children’s activity across centers. Yet recent surveys of child-care center physical activity environments have not included measures of playground size, access, surfaces, topography, or quality.24, 25 Only one published study24 included a measure of shade and access to playground for children with special needs, recently cited as model playground amenities for child-care settings.26
One recent cross-sectional study21, 23 found that higher levels of activity occurred in child care settings that offered more daily occasions of outdoor play and increased total daily time allotted for active play,23 however another experimental study27 found no increase in activity levels when outdoor playtime was increased. Of note, both studies were conducted in temperate climates where cold temperatures and/or snow—which have both been linked to lower activity levels6, 17, 28, 29—would rarely preclude children’s outdoor active opportunities. Our prior research of child-care providers in southwestern Ohio30, 31 has identified center clothing- and weather-related policies for outdoor play as novel, but critical, barriers to children's physical activity. In Ohio, centers and/or individual teachers must decide which specific temperatures and precipitation conditions will safely permit children’s outdoor play, as guidelines are not explicitly stated by state licensing (Ohio Dept. of Jobs and Family Services Sect 5101:2 12–14). To our knowledge, the variability of a center’s playground offerings or a center’s weather and clothing policies for outdoor play have not been systematically studied, in spite of their potentially significant impact on children’s active opportunities.
The purpose of this study was to better understand the breadth and variability of child-care-center-physical activity environments, specifically the 1) indoor and outdoor facilities, including playground size, perceived quality, surfaces, access, and topography, and 2) the weather and clothing policies for outdoor play. Because a center’s demographic characteristics may reflect access to resources and center programmatic priorities, we also aimed to understand how physical activity environment and outdoor-play policies may vary by child-care center demographic characteristics.
Methods
Setting
Hamilton County, OH (Cincinnati) is an urban area and demographically similar to the US overall (2000 Census): median household income $60,646, 10.8% of families below poverty, 6.6% of employed workers with children < 6 years), but with a higher percentage of Blacks or African-Americans (24.2% vs. 12.4%), and lower proportion of Asians (1.7% vs. 4.4%), and Hispanic or Latinos (1.5% vs. 14.8%). The average maximum and minimum temperatures for the months of January (37°F, 21°F), July (88°F, 66°F) and the year (63°F, 44°F) reflect moderate but varied temperatures. Annually, Cincinnati receives an average of 42.6 inches of rainfall, 22.5 inches of snow, and has 132 days with precipitation of ≥ 0.01inch (National Weather Service).
Participants and recruitment
All directors of licensed child care centers in Hamilton County that offer full-time care to children 3–6 years (not in kindergarten)(n=196) were eligible to participate. Child care center directors received an introduction letter and follow-up telephone call. After eight unsuccessful attempts to conduct an interview, the child care center was considered unreachable. Interviews were completed between August 2008 and March 2009. Participants completing the survey received a $15 gift certificate. The protocol was reviewed and determined to be exempt by the Cincinnati Children’s Hospital Institutional Review Board.
The final sample (Table 1) included 162 of 185 (87.5%) eligible centers. Eleven centers were ineligible: no longer in service (n=5), no valid telephone number (n=3), did not serve preschool-age children (n=1), not full-time (n=1), or not located in Hamilton County (n=1). Thirteen centers refused because higher personnel (e.g., the owner) declined (n=5), not interested (n=4), lack of time (n=2), or because participation was not mandatory (n=2).
Table 1.
Demographic characteristics of centers (N=162)
| Characteristic | N# | Median (IQR) or n (%) |
|---|---|---|
| License capacity (# of children) | 154 | 84 (51.5–130) |
| Amount enrolled (# of children) | 159 | |
| Children 0–18 months | 9 (0–16) | |
| Children 18–36 months | 15 (7–23) | |
| Children 3–5 years | 30 (19–44) | |
| For profit status | 159 | |
| Not for profit | 74 (47%) | |
| For profit | 85 (53%) | |
| Head start affiliation | 161 | |
| yes, all | 15 (9%) | |
| yes, part | 27 (17%) | |
| Early Learning Initiative*(funded by the state) | 11 (7%) | |
| Not affiliated with Head start | 108 (67%) | |
| Center type | 161 | |
| Independent | 73 (45%) | |
| National chain | 30 (19%) | |
| Religious-affiliated | 27 (17%) | |
| Local chain | 25 (16%) | |
| College-university affiliated | 5 (3%) | |
| National Association for the Education of Young Children (NAEYC)§ accreditation | 162 | 25 (15%) |
| Center participate in Child and Adult Care Food Program (CACFP)¶ program | 160 | |
| yes | 90 (56%) | |
| no | 70 (44%) | |
| % of children receiving tuition assistance† or scholarships | 157 | 80% (34–96) |
| % total funds from public subsidies | 93 | 80% (15–95) |
| Tuition paid by full-pay clients/week-(in $; range $73.9– $377.69) | 156 | 159 (150–170) |
| Primary race (race of >50% of children enrolled) | 160 | |
| Black or African American | 76 (47%) | |
| White or Caucasian | 60 (38%) | |
| No primary race | 19 (12%) | |
| Mixed race | 5 (3%) | |
| Staff education (% of staff) | 157 | |
| Child Development Associate (CDA)‡ credential | 14 (5–25) | |
| Associates degree | 10 (0–20) | |
| College degree | 11 (3–25) |
This column reflects the denominator in the response rate for each demographic characteristic. The response rates for the center characteristics used in analysis with weather and facilities scores ranged from 95% (licensed capacity) to 100% (NAEYC accreditation).
This is a state funded program similar to Head Start that provides enriched educational experiences for children of income-eligible families.
NAEYC is the world’s largest organization dedicated to improving the well-being of young children up to age 8. Child care centers can achieve voluntary accreditation by NAEYC, which involves application, aligning their program with certain standards, and an on-site assessment evaluating compliance of these standards as well as level of teacher education.
The Child and Adult Care Food Program is the food nutrition service for income-eligible children, funded by the US Dept of Agriculture. The program serves meals and snacks to more than 3.2 million children each day.43
Subsidized tuition, or vouchers, provides financial assistance to low-income working families to help them afford quality child care. In Ohio, eligible families apply for subsidy through the Department of Job and Family Services and the amount awarded to them depends on family size and income.
A Child Development Associate is an individual who has successful completed an assessment process that verifies their proficiency in early childhood care and education. A CDA is able to meet the specific needs of children and work with parents/other adults to foster children’s physical, social, emotional and intellectual growth.
Survey Instrument
The only existing validated instrument to measure child-care center physical activity environments, the Nutrition and Physical Activity Self Assessment for Child Care (NAP SACC),32–34 does not include measures of weather or clothing policies for active play, nor playground size, access, surfaces, shade, topography, and quality. Thus, we developed a new instrument, the Early Learning Environments for Physical Activity and Nutrition Environments Telephone Survey (ELEPhANTS), which targeted these specific constructs and also several concepts related to program structure, staff training and behavior, and sedentary environment that have been linked to children’s physical activity levels25 and recently cited as model regulations for promoting physical activity in child care (although ELEPhANTS was developed and deployed prior to the publication of the model regulations).26 ELEPhANTS included items from NAP SACC that were previously shown to have good reliability and validity.34 Items that had low agreement with directly-observed behaviors were modified. The wording and content of both the new and modified items were developed from the results of a series of focus groups31 that assessed barriers to physical activity in child-care.31 ELEPhANTS was reviewed for content validity by experts from diverse fields including: early education, child-care playground equipment sales, landscape architecture, physical activity and parks assessment, nutritional epidemiology, and scale development. Additionally the instrument was assessed for face validity through pre-testing and cognitive interviews35, 36 with 13 child care providers. The final ELEPhANTS instrument consists of 65 questions designed to be administered by phone to center administrative staff by a trained interviewer. Approximately half the items were open-ended/volunteer response, requiring the interviewer to choose from pre-selected response options only visible to the interviewer. If a volunteered response did not fit clearly into any of the response options, the interviewer was instructed to probe with clarifying questions. For multiple response questions (e.g., “What fixed structures are on your playground?”), participants were prompted to supply an exhaustive list. Phone interviews were audio-recorded, and survey responses were recorded on paper. The instrument took an average of 33 ± 9 minutes to complete. A copy of the final ELEPhANTS instrument is available from the primary author upon request.
Data analysis
Descriptive statistics identified the prevalence and variability of environmental features, policies, and child care center characteristics. We developed two summary scores based on the presence (scored as one) or absence (zero) of 12 facility items (Table 2) and 7 weather/outdoor play policies (Table 3) that have been linked to children’s physical activity (references for each item listed in tables). Continuous items such as the number of winter clothing items kept for loan and the number of types of portable play equipment were dichotomized at their median21 (3 and 5 respectively), with centers that reported ≥ the median receiving a score of 1 for that item. As the amount of fixed equipment has been found to be inversely related to children’s physical activity,21, 23 centers that reported having ≤ to the median number of fixed pieces of equipment (4) were assigned a score of one for this item. Table 4 lists the center characteristics considered as candidate predictors for the summary scores. We used t-tests and one-way analysis of variance to compare summary scores by level of the independent variables, and performed a post-hoc Tukey’s pairwise comparisons for all statistically significant categorical predictor variables with 3 or more levels. P<0.05 was considered statistically significant.
Table 2.
Facility score#: Twelve criteria related to quality of the physical activity environment of child care centers
| Supporting references | % meeting criteria | n/N | |
|---|---|---|---|
| 1. Playground has a hard surface that permits riding toys and all types of ball play* | 22, 44 | 31 | 50/162 |
| 2. Playground has more than one type of surface | 44 | 69 | 111/162 |
| 3. Playground has ≤ 4 pieces of fixed equipment | 21, 23 | 73 | 118/162 |
| 4. Playground has ≥ 5 pieces of portable play equipment | 21, 23 | 52 | 85/162 |
| 5. Playground has hill or slope | 22 | 20 | 33/161 |
| 6. Drinking water on playground and available for self-service | 33, 44 | 62 | 100/161 |
| 7. Special needs access§ | 26 | 69 | 109/158 |
| 8. Shaded area on playground (≥ 1/3 of playground covered) | 26 | 52 | 85/160 |
| 9. No or minimal barriers to access playground | 44 | 79 | 125/158 |
| 10. Playground rated as large or very large | 21 | 56 | 88/158 |
| 11. Playground rated as good or excellent | 44 | 68 | 108/158 |
| 12. Center has an indoor gross-motor room | 25 | 51 | 82/162 |
| Total score mean ± sd, range | 6.8 ± 1.9 | 2–11 |
Facility score calculated as sum individual scores for each of the 12 items, whereby if a center met the criterion it was assigned a one for that item, and zero otherwise. Higher facilities scores are indicative of more physical-activity-promoting facilities.
At least one third of the area is covered by a hard surface including rubberized surface, asphalt or blacktop, or concrete.
Criterion was met if center reported any of the following: wheelchair access to playground, playground surface accommodates wheelchair or other special needs equipment (e.g. blacktop, happy landing), or playground contains special equipment designed or to accommodate children in wheelchair (e.g. elevated sandbox, ramps).
Table 3.
Weather score# Seven weather and clothing policies that are related to physical activity promotion
| Supporting references | % meeting criteria | n/N | |
|---|---|---|---|
| 1. Written policy to go outside in temperatures under 32 degrees | 20 | 20 | 32/162 |
| 2. Children allowed outside in light rain | 20 | 43 | 68/160 |
| 3. Children allowed outside if snowing | 20 | 70 | 97/139 |
| 4. Children allowed outside if playground is wet, muddy, or flooded | 20 | 44 | 70/158 |
| 5. Center keeps 3 or more types of winter clothing (eg. coats, mittens, hats) at the center | 31 | 71 | 115/162 |
| 6. Written policy prohibiting flip-flops | 31 | 64 | 103/160 |
| 7. Written policy prohibiting sandals* | 31 | 47 | 75/160 |
| Total score mean ± sd, range | 3.5 ± 1.6 | 0–7 |
Weather score calculated as sum individual scores for each of the 7 items, whereby if a center met the criterion it was assigned a one for that item, and zero otherwise. Higher weather scores are indicative of less restrictive weather policies for outdoor play.
Includes any type of sandal (open-toe, with back/strap, etc)
Table 4.
Facilities and weather scores by child care center characteristics
| Characteristic | Facilities score Mean(sd) |
p value# |
Weather score Mean(sd) |
p value# |
||
|---|---|---|---|---|---|---|
| Total sample | 6.8 (1.9) | 3.5 (1.6) | ||||
| Possible range | 0–12 | 0–7 | ||||
| Licensed capacity | ||||||
| < 57 children enrolled | 6.3 (1.7) | 0.12 | 3.4 (1.7) | 0.61 | ||
| 58–118 children enrolled | 6.9 (1.7) | 3.3 (1.5) | ||||
| >119 children enrolled | 7.0 (2.1) | 3.6 (1.6) | ||||
| For profit status | ||||||
| For-profit | 6.5 (1.9) | 0.16 | 3.2 (1.5) | 0.01 | ||
| Not for-profit | 7.0 (1.8) | 3.8 (1.7) | ||||
| Head Start status | ||||||
| Not Head Start | 6.8 (1.7) | 0.83 | 3.5 (1.6) | 0.06 | ||
| Early Learning Initiative | 6.4 (2.9) | 4.5 (1.4) | ||||
| Part Head Start | 6.9 (2.0) | 3.3 (1.5) | ||||
| Full Head Start | 6.5 (1.8) | 2.9 (1.6) | ||||
| Tuition rate | ||||||
| < $155 | 6.5 (2.0) | 0.11 | 3.4 (1.6) | 0.13 | ||
| $155 – $164 | 6.5 (1.7) | 3.3 (1.4) | ||||
| > $164 | 7.2 (2.0) | 3.9 (1.7) | ||||
| % receiving tuition-assistance | ||||||
| 0–50% | 7.4 (1.8)a,b | 0.006 | 4.0 (1.8)a | 0.02 | ||
| 51–92% | 6.5 (2.0)a | 3.3 (1.3) | ||||
| >92% | 6.3 (1.7)b | 3.1 (1.6)a | ||||
| Primary race of center | ||||||
| White | 7.2 (1.8)a | 0.005 | 3.8 (1.8) | 0.27 | ||
| Black | 6.6 (1.8)b | 3.3 (1.6) | ||||
| Mixed | 4.4 (1.8)a,b | 3.4 (1.1) | ||||
| No primary race | 6.5 (2.1) | 3.2 (1.3) | ||||
| % Staff with Bachelors or higher | ||||||
| < 7% | 6.3 (1.9)a | 0.01 | 3.3 (1.5) | 0.64 | ||
| 7–20% | 6.5 (1.8) | 3.5 (1.7) | ||||
| > 20% | 7.3 (1.8)a | 3.6 (1.6) | ||||
| NAEYC accredited | ||||||
| Yes | 7.3 (2.1) | 0.10 | 4.4 (1.6) | 0.002 | ||
| No | 6.6 (1.8) | 3.3 (1.6) | ||||
| National Chain | ||||||
| Yes | 6.8 (2.0) | 0.86 | 3.8 (1.3) | 0.22 | ||
| No | 6.7 (1.9) | 3.4 (1.7) | ||||
| Local Chain | ||||||
| Yes | 6.2 (1.9) | 3.2 (1.6) | ||||
| No | 6.8 (1.9) | 0.11 | 3.5 (1.6) | 0.42 | ||
| Independent Chain | ||||||
| Yes | 6.8 (1.9) | 0.83 | 3.3 (1.7) | 0.25 | ||
| No | 6.7 (1.9) | 3.6 (1.5) | ||||
| Religious-affiliated | ||||||
| Yes | 6.3 (1.7) | 0.14 | 3.6 (1.7) | 0.61 | ||
| No | 6.8 (1.9) | 3.5 (1.6) |
p values are from one-way analysis of variance tests or t-tests.
Pairwise comparisons of the same letter are significantly different at alpha <0.05 level using Tukey’s studentized range test
Results
Facilities
Most child-care centers reported an onsite outdoor playground (93%); 59% reported more than one playground (range 0 to 5), dedicated to different age-groups. On playgrounds, centers reported having 3.8 ±1.9 pieces of fixed equipment (range 0–13), usually a climber (95%), dramatic play structures such as a playhouse (37%), basketball hoop or other aiming structure (32%), a place to sit and do quiet activities (30%), and tunnels (29%). Similarly, centers reported 4.6 ± 1.9 types of outdoor portable play equipment (range 0–9 types), usually balls (91%), riding toys (71%), art materials (60%), jump ropes (54%), and sand/water toys (44%). The typical playground had two surfaces—usually mulch (63% of centers) and grass (39%) or concrete (34%). Most (85%) had special needs access, either wheelchair access to playground (40%), surfaces that accommodate a wheelchair (30%), specialized adaptive equipment (30%), or a place to sit and do quiet activities (24%). Playground size varied from “very large” (17%), “large” (39%), “medium to average” (33%) or “small” (11%) or alternatively about the size of a football field (5%), half of a football field (21%), basketball court (41%), tennis court (16%), and half of a basketball court (17%). Common improvements directors wanted to make were: add more climbing or fixed equipment (47%), change or add surfaces (35%), and add more portable play equipment (23%).
For the 51% of centers with a dedicated indoor gross-motor room, room size varied from comparable to a basketball court (24%), a tennis court (12%), half a basketball court (28%), a large (31%) or small (5%) classroom. All but one of the 80 centers without a dedicated gross-motor room reported that they used either a classroom or hallway for indoor activity. Figure 1 shows the distribution of facility and weather scores.
Figure 1.
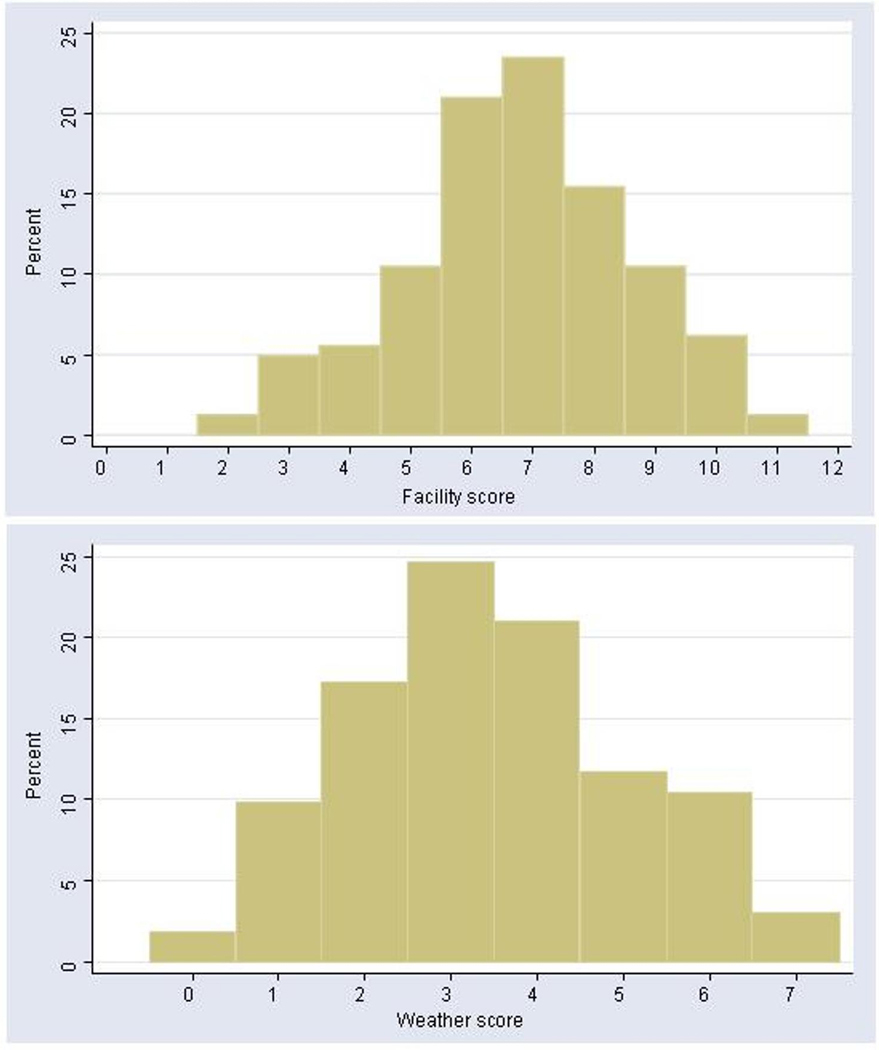
Distribution of facility and weather scores
Weather-related policies
Weather-related policies permitting outdoor play varied across centers (Table 3). Of the 137 centers that cited a minimum temperature for outside play; 54% cited it as 32°F, 23% reported lower and 23% reported higher minimums (range 20°–65°F); 78% stated it was listed in their parent handbook. Centers reported a wide range in total time (17.5–120 minutes, mean ± sd = 77±35 min) that children were scheduled outdoors, usually consisting of two outdoor sessions lasting 38 ± 17 minutes each. However during inclement weather, directors reported curtailing these sessions to 17 ± 9 minutes each. In deciding if weather conditions safely permit outdoor play, 55% of directors indicated that they made this decision, while 41% left it to individual teacher discretion and 4% decided through teacher consensus. Centers reported keeping 2.8 ± 1.4 additional clothing items (range 0–5) such as coats (76%), hats (71%), and mittens (75%), for loan as needed.
Differences in facilities and weather policies by center characteristics
Higher facility scores were significantly related to fewer children receiving tuition assistance, having primarily white children enrolled, and a greater percent of staff with a Bachelor’s degree (Table 4). Physical-activity-promoting weather policies were associated with centers being not-for-profit, fewer children receiving tuition-assistance, and accreditation by the National Association for the Education of Young Children (NAEYC).
Discussion
In this first systematic study of child-care centers’ physical activity facilities and outdoor play policies, we found considerable variability in facilities--even within a single county of Ohio--and that per center policies children’s active opportunities can often be curtailed due to inclement weather. This is problematic because only half of the centers had indoor gross-motor rooms where children could be active during inclement weather. Most centers had an accessible playground on-site, but only half had a large space, shade, and a variety of portable play equipment. Less than a third had a hard surface to permit all types of portable play. Compared to other studies of playground environments, a similar proportion of centers had playgrounds,24 and the playgrounds were of comparable size,21 had less fixed equipment21, 25and shade;24 and more portable play equipment21, 25 and special needs access.24 Insufficient playground and indoor facilities may help explain why preschool-aged children are not getting sufficient amounts of physical activity.10–12
Weather policies permitting playground use also varied considerably, with multiple weather conditions potentially curtailing children’s active opportunities. No center reported allowing children outside in wind chills ≤15°F, the minimum safe temperature per recent guidelines.20, 37, 38 Specifically, only 20% of centers were permitted children to go outside in subfreezing temperatures (<32°F). This would mean roughly 1.5 months that children in this area could not go outside (National Weather Service). Only 43% of centers reported allowing children outdoors during light rain, adding an additional 132 days in which children would not be allowed outdoors (National Weather Service). In sum, the typical weather-related policies at child-care centers in Cincinnati would restrict outdoor play for approximately 179 days (46%) of the year. The 32°F minimum temperature is much higher than the minimum safe temperature for play according to newly released physical activity guidelines for child-care (minus 15°F windchill),20 but is congruent with the local elementary school system’s outdoor play policy. It is not known how these outdoor play policies were developed. To our knowledge, this is the first study of weather-related outdoor policies of child care centers. More research is needed to understand how these policies were developed and how parents’ and teachers’ attitudes about weather (including concerns about children getting dirty or sick when exposed to cold air)31may influence decisions about outdoor play. This highlights the interaction among policy, provider and parent attitudes. Reducing the minimum safe temperature for outdoor play and providing training about safe conditions for outdoor play could substantially increase active opportunities. Given that we have previously reported that parents do not dress children appropriately for weather and active play,31 pediatric clinicians should consider discussing with parents during well-child checks the importance of: 1) outdoor play for healthy growth and development, 2) dressing children appropriately for play, and 3) working with child care center staff to ensure that children are given adequate opportunities for physical activity.
Centers having more low-income children (receiving subsidized child-care) also reported having poorer quality facilities and more stringent outdoor play policies. Centers with primarily non-white enrollment reported poorer quality facilities. This is concerning because non-white and low-income children may not have safe opportunities for outdoor play near or around their homes,39–42 so the child care center may be their only opportunity for outdoor play. The tuition rate for full-paying attendees was not found to be significantly associated with quality of physical activity facilities or practices, yet most children (65%) were receiving some form of subsidized child care. A potential way to increase children’s physical activity and reduce income and race disparities in physical activity opportunities may be to provide small grants to centers that serve minority and/or low-income children that would enable these centers to establish or enrich safe places for children to be active. Many of the improvements are not costly: e.g., re-configuring an indoor space to allow gross-motor play during inclement weather, addition of shade trees, more portable play materials, or a hard surface to the playground. The grants should be directive, though, because the most common change that respondents wanted to make to the playground was to add more fixed play equipment, which is both very costly and inversely related to children’s physical activity levels. 21, 23 Such grants could offer educational opportunities about cost-effective strategies to increase children’s physical activity. The reason for the relation between lower income child centers and more stringent outdoor policies is unclear, but perhaps better training or subsidies to provide warm or waterproof clothing to children could help centers have a less strict weather-related policy regarding outdoor play.
Centers that were NAEYC-accredited reported more practices associated with physical activity promotion, which may be related to NAEYC requirements that directors be trained in early childhood development. Centers that were not-for-profit also reported a greater number of weather conditions under which children were permitted to play outdoors. These associations may be helpful in identifying which types of centers may benefit from policy training about safe outdoor weather conditions for play.
Our results may not be generalizable to other regions and were based on self-report rather than observation of actual practices. However, study strengths are it was a census of all licensed full-time child care centers within this region, not centers of a particular type (e.g., Head Start), and it achieved a high response rate. This allowed us to examine demographic predictors of physical activity policies and facilities within the sample. We focused on facilities and outdoor play policies because directors may not reliably report their staff’s behavior. Our survey was designed to use open-ended questions and volunteer responses to minimize social desirability bias. Lastly, as there have been few previous studies of the quality of child-care physical activity facilities or weather-related policies for playground use, we developed summary scores for these two domains de novo. The individual items in the scores were selected from predictors identified in the literature and our formative research. Further research is needed to identify the factors associated with higher levels of physical activity.
This study contributes to the sparse but growing literature of child-care center physical activity environments by reporting on the prevalence of “typical” child care policies and environments, and the extent to which they vary even within a single county. Additionally, it highlights the potential large impact of weather, outdoor-play policies, and caregiver behaviors related to weather in influencing children’s active play opportunities.
Acknowledgments
This research was supported in part by a grant under The Robert Wood Johnson Foundation Physician Faculty Scholars Program, a career development award from the National Institutes of Health (K23 HL088053), and USPHS Grant #UL1 RR026314 from the National Center for Research Resources, NIH. We are also grateful to 4C, the child-care resource and referral agency for Greater Cincinnati, for their assistance with this project.
Footnotes
Author contributions: Dr. Copeland had full access to all of the data in the study and takes responsibility for the integrity of the data and the accuracy of the data analysis.
REFERENCES
- 1.Reilly JJ. Physical activity, sedentary behaviour and energy balance in the preschool child: opportunities for early obesity prevention. Proc Nutr Soc. 2008 Aug;67(3):317–325. doi: 10.1017/S0029665108008604. [DOI] [PubMed] [Google Scholar]
- 2.Burdette HL, Whitaker RC. A national study of neighborhood safety, outdoor play, television viewing, and obesity in preschool children. Pediatrics. 2005 Sep;116(3):657–662. doi: 10.1542/peds.2004-2443. [DOI] [PubMed] [Google Scholar]
- 3.Timmons BW, Naylor PJ, Pfeiffer KA. Physical activity for preschool children--how much and how? Can J Public Health. 2007;98 Suppl 2:S122–S134. [PubMed] [Google Scholar]
- 4.Ginsburg KR. The importance of play in promoting healthy child development and maintaining strong parent-child bonds. Pediatrics. 2007 Jan;119(1):182–191. doi: 10.1542/peds.2006-2697. [DOI] [PubMed] [Google Scholar]
- 5.Active healthy living: prevention of childhood obesity through increased physical activity. Pediatrics. 2006 May;117(5):1834–1842. doi: 10.1542/peds.2006-0472. [DOI] [PubMed] [Google Scholar]
- 6.Fisher A, Reilly JJ, Kelly LA, et al. Fundamental movement skills and habitual physical activity in young children. Med Sci Sports Exerc. 2005 Apr;37(4):684–688. doi: 10.1249/01.mss.0000159138.48107.7d. [DOI] [PubMed] [Google Scholar]
- 7.Mahar MT, Murphy SK, Rowe DA, Golden J, Shields AT, Raedeke TD. Effects of a classroom-based program on physical activity and on-task behavior. Med Sci Sports Exerc. 2006 Dec;38(12):2086–2094. doi: 10.1249/01.mss.0000235359.16685.a3. [DOI] [PubMed] [Google Scholar]
- 8.Federal Interagency Forum on Child and Family Statistics. America's Children in Brief: Key National Indicators of Well-Being, 2008. Washington, DC: US Government Printing Office; 2008
- 9.Capizzano J, Main R. Many Young Children Spend Long Hours in Child Care. 2005 March 31;:22. 2005. [Google Scholar]
- 10.Pate RR, Pfeiffer KA, Trost SG, Ziegler P, Dowda M. Physical activity among children attending preschools. Pediatrics. 2004 Nov;114(5):1258–1263. doi: 10.1542/peds.2003-1088-L. [DOI] [PubMed] [Google Scholar]
- 11.Pate RR, McIver K, Dowda M, Brown WH, Addy C. Directly observed physical activity levels in preschool children. J Sch Health. 2008 Aug;78(8):438–444. doi: 10.1111/j.1746-1561.2008.00327.x. [DOI] [PubMed] [Google Scholar]
- 12.Brown WH, Pfeiffer KA, McIver K, et al. Social and Environmental Factors Associated With Preschoolers' Nonsedentary Physical Activity. Child Development. 2009 January/February;80(1):45–58. doi: 10.1111/j.1467-8624.2008.01245.x. 2009. [DOI] [PMC free article] [PubMed] [Google Scholar]
- 13.Patrick K, Norman GJ, Calfas KJ, et al. Diet, physical activity, and sedentary behaviors as risk factors for overweight in adolescence. Arch Pediatr Adolesc Med. 2004 Apr;158(4):385–390. doi: 10.1001/archpedi.158.4.385. [DOI] [PubMed] [Google Scholar]
- 14.Gortmaker SL, Peterson K, Wiecha J, et al. Reducing obesity via a school-based interdisciplinary intervention among youth: Planet Health. Arch Pediatr Adolesc Med. 1999 Apr;153(4):409–418. doi: 10.1001/archpedi.153.4.409. [DOI] [PubMed] [Google Scholar]
- 15.Epstein LH, Valoski AM, Vara LS, et al. Effects of decreasing sedentary behavior and increasing activity on weight change in obese children. Health Psychol. 1995 Mar;14(2):109–115. doi: 10.1037//0278-6133.14.2.109. [DOI] [PubMed] [Google Scholar]
- 16.Story M, Kaphingst KM, French S. The role of child care settings in obesity prevention. Future Child. 2006 Spring;16(1):143–168. doi: 10.1353/foc.2006.0010. [DOI] [PubMed] [Google Scholar]
- 17.Finn K, Johannsen N, Specker B. Factors associated with physical activity in preschool children. J Pediatr. 2002 Jan;140(1):81–85. doi: 10.1067/mpd.2002.120693. [DOI] [PubMed] [Google Scholar]
- 18.Ward DS, Vaughn A, McWilliams C, Hales D. Interventions for increasing physical activity at child care. Med Sci Sports Exerc. Mar;42(3):526–534. doi: 10.1249/MSS.0b013e3181cea406. [DOI] [PubMed] [Google Scholar]
- 19.NASPE National Standards. Active Start: A Statement of Physical Activity Guidelines for children Birth to Five Years. Reston, VA: NASPE Publications; 2002
- 20.Preventing Childhood Obesity in Early Care and Education: Selected Standards from Caring for Our Children: National Health and Safety Perfomance Standards; Guidelines for Early Care and Education Program, 3rd Edition. Aurora, CO: National Resource Center for Health and Safety in Child Care and Early Education; 2010. Sep, American Academy of Pediatrics, American Public Health Association, National Resource Center for Health and Safety in Child Care and Early Education. [Google Scholar]
- 21.Dowda M, Brown WH, McIver KL, et al. Policies and characteristics of the preschool environment and physical activity of young children. Pediatrics. 2009 Feb;123(2):e261–e266. doi: 10.1542/peds.2008-2498. [DOI] [PMC free article] [PubMed] [Google Scholar]
- 22.Cardon G, Van Cauwenberghe E, Labarque V, Haerens L, De Bourdeaudhuij I. The contribution of preschool playground factors in explaining children's physical activity during recess. Int J Behav Nutr Phys Act. 2008;5:11. doi: 10.1186/1479-5868-5-11. [DOI] [PMC free article] [PubMed] [Google Scholar]
- 23.Bower JK, Hales DP, Tate DF, Rubin DA, Benjamin SE, Ward DS. The childcare environment and children's physical activity. Am J Prev Med. 2008 Jan;34(1):23–29. doi: 10.1016/j.amepre.2007.09.022. [DOI] [PubMed] [Google Scholar]
- 24.Whitaker RC, Gooze RA, Hughes CC, Finkelstein DM. A national survey of obesity prevention practices in Head Start. Arch Pediatr Adolesc Med. 2009 Dec;163(12):1144–1150. doi: 10.1001/archpediatrics.2009.209. [DOI] [PubMed] [Google Scholar]
- 25.McWilliams C, Ball SC, Benjamin SE, Hales D, Vaughn A, Ward DS. Best-practice guidelines for physical activity at child care. Pediatrics. 2009 Dec;124(6):1650–1659. doi: 10.1542/peds.2009-0952. [DOI] [PubMed] [Google Scholar]
- 26.Benjamin SEGM, Traub AE, Finkelstein J. Preventing Childhood Obesity in the Child Care Setting: Evaluating State Regulations. Boston, MA: Harvard Medical School and Harvard Pilgrim Health Care; 2009. [Google Scholar]
- 27.Alhassan S, Sirard JR, Robinson TN. The effects of increasing outdoor play time on physical activity in Latino preschool children. Int J Pediatr Obes. 2007;2(3):153–158. doi: 10.1080/17477160701520108. [DOI] [PubMed] [Google Scholar]
- 28.Sallis JF, Prochaska JJ, Taylor WC. A review of correlates of physical activity of children and adolescents. Med Sci Sports Exerc. 2000 May;32(5):963–975. doi: 10.1097/00005768-200005000-00014. [DOI] [PubMed] [Google Scholar]
- 29.Poest CA, Williams JR, Witt DD, Atwood ME. Physical Activity Patterns of Preschool Children. Early Childhood Research Quarterly. 1989;4:367–376. [Google Scholar]
- 30.Copeland KSS, Saelens B, Kalkwarf H. Benefits and Barriers to Physical Activity in Child Care: Staff Perceptions; Paper presented at: International Conference on Physical Activity and Obesity in Children; Toronto, Canada: 2007. Jun 24–27, [Google Scholar]
- 31.Copeland KA, Sherman SN, Kendeigh CA, Saelens BE, Kalkwarf HJ. Flip flops, dress clothes, and no coat: clothing barriers to children's physical activity in child-care centers identified from a qualitative study. Int J Behav Nutr Phys Act. 2009;6:74. doi: 10.1186/1479-5868-6-74. [DOI] [PMC free article] [PubMed] [Google Scholar]
- 32.Ammerman A, Benjamin SE, Sommers J, Ward D. The Nutrition and Physical Activity Self-Assessment for Child Care (NAP SACC) Raleigh and Chapel Hill, NC: Division of Public Health, NC DHHS, and the Center for Health Promotion and Disease Prevention; 2004. [Google Scholar]
- 33.Ammerman AS, Ward DS, Benjamin SE, et al. An intervention to promote healthy weight: Nutrition and Physical Activity Self-Assessment for Child Care (NAP SACC) theory and design. Prev Chronic Dis. 2007 Jul;4(3):A67. [PMC free article] [PubMed] [Google Scholar]
- 34.Benjamin SE, Neelon B, Ball SC, Bangdiwala SI, Ammerman AS, Ward DS. Reliability and validity of a nutrition and physical activity environmental self-assessment for child care. Int J Behav Nutr Phys Act. 2007;4:29. doi: 10.1186/1479-5868-4-29. [DOI] [PMC free article] [PubMed] [Google Scholar]
- 35.Fowler FJ. Improving Survey Questions. Vol 38. Thousand Oaks: Sage Publications; 1995. [Google Scholar]
- 36.Drennan J. Cognitive interviewing: verbal data in the design and pretesting of questionnaires. J Adv Nurs. 2003 Apr;42(1):57–63. doi: 10.1046/j.1365-2648.2003.02579.x. [DOI] [PubMed] [Google Scholar]
- 37.American Academy of Pediatrics APHA, National Resource Center for Health and Safety in Child Care, editor. Caring for our Children: National Health and Safety Performance Standards: Guidelines for Out-of-Home Child Care Programs. U.S. Department of Health and Human Services Health Resources and Services Administration Maternal and Child Health Bureau; 2002 ed.
- 38.Iowa Department Public Health HCCI. [Accessed September 23, 2010];Child Care Weather Watch. http://www.idph.state.ia.us/hcci/common/pdf/weatherwatch.pdf.
- 39.Burdette HL, Wadden TA, Whitaker RC. Neighborhood safety, collective efficacy, and obesity in women with young children. Obesity (Silver Spring) 2006 Mar;14(3):518–525. doi: 10.1038/oby.2006.67. [DOI] [PubMed] [Google Scholar]
- 40.Lumeng JC, Appugliese D, Cabral HJ, Bradley RH, Zuckerman B. Neighborhood safety and overweight status in children. Arch Pediatr Adolesc Med. 2006 Jan;160(1):25–31. doi: 10.1001/archpedi.160.1.25. [DOI] [PubMed] [Google Scholar]
- 41.Zhu X, Lee C. Walkability and safety around elementary schools economic and ethnic disparities. Am J Prev Med. 2008 Apr;34(4):282–290. doi: 10.1016/j.amepre.2008.01.024. [DOI] [PubMed] [Google Scholar]
- 42.Lovasi GS, Hutson MA, Guerra M, Neckerman KM. Built environments and obesity in disadvantaged populations. Epidemiol Rev. 2009;31:7–20. doi: 10.1093/epirev/mxp005. [DOI] [PubMed] [Google Scholar]
- 43.U.S. Department of Agriculture (USDA) [Accessed 9-23-2010];Child and Adult Care Food Program. http://www.fns.usda.gov/cnd/care/
- 44.Harms T, Clifford RM, Cryer D. Early Childhood Environment Rating Scale: revised edition. New York, NY: Teachers College Press; 2005. [Google Scholar]