Summary
Cancer cells utilize complex mechanisms to remodel their bioenergetic properties. We exploited the intrinsic genomic stability of xeroderma pigmentosum C (XPC) to understand the interrelationships between genomic instability, reactive oxygen species (ROS) generation, and metabolic alterations during neoplastic transformation. We showed that knockdown of XPC (XPCKD) in normal human keratinocytes results in metabolism remodeling through NADPH oxidase-1 (NOX-1) activation, which in turn leads to increased ROS levels. While enforcing antioxidant defenses by overexpressing catalase, CuZnSOD, or MnSOD could not block the metabolism remodeling, impaired NOX-1 activation abrogates both alteration in ROS levels and modifications of energy metabolism. As NOX-1 activation is observed in human squamous cell carcinomas (SCCs), the blockade of NOX-1 could be a target for the prevention and the treatment of skin cancers.
Keywords: Genomic stability, Warburg effect, Metabolism, ROS, XPC, NADPH oxidase, antioxidant enzymes
1. Introduction
Nucleotide excision repair (NER) is the major pathway for repairing numerous types of DNA damage including helix-distorting lesions produced mostly by ultraviolet (UV) radiation and bulky lesions created by carcinogenic chemicals [1]. This system includes two distinct sub-pathways: global genome repair (GGR), which repairs DNA damage throughout the genome, and transcription-coupled repair (TCR), which repairs DNA lesions within the transcribed strand of active genes [2]. The pivotal role of NER is demonstrated in xeroderma pigmentosum (XP), Cockayne syndrome, and trichothiodystrophy, three dermatological diseases that manifest skin photosensitivity [1]. Patients with XP exhibit extreme sensitivity to solar UV light and have a disproportionately high incidence of skin cancers [1, 3]. XP patients are also at increased risk of developing several types of internal malignancies before the age of 20 [4]. There are multiple subtypes of XP that have been defined on the basis of complementation groups and defective factors (XPA to XPG). Among XP patients, XPC patients have a deficiency in the expression or activity of XPC protein, an important DNA damage recognition protein involved in GGR. Therefore, in these patients, that have proficient TCR and defective GGR, the cells accumulate mutations, notably UVB-induced photoproducts such as cyclobutane pyrimidine dimers (CPD) and 6-4 photoproducts (6-4pp), in non-transcribed parts of the genome, leading to neoplastic transformation [1]. It has also been shown that XPC knockout mice have heightened predisposition to many types of UV-induced and spontaneous cancers [5, 6], indicating that XPC plays a role in the removal of non-UV-related mutations as well. Moreover, lymphocytes from XPC−/− mice accumulate spontaneous lesions in the hypoxanthine guanine phosphoribosyl transferase (HPRT) gene [7]. Interestingly, the most frequent mutations observed in older mice (i.e. over one-year old) are G to T transversions, which also result from oxidative processes [7], suggesting a causative role for ROS. Measurement of ROS levels indicated higher levels of ROS in XPC cells compared to control fibroblasts, suggesting a role of XPC in cell metabolism [8]. Here, we assessed the effect of XPC downregulation on the modification of ROS levels and metabolism alteration. We found that downregulation of XPC in normal human keratinocytes resulted in increased intracellular ROS levels, genomic and mitochondrial DNA oxidation, and altered metabolism, which resembles the bioenergetic signature of most cancer cells.
2. Materials and methods
2.1. Source and culture of cells
Normal human keratinocytes were isolated from normal human skin in patients undergoing plastic surgery as previously described [9, 10]. Briefly, fresh skin fragments were cut into 5 mm × 5 mm pieces and treated with trypsin-EDTA overnight at 4°C, which allows for separation of the epidermis from the dermis. Keratinocytes were seeded at a concentration of 105 cells per cm2 in KGM medium supplemented with hydrocortisone, epidermal growth factor, insulin and bovine pituitary extract (all from Lonza, Walkersville, MD). The medium was changed three times a week. When the cultures reached 70%–80% confluence, the cells were detached with 10% trypsin-EDTA and then resuspended in KGM medium.
2.2. Irradiation procedure and determination of CPD repair kinetics
Keratinocytes were irradiated at a dose of 40 mJ/cm2 using a Biotronic device (Vilber Lourmat, Marne la Vallée, France) equipped with a dosimeter. The UVB lamp emitted a continuous spectrum between 280 and 380 nm (major peak at 312 nm) [11].
CPD repair efficiency was determined as already described [12]. Briefly, exponentially growing asynchronous keratinocytes were exposed to UVB. At different time intervals after irradiation, cells were fixed with 4% formaldehyde for 10 min at room temperature and then permeabilized overnight in cold 70% ethanol. Cells were then resuspended in 0.5% Triton-X-100/2N HCl for 10 min at room temperature. After washing with Tris-base 1M (pH 10) and then with PBS, keratinocytes were incubated overnight at 4°C with 100 μl PBS-TF (4% FBS/0.25% Tween-20/PBS) containing a 1:100 dilution of anti-CPD (Kamiya Biomedical) antibodies. After washing twice with PBS, cells were resuspended in 100 μl PBS-TF containing Alexa-Fluor 533-coupled secondary antibody (1:200) for 1 h at room temperature. Repair kinetics was then monitored using flow cytometry (FACSCalibur, Becton Dickinson) to quantify the change in mean fluorescence over time.
2.3. Lentiviral vectors constructs and keratinocyte transduction
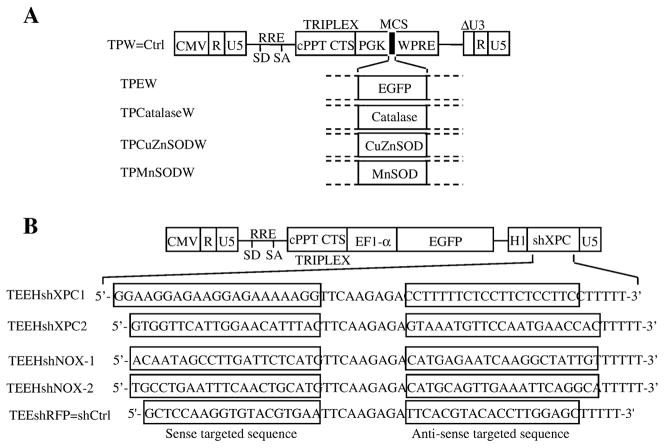
The different lentiviral vectors were constructed by inserting catalase, CuZnSOD, and MnSOD cDNAs into the multiple cloning site (MCS) of the TPW vector downstream of the human phosphoglycerate kinase (hPGK) promoter as previously described (Figure 1A) [10]. TPW was also used as the backbone for the construction of the TEEHshXPC1, TEEHshXPC2, TEEHshNOX-1, TEEHshNOX-2 and TEEHshRFP by replacement of the hPGK promoter by the EF-1α promoter and inserting a cassette containing the H1 promoter followed by shRNA sequences targeting either the XPC, NOX-1, or NOX-2 mRNA or by a sequence targeting the dsRed (red fluorescent protein) mRNA, as control (shCtrl) (Figure 1B). Lentiviral particles were produced by transient transfection of 293T cells using a calcium phosphate transfection technique as previously described [10]. Determination of the titer of each viral supernatant was performed by assessing enhanced-green fluorescent protein (EGFP) expression by flow cytometry and by enzyme-linked immunosorbent assays of p24. For transduction, keratinocytes (5 × 10⁵ cells per T25 flasks) were incubated for 24 h in complete medium. Prior to infection, the medium was removed, and the cells were incubated with viral supernatants for 24 h at 37°C in the presence of 8 μg/ml of protamine sulfate. After five days, the percentage of EGFP-positive cells was determined by cytofluorimetry [10].
Figure 1. Vector constructs and analysis of the transduction efficiency.
(A) Lentiviral vectors constructs used to overexpress EGFP, catalase, CuZnSOD, or MnSOD are shown. Vectors carry an internal cassette for the enhanced green fluorescent protein (EGFP), catalase, CuZnSOD, or MnSOD driven by the promoter of human phosphoglycerate kinase gene (hPGK).
Δ U3, R, and U5 are the LTR regions, with a deletion that includes the enhancer and the promoter from U3. CMV is the cytomegalovirus promoter, SD is the major splice donor site, SA is the splice acceptor site, RRE is the rev-response element, cPPT is a nuclear import sequence, and WPRE is a regulatory element of woodchuck hepatitis virus. (B) Lentiviral constructs used to inhibit XPC, NOX1, NOX2, or red fluorescent protein (RFP) expressions are shown. TEEHshRFP construct was used as the control shRNA (named shCtrl) plasmid.
2.4. Western blotting procedure
Western blotting was performed as previously described [10]. Briefly, equal amounts of total protein were resolved by SDS-polyacrylamide gel electrophoresis (SDS-PAGE) and electrophoretically transferred to PVDF membranes. The membranes were then incubated overnight at 4°C with a 1:1000 dilution of the anti-XPC (GeneTex, San Antonio, TX), anti-MnSOD, anti-CuZnSOD (Santa Cruz Biotechnology, Inc., Santa Cruz, CA), and anti-catalase (Rockland) antibodies. After additional incubation with a 1:10,000 dilution of an anti-immunoglobin horseradish peroxidase-linked antibody (Vector Laboratories, Burlingame, CA) for 1 h, blots were developed using the chemiluminescence ECL reagent (Amersham, Piscataway, NJ).
2.5. Measurement of glucose consumption and lactate production
Glucose consumption and lactate production was measured using colorimetric assay kits according to the manufacturer (both from BioVision, Mountain View, CA). Briefly, two days before each time point, the medium was changed. At indicated time points, 1 ml of medium was collected for the measurement of glucose and lactate levels. Cells in each plate were then harvested, counted, and the total protein concentration was measured by the BCA kit reagent (Pierce, Bezons, France). The levels of glucose uptake and the lactate production were normalized per mg of protein at the indicated time points. The results were then standardized to the shCtrl levels and were expressed as the average percentage of shCtrl levels at each time point.
2.6. Measurement of endogenous and mitochondrial ATP production
The amount of intracellular ATP was measured by a luciferin/luciferase-based assay. In brief, the cells were trypsinized, rinsed with PBS, and lysed with 0.2 mL of cell lysis reagent. ATP concentrations in the cell lysates were quantified using an ATP bioluminescence assay kit HSII (Roche Applied Science, Indianapolis, IN) in accordance with the manufacturer's instructions. A standard curve for ATP concentration was plotted using standard ATP solution. ATP levels were calculated and normalized to protein lysate concentrations. To assess the ATP levels produced by mitochondria, the cells were incubated with 1 mM of iodoacetate for 5 min before they were trypsinized. Iodoacetate is an inhibitor of glycolysis since it inhibits glyceraldehyde 3-phosphate dehydrogenase. Therefore, ATP generation by the cells following this treatment must be a consequence of oxidative phosphorylation (OXPHOS) activity. In addition, the extent of mitochondrial ATP production was verified by using antimycin A. After treatment, the cells were subjected to the same procedures as the untreated cells.
2.7. Complex IV (cytochrome c-oxidase) activity
Cytochrome c-oxidase activity was determined spectrophotometrically with cytochrome c (II) as the substrate. The oxidation of cytochrome c was monitored at 550 nm at 30°C using a double-wavelength Xenius spectrophotometer from SAFAS (Monaco) and standardized reproducible methods as described by Bernard et al [13].
2.8. RNA extraction and quantitative real-time RT-PCR
Total cellular RNA was extracted using TRIzol® (Invitrogen, CA) according to the manufacturer’s instructions. Total cellular RNA (2 μg) was reverse transcribed at 42°C for 60 min using the 1st Strand cDNA synthesis kit (Roche Applied Science). Real-time RT-PCR was carried out for NOX-1, NOX-2, and GAPDH. The reactions were cycled 40 times after initial polymerase activation (50°C, 2 min) and initial denaturation (95°C, 15 min) using the following parameters: denaturation at 95°C for 15 sec, annealing at 58°C for 45 sec, and extension at 60°C for 1 min. A final fusion cycle (95°C, 30 s; 60°C, 30 s; 95°C, 30 s) terminated these reactions. Forward and reverse primers for NOX-1 were 5’-CCGCACACTGAGAAAGCAAT-3’ and 5’-CCGGACAATTCCACCAAT-3, and for GAPDH were 5’-TCATTGACCTCAACTACATGGTTT-3’ and 5’-GGCATGGACTGTGGTCATGAG TC-3’. The analysis of Nox-2 mRNA was performed by two-step real time RT-PCR. For the first-round PCR, forward and reverse primers were 5’-GGAAACCCTCCTATGACTTGG-3’ and 5’-GCCCATCAACCGCTATCTTA-3’ giving a 380bp product. For the second-round nested PCR, forward and reverse nested primer were 5’-TCATCACCAAGGTGGTCACT-3’ and 5’-GGGCGGATGTCAGTGTAAAA-3’ giving a 210bp product.
2.9. Measurement of intracellular ROS
The intracellular production of ROS was assessed using a CM-H2DCF-DA [5-(and-6)-chloromethyl-2',7'-dichlorodihydrofluorescein diacetate, acetyl ester] cytoplasmic probe or the MitoSOXTM red mitochondrial superoxide indicator (both from Molecular Probes, Invitrogen) [10]. Briefly, after addition of CM-H2DCF-DA (5 μM) or MitoSOX (5 μM), the cells were incubated for 15 min at 37°C in the dark. While CM-H2DCF is oxidized by cytoplasmic ROS to the highly green fluorescent CM-DCF [5-(and-6)-chloromethyl-2',7'-dichlorofluorescein] compound, MitoSOX is targeted to the mitochondria and oxidized by superoxide to a red fluorescence component. After two washes with PBS, the cells were detached by trypsin-EDTA and immediately analyzed by flow cytometry. Ten thousand individual data points were collected for each sample.
2.10. Determination of catalase, CuZnSOD and MnSOD activities
All these assays were performed as previously described [10] using the SOD assay kit-WST (Dojindo Molecular Technologies, Gaithersburg, MD) and the Amplex Red Catalase Assay Kit (Molecular Probes, Invitrogen).
2.11. Detection of NADPH Oxidase activity in cell-free system
NADPH oxidase activity was measured in plasma membranes obtained from skin specimens. Briefly, skin specimens were treated with 3 mM diisopropylfluorophosphate for 15 min on ice and resuspended in 1 mL of phosphate-buffered saline containing 1 mM phenylmethylsulfonyl fluoride, 2 μM leupeptin, 2 μM pepstatin, and 10 μM 1-chloro-3-tosylamido-7-amino-2-heptanone. Following sonication, the homogenate was centrifuged at 1,000 × g for 15 min at 4°C. The supernatant was withdrawn and centrifuged 12,000 × g. The supernatant was centrifuged at 100,000 × g for 1 h at 4°C. The supernatant was referred to as the cytosol, and the pellet consisting of crude membranes was resuspended in the same lysis buffer. Plasma membrane were added to a reaction mixture containing 20 mM glucose, 20 μM GTPγS, 5 mM MgCl2, and arachidonic acid in a final volume of 100 μl. After incubation for 10 min at 25°C, the oxidase activation was initiated in the presence of 100 μM cytochrome c and 150 μM NADPH. The specificity of the O2− production was checked by adding 50 μg/ml superoxide dismutase to stop the kinetic reduction as well as by pretreatment with DPI. The reduction of cytochrome c is monitored by the increase of cytochrome c absorbance at 550 nm.
2.12. Morphological studies of mitochondria and morphometry
To observe the mitochondria network by fluorescence confocal microscopy, keratinocytes grown on 6-well plates were incubated with MitoTracker (Molecular Probes) 150 nM for 20 min at 37°C for. After two washes in PBS, the cells were observed and photographed under a FluoView laser scanning inverted microscope (Nikon). The morphology of the mitochondrial network was studied by using Mitotracker Green (Invitrogen), the objective used was a Plan Apochromat 60.0X/1.4/0.21 oil spring loaded. The images were acquired using the EZ-C1 Gold Version 3.2 build 610, as follow (at 37°C): the pinhole was set at 33.3 μm and the image size was 1024 × 1024. The step size was 0.5 μm, and the acquisition time of the Z-series set at 10 frames per second. The number of images was adapted to the width of each cells determined individually. The reconstitution of the three-dimensional images was performed using Imaris Software (Bitplane). Fifty cells per experimental condition were selected randomly on 5 different images, and the analysis of mitochondrial tubule length was performed with the morphometric software "Morpho. Pro" by Explora Nova (France). It allowed to select automatically the region of interest (i.e the mitochondrial tubule), and to calculate the length occupied by the selected pixels. In each cell, 25 tubules were measured. The tubules were divided in four categories based on their size, those <5, between 5 and 10, between 10 and 20, and those >20 μm. Results expressed as average percentage of size distribution ± SD of three independent experiments.
2.13. Quantification of 8-oxo-dG in nuclear and mitochondrial DNA
8-oxodG adducts in nuclear and mitochondrial DNA were quantified using an enzyme-linked immunoabsorbent assay kit (Trevigen) in accordance with the manufacturer’s instructions. Briefly, following nuclear and mitochondrial DNA isolation, 1 μg of DNA was incubated with anti-8-oxodG antibody overnight at 4°C. The samples were then added to 96-well microtiter plates containing bound albumin:8-oxodG adducts and incubated at room temperature for 2 h. The plate was then washed and incubated with a peroxidase-coupled secondary antibody for one hour. After washing, tetramethybenzidene substrate was added to each well and incubated for 15 min in the dark. After addition of the stop solution, absorbance has been measured at 450 nm. Results were calculated based on a standard curve that was run simultaneously.
2.14. Statistics
Statistical analyses were performed using one-way ANOVA tests, followed by post-hoc Tukey’s tests. A p-value of < 0.05 was considered significant. Results are presented as means ± SD.
3. Results
3.1. XPC downregulation results in increased oxidative stress in both nuclear and mitochondrial compartments
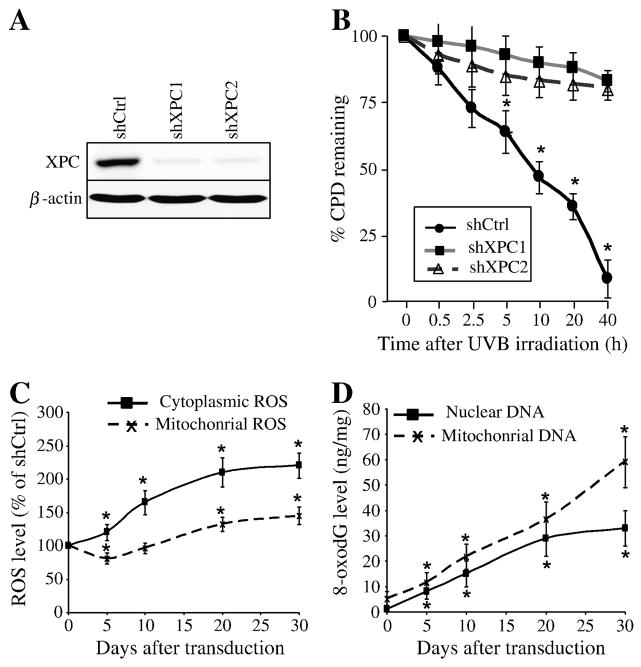
To determine the effect of XPC expression on ROS levels, the XPC protein expression was first inhibited using lentivirus-mediated expression of short hairpin RNA (shRNA) against XPC (Figure 1B). To rule out “off target“ effects of shXPC, all experiments were performed with two distinct shRNAs against XPC. Both shXPCs stably inhibited more than 92% of XPC expression in keratinocytes (Figure 2A). To test the functional effect of XPC downregulation on DNA repair, we evaluated the repair kinetics of CPDs, the most frequent types of photolesions, which are removed primarily by NER [14]. While 91 ± 7% of CPDs in shCtrl-transduced cells were gradually removed by 40 h following UVB irradiation, the rate of CPDs repair in keratinocytes transduced with shXPC1 or shXPC2 was 17 ± 5% and 20 ± 4%, respectively (Figure 2B). Since both shRNA had similar effects, hereafter only the results of shXPC1 have been shown.
Figure 2. Effects of XPC downregulation on intracellular ROS levels and genomic and mitochondrial DNA oxidation.
(A) Efficiency of XPC silencing was checked by western blotting analysis. (B) To evaluate the functional effect of XPC silencing on DNA repair, keratinocytes were harvested at different times after UVB-irradiation and levels of CPD were analyzed by flow cytometry following fluorescent immunostaining with the corresponding specific antibody. The percentage of CPDs remaining at different time points after irradiation was evaluated and the results are expressed as the mean ± SD of 3 independent experiments. (C) ROS levels in shCtrl- and shXPC-transduced cells were measured by flow cytometry using cytoplasmic- and mitochondrial-specific probes on the indicated days after transduction. The ROS level in the shCtrl-transduced cells was arbitrarily set to 100. Results are expressed as the mean ± SD of three independent experiments. *, p<0.05 for shXPC-transduced cells vs shCtrl-transduced cells at the indicated time points. (D) Genomic and mitochondrial DNA oxidation were assessed by quantification of 8-oxodG levels in nuclear genome and mtDNA of different cells. Results are expressed as ng of 8-oxodG per μg of DNA. Results are expressed as the mean ± SD of three independent experiments. *, p<0.05 for shXPC-transduced cells vs shCtrl-transduced cells at the indicated time points. shCtrl, keratinocytes transduced with control shRNA; shXPC, keratinocytes transduced with shXPC.
We then characterized the role of XPC silencing on ROS production. To this end, we measured the cytoplasmic and mitochondrial steady-state levels of ROS using CM-H2DCF-DA and MitoSOX probes, respectively (Figure 2C). XPC silencing resulted in a significant increase in cytoplasmic ROS level over time in comparison to control cells. In contrast, a moderate, but significant, decrease in mitochondrial ROS level was found five days after XPC downregulation, followed by a gradual increase that peaked 30 days post-transduction.
Since ROS can lead to oxidative DNA damage, we determined the level of genomic and mitochondrial DNA (mtDNA) oxidation using an antibody directed against 7,8-dihydro-8-oxoguanine (8-oxodG) (Figure 2D). Results showed that 8-oxodG increased in the nuclear genome and in the mtDNA after XPC silencing in a time-dependent manner. These data indicate that XPC silencing-induced ROS generation results in increased oxidative stress in both the nuclear and mitochondrial compartments.
3.2. Overexpression of antioxidant enzymes does not block ROS generation induced by XPC silencing
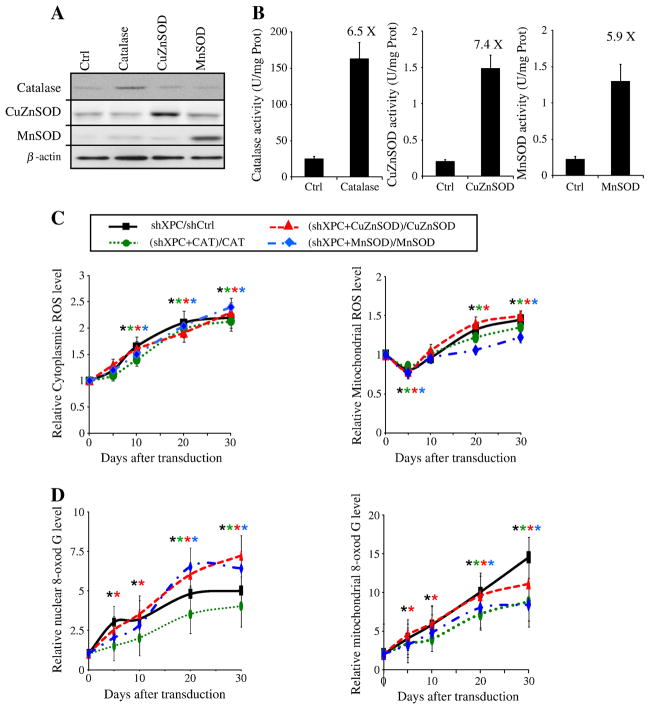
To determine the origin of the ROS, we further investigated the role of antioxidant enzymes on ROS levels. To this end, we used overexpression of catalase, CuZnSOD, or MnSOD (Figure 1A). First of all, the efficiency of keratinocyte transduction with various vectors expressing EGFP, catalase, CuZnSOD, or MnSOD was determined by assessing EGFP-positive cell percentage and by measuring catalase-, MnSOD-, and CuZnSOD-specific activities and proteins (Figure 3A, B). The percentage of EGFP-positive cells, determined by cytofluorimetry five days post-transduction, was between 85% and 95%. The increase in the amount of catalase, MnSOD, and CuZnSOD proteins was assayed by western blotting (Figure 3A). Corresponding enzyme activities were measured after five days of culture (Figure 3B). In the cells transduced by catalase, CuZnSOD, or MnSOD the activity of each enzyme was 6.5-fold for catalase, 7.4-fold for CuZnSOD, and 5.9 fold for MnSOD compared to Ctrl cells. Transduction of cells by catalase-expressing vector did not affect SOD activity or vice-versa. Overexpression of catalase, CuZnSOD, and MnSOD significantly decreased the steady-state levels of endogenous ROS, but could not block ROS generation induced by XPC silencing (Figure 3C), suggesting that enforcing the antioxidant defenses is not sufficient to inhibit XPC knockdown-induced ROS generation. Whereas the overexpression of CuZnSOD yielded limited effects on XPC silencing-induced 8-oxodG formation, the overexpression of catalase or MnSOD resulted in a significant reduction of 8-oxodG accumulation in mtDNA (Figure 3D). Nonetheless, the overexpression of these antioxidant enzymes could not completely block 8-oxodG accumulation in the nuclear genome and mtDNA.
Figure 3. Overexpression of Catalase, MnSOD, or CuZnSOD has no effect on XPC-silencing-induced ROS generation.
(A, B) Transduction efficacy was checked by western blotting analysis (A) and also by measuring the specific activity of each antioxidant enzyme in the keratinocytes (B) as described in the Materials and Methods section. (C) Intracellular ROS levels were measured in keratinocytes transduced with shCtrl, shXPC, catalase, CuZnSOD and/or MnSOD, on different days following transduction using CM-H2DCF-DA, the cytoplasmic probe, or MitoSOX, the mitochondrial probe by flow cytometry. Data are assessed as shown on the top of the planes and expressed as the mean ± SD of 3 independent experiments. (D) Genomic and mitochondrial DNA oxidation were assessed by quantification of 8-oxodG levels in nuclear genome and mtDNA of different cells. Results are then assessed as shown on the top of the panels and expressed as the mean ± SD of three independent experiments.
3.3. Activation of NADPH oxidase-1 is responsible of ROS generation in XPCKD
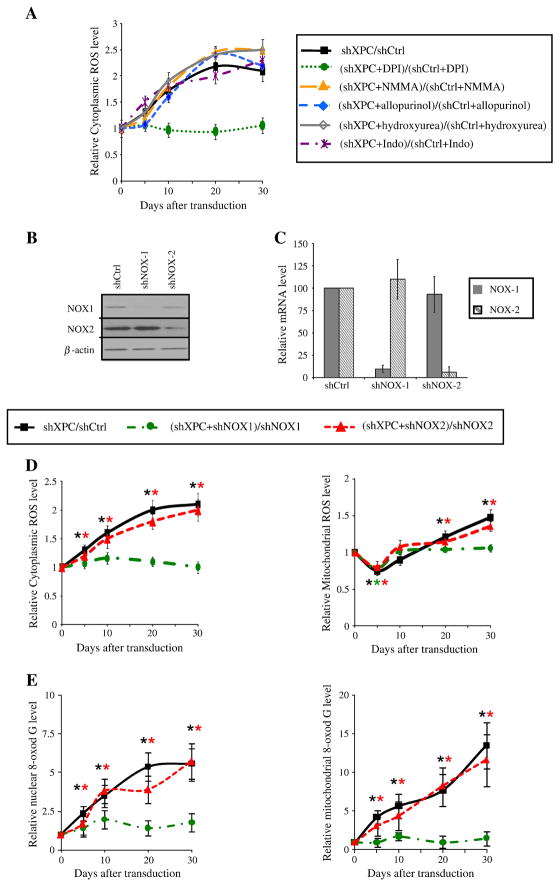
Under physiological conditions, ROS are generated by mitochondria via enzyme complexes involved in oxidative phosphorylation. Numerous cytosolic enzymes including cyclooxygenase, nitric oxide synthase, xanthine oxidase, and the plasma membrane-bound NADPH oxidase can also generate ROS. To determine the origin of XPC silencing-induced cytoplasmic ROS generation, cells were treated with the various inhibitors of cytosolic ROS-generating enzymes: NG-Monomethyl-arginine (NMMA, 100 μM), an inhibitor of nitric oxide synthase; allopurinol (100 μM), an inhibitor of xanthine oxidase; hydroxyurea (1.5 mM), an inhibitor of ribonucleotide reductase; indomethacin (100 μM), an inhibitor of cyclooxygenase (COX); and diphenyl-iodonium (DPI, 2.5 μM), an inhibitor of cytoplasmic
NAPDH oxidase. While treatment of cells with the inhibitor of nitric oxide synthase, xanthine oxidase, ribonucleotide reductase, or COX had not effect on ROS generation after XPC downregulation, DPI treatment completely blocked the increase in cytoplasmic ROS levels (Figure 4A), suggesting an obvious role for NADPH oxidase in ROS production. NADPH oxidase consists of six hetero-subunits that, when activated, associate to form an active enzyme complex generating O2− from oxygen using NADPH as electron donor [15]. The catalytic subunit of this complex, NOX, has seven homologous members termed NOX-1 to NOX5, Duox-1, and Duox-2. It has been shown that among NOX isozymes, NOX-1 and NOX-2 are expressed in keratinocytes [16, 17]. NOX proteins are involved in host defense, post-translational processing of proteins, cell signaling, regulation of gene expression, and cell differentiation [15]. To further characterize the role of NADPH oxidase in ROS production in XPCKD, NOX-1 and NOX-2 protein expression was inhibited using lentivirus-mediated expression of shRNA against NOX-1 and NOX-2 (Figure 1B). shNOX-1 and shNOX-2 stably inhibited more than 90% of NOX-1 and NOX-2 protein and mRNA expression in keratinocytes, respectively (Figure 4B, C). We next examined the effects of NOX-1 or NOX-2 downregulation on ROS levels in XPCKD cells. Our results indicated that NOX-2 has no involvement in ROS generation in XPCKD (Figure 4D). In contrast, NOX-1 downregulation completely blocked both cytoplasmic and mitochondrial ROS generation in XPCKD (Figure 4D). Our data further indicated that downregulation of NOX-1 (but not NOX-2) blocked the oxidative effects of XPC silencing on genomic and mitochondrial DNA (Figure 4E). Taken together, our results demonstrate that NADPH oxidase-1 activation plays an essential role in the XPC-silencing induced oxidative stress.
Figure 4. Inhibition of NOX-1 expression blocks the effect of XPC downregulation on ROS levels.
(A) Cytoplasmic and mitochondrial ROS levels were measured in shXPC transduced cells. The effect of different inhibitors on XPC silencing-induced ROS production was assessed as shown at the top of the panels. (B, C) Transduction efficacy was checked by western blotting analysis (B) and also by measuring the mRNA expression of NOX-1 and NOX-2 in the keratinocytes (C). (D) The effect of NOX-1 and NOX-2 downregulation on XPC silencing-induced cytoplasmic and mitochondrial ROS production was assessed as shown on the top of the panels. Results are expressed as the mean ± SD of 3 independent experiments. (E) Genomic and mitochondrial DNA oxidation were assessed by quantification of 8-oxodG levels in nuclear genome and mtDNA of different cells. Results are then assessed as shown on the top of the panels and expressed as the mean ± SD of three independent experiments.
3.4. XPC downregulation results in mitochondrial bioenergetics deficiency through NOX-1 activation
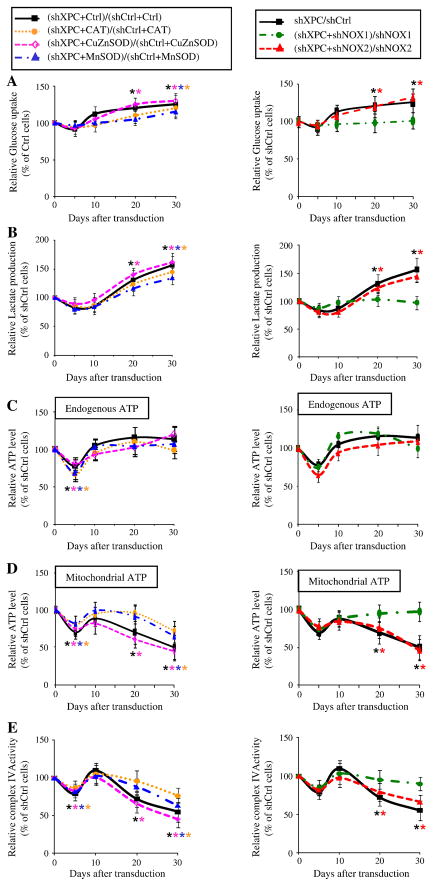
Since one of the mechanisms explaining metabolism remodeling (the Warburg effect) during tumorigenesis is oxidative stress due to elevated ROS levels [18–21], we wondered whether increased ROS levels in XPCKD cells results in metabolism alteration. To test this concept, we first measured glucose consumption and lactate production in shCtrl- and shXPC-transduced keratinocytes over 30 days following transduction. Results revealed that XPCKD cells exhibited lactic acidosis at 20 and 30 days post-transduction (Figure 5A, B). ATP levels were similar in shCtrl- and shXPC-transduced keratinocytes on different days post-transduction (Figure 5C), although decreased ATP production occurred five days after shXPC transduction. To determine whether XPCKD are more dependent on glycolysis or OXPHOS for ATP generation, the ATP level was measured in the presence of iodoacetate, an inhibitor of glycolysis. ATP levels were decreased to a greater extent in the iodoacetate-treated XPCKD cells as compared to control keratinocytes on days 20 and 30 (Figure 5D). The ATP produced by the mitochondrion in entire cells results from the oxidation of the pyruvate generated by glycolysis, and the oxidation of several other fuels, such as glutamine, glycine, alanine, proline and ketone bodies which do not require glycolysis [22]. Therefore, iodoacetate treatment will block the synthesis of the ATP linked to glycolysis both directly and indirectly (i.e. through the oxidation of pyruvate by OXPHOS). Yet, in most rapidly growing cancer cells, the pyruvate generated by glycolysis is mainly transformed in lactate by the LDH and very little enters the Krebs cycle [23]. In our study, reduction of the total ATP levels measured in presence of iodoacetate in cells XPCKD cells indicates a higher dependence of these cells on glycolysis to generate ATP, both directly and indirectly. Finally, to determine whether OXPHOS activity is affected by XPC downregulation, we assessed the complex IV activity. Results showed that the complex IV activity also diminished following XPC downregulation (Figure 5E).
Figure 5. XPC silencing drives metabolism remodeling via NOX-1 activation.
Glucose consumption (A), lactate production (B) as well as the total endogenous ATP level (C) and ATP level produced by mitochondria (D), and the relative activity of complex IV of the mitochondrial respiratory chain (E) were measured at the indicated time points after transduction with different vectors as shown on the top of the panels. The glucose uptake, lactate production, and the total endogenous and mitochondrial ATP levels by shCtrl-transduced cells were set to 100% at each time point. The results were then compared to the shCtrl and are expressed as the average percentage of shCtrl ± SD of three independent experiments. *, p<0.05 for different transduced cells vs shCtrl-transduced cells.
We further investigated the role of ROS in metabolism remodeling using XPCKD cells overexpressing the antioxidant enzymes, catalase, CuZnSOD, or MnSOD, as well as cells with downregulation of NOX-1 or NOX-2. Results revealed that neither the overexpression of antioxidants enzymes, nor the downregulation of NOX-2 abrogated XPC silencing-induced increased glucose uptake, elevated lactate production, and decreased ATP generation by mitochondria. In contrast, the downregulation of NOX-1 in XPCKD restored glucose consumption (Figure 5A), lactate production (Figure 5B), and mitochondrial ATP production (Figure 5C, D).
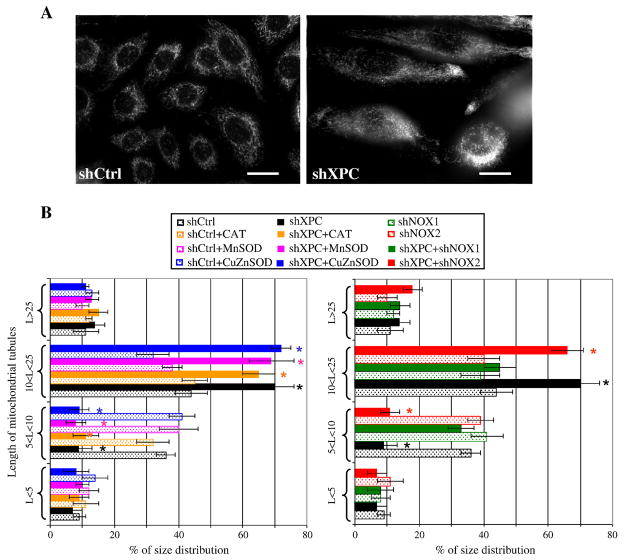
Mitochondrial morphology is linked to bioenergetics and changes in the state of mitochondrial energy result in structural alterations of the mitochondrial network [24]. To determine whether XPC downregulation affects mitochondrial network morphology, cells were stained with a MitoTracker probe. Normal keratinocytes demonstrated an interconnected network located predominantly around the nucleus, while XPCKD displayed a larger tubular mitochondrial network more dispersed throughout the cytoplasm (Figure 6A, B). Interestingly, NOX-1 downregulation, but not the overexpression of antioxidant enzymes or NOX-2 downregulation, blocked XPC silencing-induced alterations in mitochondrial network morphology (Figure 6B). A similar dispersion of the mitochondrial network occurs in situations of moderate OXPHOS deficiency triggered by pathogenic mutations in complex I [25, 26] or by pharmacological inhibitions of the mitochondrial respiratory chain [27, 28].
Figure 6. XPC silencing triggers modification in mitochondrial network modification.
(A) The mitochondrial network morphology in shCtrl- and shXPC-transduced keratinocytes was determined by microscopy using Mito Tracker. (B) Length of mitochondrial tubules was measured in 50 cells (25 mitochondrial tubules per cell) per condition. Results are expressed as average percentage of mitochondrial tubule size distribution ± SD of 3 independent experiments. *, p<0.05 for different transduced cells vs shCtrl-transduced cells.
Taken together, our results demonstrate that XPC silencing in normal human keratinocytes leads to the alteration of metabolism, which resembles the metabolic signature of most cancer cells. These results also indicate that variations in glycolysis and mitochondrial metabolism following XPC downregulation are dependent on the upregulation of NADPH oxidase-1.
3.5. NOX-1 expression is increased in skin SCC
Since we have already shown that XPC silencing in normal human keratinocytes drives the formation of SCC [29] and the activation of the NOX family has been shown in many cancer cells [19], we sought to investigate the NOX activity in skin tumors. To this end, we first assessed the activity of NADPH oxidase in skin specimens from healthy individuals (HNS; n = 15), foreskin (n = 15), human SCC (HSCC; n = 15), and human BCC (HBCC; n = 15) (Figure 7A). Results showed higher NADPH oxidase activity in HSCC compared to HNS or foreskin.
Figure 7. Overexpression of NOX-1 in SCC.
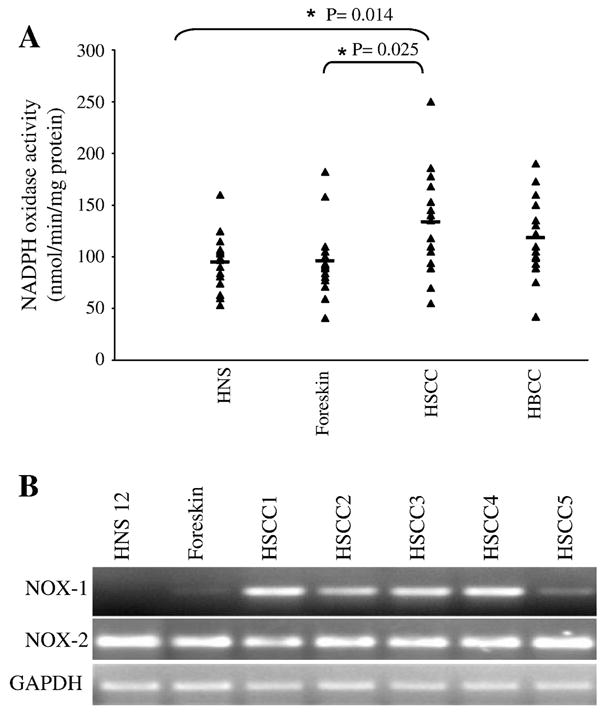
(A) NADPH oxidase activity was measured in human skin specimens obtained from healthy individuals (HNS), foreskins, human SCC (HSCC) and human BCC (HBCC). Measurements of individual samples and mean values are shown. (B) The mRNA expression levels of NOX-1 and NOX-2 were analyzed by real time RT-PCR in mention samples.
To confirm the in situ observation, the mRNA expression of NOX-1 and NOX-2 in SCC was analyzed. Interestingly, while the mRNA expression of NOX-2 in HSCC and HNS or foreskin did not show substantial differences, NOX-1 expression was significantly higher in HSCC compared to HNS or foreskin (Figure 7B), suggesting that the blocking of NOX-1 activation might offer an interesting target for the prevention and the treatment of human SCC.
4. Discussion
Bioenergetics studies of cancer cells led Otto Warburg to show that aerobic glycolysis (up to pyruvate/lactate) is generally, but not exclusively, increased in malignant cells and that these cells are constitutively more dependent on the glycolytic pathway for ATP generation, even under oxygen-sufficient conditions [30]. Warburg proposed that a respiratory deficiency might facilitate neoplastic transformation [30]. Current data revealed that a large number of cancer cell lines have a higher rate of glycolysis, an increased rate of glucose transport, increased pentose phosphate pathway activity, decreased numbers of mitochondria, and a reduction in mitochondrial OXPHOS proteins and activities [18, 20, 31–33]. Mechanistic studies have linked those metabolism alterations to somatic mutations in mtDNA, increased ROS, adaptation to tissue hypoxia [18–21], activation of oncogenes and/or inactivation of tumor suppressors (TP53, HIF-1α, c-MYC), as well as deregulation of PI3K/AKT, which influence the glycolytic flux through the regulation of different factors (reviewed in [34]).
However, the etiologic relationship between genomic mutations, the Warburg effect, and increased ROS levels in tumor induction remains unclear [19, 20, 35]. We speculated that XPC- deficient cells, which have a heightened predisposition to malignant transformation and are capable of accumulating the mutations in the non-transcribed part of genome, could be helpful in elucidating the link between genomic mutations and modified cellular bioenergetics, and ROS.
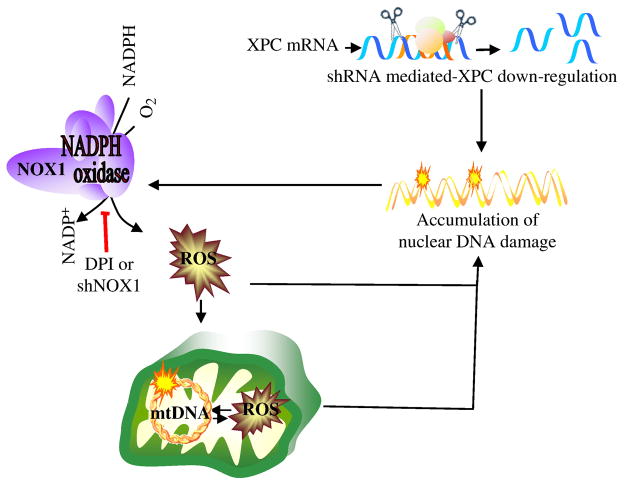
We showed that XPC silencing results in NOX-1 activation and subsequently increased cytoplasmic ROS levels. Cytoplasmic ROS generation will consequently lead to the enhanced oxidation of nuclear and mitochondrial DNA, followed by the induction of mitochondrial ROS in an amplification loop of DNA damage ↔ ROS (Figure 8). It is likely that OXPHOS deficiency could amplify oxidative mtDNA damage. In fact, our results show that 8-oxodG accumulation in mtDNA deletions increase concomitantly with decreased mitochondrial metabolism. Consistent with this, Ishii et al. [36] reported that a mutation in the cytochrome b gene of Caenorhabditis elegans enhances oxidative stress and shortens lifespan, indicating that a defect in the mitochondrial respiratory system can lead to increased oxidative damage. Similarly, inhibition of OXPHOS by deleting a mitochondrial adenine nucleotide translocase (ANT) augments ROS levels and deletions and rearrangements in mtDNA [37]. This model also explains why we obtain increased mitochondrial 8-oxodG levels before the detection of increased mitochondrial ROS. In fact, cytoplasmic ROS, especially H2O2 which cannot be detected by Mitosox, pass through the mitochondrial membrane and result in the induction of oxidative mtDNA damage, i.e. 8-oxodG. It is likely that NOX activation-induced increased cytoplasmic ROS leads to enhanced oxidation of nuclear and mitochondrial DNA, followed by alterations in mitochondrial bioenergetics. Interestingly, inhibition of NOX-1 activation, thanks to NOX-1 knockdown or treatment with DPI, inhibits the Warburg effect in XPCKD, indicating that NOX activation-induced ROS generation is the cause of the Warburg effect in XPCKD. One of the proposed mechanisms explaining the Warburg effect is the occurrence of a deficiency in mitochondrial respiration during cell growth due to somatic mutations in mtDNA or increased oxidative stress [18, 19]. Mutations in mtDNA have consistently been found to correlate with the 8-OxodG content in mtDNA [38]. Elevated ROS generation due to environmental insults (i.e., UV irradiation [39, 40], ionizing radiation [41]) or by xenobiotics [39, 40] has also been shown to lead to mtDNA deletions. Intraperitoneal injection of doxorubicin into mice shows that oxidative stress causes large-scale deletions of mtDNA in in vivo systems [42]. Furthermore, a decreased antioxidant defense system in the mitochondria of MnSOD knockout mice leads to enhanced oxidative damage and reduced OXPHOS activity [43]. Our results illustrate that overexpression of catalase or MnSOD in XPCKD cells results in a significant reduction of 8-oxodG accumulation in mtDNA, but could not completely abrogate XPC silencing-induced cytoplasmic and mitochondrial ROS generation and subsequent oxidation of nuclear and mitochondrial DNA (Figure 3).
Figure 8. A model outlining cellular responses to XPC downregulation.
Lentivirus-mediated XPC silencing in normal human keratinocytes impairs DNA repair efficiency and results in the activation of NOX-1. Cytoplasmic ROS generation will consequently increase, leading to enhanced oxidation of nuclear and mitochondrial DNA, followed by the induction of mtDNA damage, enhancement of mitochondrial ROS production, and alterations in mitochondrial bioenergetics.
Consistent with our data supporting that XPC silencing results in oxidative damage, XPC-deficient cells have been shown to be more sensitive to oxidative stress [44, 45]. XPC knock-out transgenic mice studies reveal the high frequency of the spontaneous lung tumors and hepatocellular adenomas [46]. Spontaneous mutation frequencies in the HPRT gene are 30-fold higher in the spleen of XPC−/− mice compared to normal mice and the majority of these mutations result from oxidative damage [7]. Furthermore, the predisposition to UV-induced skin cancer in XPC−/− mice has been shown to be enhanced if these animals are also heterozygous for Apex [47], a gene coding the apurinic/apyrimidinic endonuclease which is a key enzyme in the base excision repair, required for the repair of spontaneous base damage that arises as a result of oxidative damage to DNA. Interestingly, the kinetics of cancer induction in XPC−/− mice that are heterozygous additionally for both p53 and Apex is indistinguishable from that in XPC−/− mice heterozygous for just p53 [47], suggesting that the enhanced predisposition to skin cancer in XPC−/−Apex+/− animals could result from oxidative stress-induced loss of p53 activity.
In conclusion, we demonstrated that NOX-1 activation induced by XPC silencing can result in ROS generation and the Warburg effect. This effect may be relevant to the pathophysiology of common skin cancers.
Acknowledgments
We thank Yucui Zhu, M.D. and Catherine Pain for technical assistance. This work was supported by the French National Plan “maladies rares” and the GENESKIN European coordination action LSHM-CT-2005-512117 to AT, a grant from “Enfants de la lune” to HV and AT, the NIH Grant R03 CA125855-01 to ALK and 5P30 ES009089.
Footnotes
Publisher's Disclaimer: This is a PDF file of an unedited manuscript that has been accepted for publication. As a service to our customers we are providing this early version of the manuscript. The manuscript will undergo copyediting, typesetting, and review of the resulting proof before it is published in its final citable form. Please note that during the production process errors may be discovered which could affect the content, and all legal disclaimers that apply to the journal pertain.
References
- 1.Cleaver JE. Cancer in xeroderma pigmentosum and related disorders of DNA repair. Nat Rev Cancer. 2005;5:564–573. doi: 10.1038/nrc1652. [DOI] [PubMed] [Google Scholar]
- 2.Hanawalt PC. Subpathways of nucleotide excision repair and their regulation. Oncogene. 2002;21:8949–8956. doi: 10.1038/sj.onc.1206096. [DOI] [PubMed] [Google Scholar]
- 3.van Steeg H, Kraemer KH. Xeroderma pigmentosum and the role of UV-induced DNA damage in skin cancer. Mol Med Today. 1999;5:86–94. doi: 10.1016/s1357-4310(98)01394-x. [DOI] [PubMed] [Google Scholar]
- 4.Kraemer KH, Lee MM, Scotto J. Xeroderma pigmentosum. Cutaneous, ocular, and neurologic abnormalities in 830 published cases. Arch Dermatol. 1987;123:241–250. doi: 10.1001/archderm.123.2.241. [DOI] [PubMed] [Google Scholar]
- 5.Hollander MC, Philburn RT, Patterson AD, Velasco-Miguel S, Friedberg EC, Linnoila RI, Fornace AJ., Jr Deletion of XPC leads to lung tumors in mice and is associated with early events in human lung carcinogenesis. Proc Natl Acad Sci U S A. 2005;102:13200–13205. doi: 10.1073/pnas.0503133102. [DOI] [PMC free article] [PubMed] [Google Scholar]
- 6.Miccoli L, Burr KL, Hickenbotham P, Friedberg EC, Angulo JF, Dubrova YE. The combined effects of xeroderma pigmentosum C deficiency and mutagens on mutation rates in the mouse germ line. Cancer Res. 2007;67:4695–4699. doi: 10.1158/0008-5472.CAN-06-3844. [DOI] [PubMed] [Google Scholar]
- 7.Wijnhoven SW, Kool HJ, Mullenders LH, van Zeeland AA, Friedberg EC, van der Horst GT, van Steeg H, Vrieling H. Age-dependent spontaneous mutagenesis in Xpc mice defective in nucleotide excision repair. Oncogene. 2000;19:5034–5037. doi: 10.1038/sj.onc.1203844. [DOI] [PubMed] [Google Scholar]
- 8.Frechet M, Warrick E, Vioux C, Chevallier O, Spatz A, Benhamou S, Sarasin A, Bernerd F, Magnaldo T. Overexpression of matrix metalloproteinase 1 in dermal fibroblasts from DNA repair-deficient/cancer-prone xeroderma pigmentosum group C patients. Oncogene. 2008;27:5223–5232. doi: 10.1038/onc.2008.153. [DOI] [PubMed] [Google Scholar]
- 9.Rezvani HR, Ged C, Bouadjar B, de Verneuil H, Taieb A. Catalase overexpression reduces UVB-induced apoptosis in a human xeroderma pigmentosum reconstructed epidermis. Cancer Gene Ther. 2008;15:241–251. doi: 10.1038/sj.cgt.7701102. [DOI] [PubMed] [Google Scholar]
- 10.Rezvani HR, Cario-Andre M, Pain C, Ged C, deVerneuil H, Taieb A. Protection of normal human reconstructed epidermis from UV by catalase overexpression. Cancer Gene Ther. 2007;14:174–186. doi: 10.1038/sj.cgt.7701000. [DOI] [PubMed] [Google Scholar]
- 11.Rezvani HR, Mazurier F, Cario-Andre M, Pain C, Ged C, Taieb A, de Verneuil H. Protective effects of catalase overexpression on UVB-induced apoptosis in normal human keratinocytes. The Journal of biological chemistry. 2006;281:17999–18007. doi: 10.1074/jbc.M600536200. [DOI] [PubMed] [Google Scholar]
- 12.Rezvani HR, Mahfouf W, Ali N, Chemin C, Ged C, Kim AL, de Verneuil H, Taieb A, Bickers DR, Mazurier F. Hypoxia-inducible factor-1alpha regulates the expression of nucleotide excision repair proteins in keratinocytes. Nucleic Acids Res. 38:797–809. doi: 10.1093/nar/gkp1072. [DOI] [PMC free article] [PubMed] [Google Scholar]
- 13.Benard G, Faustin B, Passerieux E, Galinier A, Rocher C, Bellance N, Delage JP, Casteilla L, Letellier T, Rossignol R. Physiological diversity of mitochondrial oxidative phosphorylation. Am J Physiol Cell Physiol. 2006;291:C1172–1182. doi: 10.1152/ajpcell.00195.2006. [DOI] [PubMed] [Google Scholar]
- 14.Mitchell DL. The relative cytotoxicity of (6-4) photoproducts and cyclobutane dimers in mammalian cells. Photochem Photobiol. 1988;48:51–57. doi: 10.1111/j.1751-1097.1988.tb02785.x. [DOI] [PubMed] [Google Scholar]
- 15.Bedard K, Krause KH. The NOX family of ROS-generating NADPH oxidases: physiology and pathophysiology. Physiol Rev. 2007;87:245–313. doi: 10.1152/physrev.00044.2005. [DOI] [PubMed] [Google Scholar]
- 16.Chamulitrat W, Stremmel W, Kawahara T, Rokutan K, Fujii H, Wingler K, Schmidt HH, Schmidt R. A constitutive NADPH oxidase-like system containing gp91phox homologs in human keratinocytes. J Invest Dermatol. 2004;122:1000–1009. doi: 10.1111/j.0022-202X.2004.22410.x. [DOI] [PubMed] [Google Scholar]
- 17.Valencia A, Kochevar IE. Nox1-based NADPH oxidase is the major source of UVA-induced reactive oxygen species in human keratinocytes. J Invest Dermatol. 2008;128:214–222. doi: 10.1038/sj.jid.5700960. [DOI] [PubMed] [Google Scholar]
- 18.Brandon M, Baldi P, Wallace DC. Mitochondrial mutations in cancer. Oncogene. 2006;25:4647–4662. doi: 10.1038/sj.onc.1209607. [DOI] [PubMed] [Google Scholar]
- 19.Clerkin JS, Naughton R, Quiney C, Cotter TG. Mechanisms of ROS modulated cell survival during carcinogenesis. Cancer Lett. 2008;266:30–36. doi: 10.1016/j.canlet.2008.02.029. [DOI] [PubMed] [Google Scholar]
- 20.Gatenby RA, Gillies RJ. Why do cancers have high aerobic glycolysis? Nat Rev Cancer. 2004;4:891–899. doi: 10.1038/nrc1478. [DOI] [PubMed] [Google Scholar]
- 21.Gottlieb E, Tomlinson IP. Mitochondrial tumour suppressors: a genetic and biochemical update. Nat Rev Cancer. 2005;5:857–866. doi: 10.1038/nrc1737. [DOI] [PubMed] [Google Scholar]
- 22.Ralph SJ, Rodriguez-Enriquez S, Neuzil J, Moreno-Sanchez R. Bioenergetic pathways in tumor mitochondria as targets for cancer therapy and the importance of the ROS-induced apoptotic trigger. Molecular aspects of medicine. 31:29–59. doi: 10.1016/j.mam.2009.12.006. [DOI] [PubMed] [Google Scholar]
- 23.Reitzer LJ, Wice BM, Kennell D. Evidence that glutamine, not sugar, is the major energy source for cultured HeLa cells. The Journal of biological chemistry. 1979;254:2669–2676. [PubMed] [Google Scholar]
- 24.Rossignol R, Gilkerson R, Aggeler R, Yamagata K, Remington SJ, Capaldi RA. Energy substrate modulates mitochondrial structure and oxidative capacity in cancer cells. Cancer Res. 2004;64:985–993. doi: 10.1158/0008-5472.can-03-1101. [DOI] [PubMed] [Google Scholar]
- 25.Koopman WJ, Visch HJ, Smeitink JA, Willems PH. Simultaneous quantitative measurement and automated analysis of mitochondrial morphology, mass, potential, and motility in living human skin fibroblasts. Cytometry A. 2006;69:1–12. doi: 10.1002/cyto.a.20198. [DOI] [PubMed] [Google Scholar]
- 26.Koopman WJ, Visch HJ, Verkaart S, van den Heuvel LW, Smeitink JA, Willems PH. Mitochondrial network complexity and pathological decrease in complex I activity are tightly correlated in isolated human complex I deficiency. Am J Physiol Cell Physiol. 2005;289:C881–890. doi: 10.1152/ajpcell.00104.2005. [DOI] [PubMed] [Google Scholar]
- 27.Benard G, Bellance N, James D, Parrone P, Fernandez H, Letellier T, Rossignol R. Mitochondrial bioenergetics and structural network organization. J Cell Sci. 2007;120:838–848. doi: 10.1242/jcs.03381. [DOI] [PubMed] [Google Scholar]
- 28.Benard G, Rossignol R. Ultrastructure of the mitochondrion and its bearing on function and bioenergetics. Antioxid Redox Signal. 2008;10:1313–1342. doi: 10.1089/ars.2007.2000. [DOI] [PubMed] [Google Scholar]
- 29.Rezvani HR, Kim AL, Rossignol R, Ali N, Daly M, Mahfouf W, Bellance N, Taïeb A, de Verneuil H, Mazurier F, Bickers DR. XPC silencing in normal human keratinocytes triggers metabolic alterations that drive the formation of squamous cell carcinomas. J Clin Invest. 2011;121:195–211. doi: 10.1172/JCI40087. [DOI] [PMC free article] [PubMed] [Google Scholar]
- 30.Warburg O. On the origin of cancer cells. Science. 1956;123:309–314. doi: 10.1126/science.123.3191.309. [DOI] [PubMed] [Google Scholar]
- 31.Modica-Napolitano JS, Singh KK. Mitochondria as targets for detection and treatment of cancer. Expert Rev Mol Med. 2002;4:1–19. doi: 10.1017/S1462399402004453. [DOI] [PubMed] [Google Scholar]
- 32.Smolkova K, Bellance N, Scandurra F, Genot E, Gnaiger E, Plecita-Hlavata L, Jezek P, Rossignol R. Mitochondrial bioenergetic adaptations of breast cancer cells to aglycemia and hypoxia. J Bioenerg Biomembr. 42:55–67. doi: 10.1007/s10863-009-9267-x. [DOI] [PubMed] [Google Scholar]
- 33.Bellance N, Benard G, Furt F, Begueret H, Smolkova K, Passerieux E, Delage JP, Baste JM, Moreau P, Rossignol R. Bioenergetics of lung tumors: alteration of mitochondrial biogenesis and respiratory capacity. Int J Biochem Cell Biol. 2009;41:2566–2577. doi: 10.1016/j.biocel.2009.08.012. [DOI] [PubMed] [Google Scholar]
- 34.Yeung SJ, Pan J, Lee MH. Roles of p53, MYC and HIF-1 in regulating glycolysis - the seventh hallmark of cancer. Cell Mol Life Sci. 2008;65:3981–3999. doi: 10.1007/s00018-008-8224-x. [DOI] [PMC free article] [PubMed] [Google Scholar]
- 35.Pelicano H, Carney D, Huang P. ROS stress in cancer cells and therapeutic implications. Drug Resist Updat. 2004;7:97–110. doi: 10.1016/j.drup.2004.01.004. [DOI] [PubMed] [Google Scholar]
- 36.Ishii N, Fujii M, Hartman PS, Tsuda M, Yasuda K, Senoo-Matsuda N, Yanase S, Ayusawa D, Suzuki K. A mutation in succinate dehydrogenase cytochrome b causes oxidative stress and ageing in nematodes. Nature. 1998;394:694–697. doi: 10.1038/29331. [DOI] [PubMed] [Google Scholar]
- 37.Esposito LA, Melov S, Panov A, Cottrell BA, Wallace DC. Mitochondrial disease in mouse results in increased oxidative stress. Proc Natl Acad Sci U S A. 1999;96:4820–4825. doi: 10.1073/pnas.96.9.4820. [DOI] [PMC free article] [PubMed] [Google Scholar]
- 38.Lu CY, Lee HC, Fahn HJ, Wei YH. Oxidative damage elicited by imbalance of free radical scavenging enzymes is associated with large-scale mtDNA deletions in aging human skin. Mutat Res. 1999;423:11–21. doi: 10.1016/s0027-5107(98)00220-6. [DOI] [PubMed] [Google Scholar]
- 39.Berneburg M, Kamenisch Y, Krutmann J. Repair of mitochondrial DNA in aging and carcinogenesis. Photochem Photobiol Sci. 2006;5:190–198. doi: 10.1039/b507380d. [DOI] [PubMed] [Google Scholar]
- 40.Wei YH, Lee HC. Oxidative stress, mitochondrial DNA mutation, and impairment of antioxidant enzymes in aging. Exp Biol Med (Maywood) 2002;227:671–682. doi: 10.1177/153537020222700901. [DOI] [PubMed] [Google Scholar]
- 41.Prithivirajsingh S, Story MD, Bergh SA, Geara FB, Ang KK, Ismail SM, Stevens CW, Buchholz TA, Brock WA. Accumulation of the common mitochondrial DNA deletion induced by ionizing radiation. FEBS Lett. 2004;571:227–232. doi: 10.1016/j.febslet.2004.06.078. [DOI] [PubMed] [Google Scholar]
- 42.Adachi K, Fujiura Y, Mayumi F, Nozuhara A, Sugiu Y, Sakanashi T, Hidaka T, Toshima H. A deletion of mitochondrial DNA in murine doxorubicin-induced cardiotoxicity. Biochem Biophys Res Commun. 1993;195:945–951. doi: 10.1006/bbrc.1993.2135. [DOI] [PubMed] [Google Scholar]
- 43.Melov S, Coskun P, Patel M, Tuinstra R, Cottrell B, Jun AS, Zastawny TH, Dizdaroglu M, Goodman SI, Huang TT, Miziorko H, Epstein CJ, Wallace DC. Mitochondrial disease in superoxide dismutase 2 mutant mice. Proc Natl Acad Sci U S A. 1999;96:846–851. doi: 10.1073/pnas.96.3.846. [DOI] [PMC free article] [PubMed] [Google Scholar]
- 44.D'Errico M, Parlanti E, Teson M, de Jesus BM, Degan P, Calcagnile A, Jaruga P, Bjoras M, Crescenzi M, Pedrini AM, Egly JM, Zambruno G, Stefanini M, Dizdaroglu M, Dogliotti E. New functions of XPC in the protection of human skin cells from oxidative damage. Embo J. 2006;25:4305–4315. doi: 10.1038/sj.emboj.7601277. [DOI] [PMC free article] [PubMed] [Google Scholar]
- 45.Melis JP, Wijnhoven SW, Beems RB, Roodbergen M, van den Berg J, Moon H, Friedberg E, van der Horst GT, Hoeijmakers JH, Vijg J, van Steeg H. Mouse models for xeroderma pigmentosum group A and group C show divergent cancer phenotypes. Cancer Res. 2008;68:1347–1353. doi: 10.1158/0008-5472.CAN-07-6067. [DOI] [PubMed] [Google Scholar]
- 46.Wijnhoven SW, Hoogervorst EM, de Waard H, van der Horst GT, van Steeg H. Tissue specific mutagenic and carcinogenic responses in NER defective mouse models. Mutat Res. 2007;614:77–94. doi: 10.1016/j.mrfmmm.2005.12.018. [DOI] [PubMed] [Google Scholar]
- 47.Cheo DL, Meira LB, Burns DK, Reis AM, Issac T, Friedberg EC. Ultraviolet B radiation-induced skin cancer in mice defective in the Xpc, Trp53, and Apex (HAP1) genes: genotype-specific effects on cancer predisposition and pathology of tumors. Cancer Res. 2000;60:1580–1584. [PubMed] [Google Scholar]


