

Abstract
It is known from experiments that in the presence of soluble antigen, B-cell receptors (BCRs) assemble into microclusters and then collect into a macrocluster known as a ‘cap'. However, the mechanisms of BCR cluster formation during recognition of soluble antigens remain unclear. In previous work, we demonstrated that effective intrinsic attractions among BCRs can lead to the formation of small microclusters of BCR molecules. The effective intrinsic attractions could be caused by multivalent antigen binding, association with lipid rafts, or other biochemical factors. In the present study, we have developed and studied a Monte Carlo model of BCR clustering mediated by explicit binding and crosslinking of soluble bivalent antigens. Antigen crosslinking is shown to microcluster BCRs in an affinity-dependent manner and also in a biologically relevant timescale; however, antigen crosslinking alone does not appear to be sufficient for the formation of a single macrocluster of receptor molecules. We show that directed transport of BCRs is needed to drive the formation of large macroclusters. We constructed a simple model of directed transport, where BCR molecules diffuse towards the largest cluster or towards a random BCR microcluster, which results in a single macrocluster of receptor molecules. The mechanisms for both types of directed transport are compared using network-based metrics. We also develop and use appropriate network measures to analyze the effect of BCR and antigen concentration on BCR clustering, the stability of the formed clusters over time and the size of BCR–antigen crosslinked chains.
Keywords: B-cell activation, B-cell receptor, cell signaling, Monte Carlo simulation, receptor clustering
Introduction
B lymphocytes are activated by a series of signaling events that are initially triggered by the binding of antigen (Ag) to B-cell receptors.1, 2 It is known that crosslinking of bivalent B-cell receptors (BCRs) by multivalent soluble Ags can be an important mode of recognition.3, 4, 5, 6, 7 Recent studies indicate that production of antidrug antibodies can be a major limitation of recombinant human protein therapeutics.8 These antibodies are generated due to breakage of B-cell tolerance because B cells perceive repetitive epitopes in aggregated recombinant human self-proteins as soluble foreign Ags. Hence, such an antidrug immune response is also governed by crosslinking of bivalent BCRs. However, the mechanism by which Ag crosslinking modulates B-cell intracellular signaling to discriminate affinity of Ags is unclear.
Experimental studies of B-cell activation by soluble, multivalent Ags have shown that BCRs collect into microclusters upon Ag binding and subsequently a macrocluster of BCR–Ag complexes, or ‘cap', is formed on the B-cell surface.5, 6, 9, 10 However, the formation mechanisms of such BCR clusters as well as their functional roles in the recognition of soluble Ags are not yet fully elucidated. Initial interactions of BCRs with soluble Ags were also addressed by a few recent computational studies.11, 12 In a recent work, we developed an effective model of BCR clustering that is mediated by mutual attraction between BCR molecules.12 Such mutual receptor–receptor attraction can arise due to Ag crosslinking, increased raft association of BCRs upon Ag binding, or some other biophysical mechanisms. However, our results also showed that while mutual attraction between BCRs was sufficient for microcluster generation, it was not sufficient to drive cap formation.
In the present study, we develop a model of BCR clustering mediated by Ag crosslinking that leads to the formation of BCR microclusters. We used a Monte Carlo scheme in which the bivalent BCRs are clustered by bivalent Ags (Figure 1). Crosslinking of bivalent BCRs by bivalent Ags can be thought to be a minimal model for BCR crosslinking by multivalent soluble Ags. A large number of in vitro experimental studies also used such bivalent Ags, such as anti-Ig to elucidate micro- and macroclustering of BCRs.7, 13, 14, 15, 16, 17 Interestingly, we observe that the formation of microclusters is largely dependent on the affinity of Ag for BCRs. In contrast to our earlier study of BCR clustering mediated by intrinsic attraction between BCR molecules, very high receptor or Ag density did not lead to the formation of a single macrocluster. However, we did observe macrocluster formation in the presence of directed transport of BCR molecules by means of a bias in diffusion towards a specific direction, as observed in experiments.18, 19, 20, 21, 22, 23, 24, 25, 26 However, the region towards which BCR molecules will be transported (by a directed transport mechanism) on an otherwise spherically symmetric cell surface is not clear. This is different from the case of membrane-bound Ags where the cell–cell contact region determines the direction of directed transport.19, 20, 21 Due to the lack of experimental evidence about the direction of the BCR molecule's diffusion bias, we explore two possible mechanisms of directed transport of BCR molecules.
Figure 1.

(a) Model representation of BCR–Ag space in which bottom layer (Z=1) is considered as a portion of the B-cell surface, where as the volume between the layers Z=2 to Z=L is considered as the space available for Ag. (b) Representation of various forms of B-cell clustering by Ag crosslinking. Ag, antigen; BCR, B-cell receptor.
Using a set of network metrics, we compared the difference between two proposed scenarios of directed diffusion: (i) towards the largest microcluster; and (ii) towards a randomly chosen microcluster. Quantitative criteria, such as the average BCR interpair distance <S> and the number of neighboring BCR pairs <P> are used to characterize BCR clustering due to Ag crosslinking.12 <S> is defined as the average distance between any two BCRs and <P> is the count of BCR pairs in which both BCRs are adjacent to each other. In addition, the length of BCR–Ag crosslinked chains and the size of BCR microclusters, as well as their variations over time, are also used as metrics for measuring the amount of clustering, especially due to directed transport. The study also addresses the effect of BCR–Ag affinity on directed transport-mediated macrocluster formation.
Materials and methods
Background
We developed a stochastic Monte Carlo simulation procedure to elucidate the mechanisms of receptor clustering in B cells due to crosslinking by bivalent soluble Ags. Monte Carlo methods have been successfully employed in the past to understand immune cell receptor–ligand binding, clustering and signaling.12, 19, 20, 21, 24, 27, 28, 29, 30 In this Monte Carlo algorithm, the molecular population is randomly sampled to undergo events such as diffusion and reaction, with its status updated at every time step.30 A flow chart of the Monte Carlo algorithm used in this study is depicted in Figure 2.
Figure 2.

Monte Carlo algorithm flow chart.
Model setup
Both the BCR and Ag are considered bivalent. We considered a three-dimensional cubic lattice of size L=200 nodes in each direction, and at the bottom of the grid, at Z=1, BCR molecules are uniformly distributed on the B-cell surface, while above the Z=1 plane, Ag is uniformly distributed in the intercellular medium (Figure 1). Due to their bivalent nature, each receptor molecule occupies two lattice points. Bivalent Ag molecules floating in the intercellular medium (from Z=2 to Z=200) also occupy two lattice points. Both BCR and Ag molecules can be oriented along either the X or Y direction. The orientation of BCR and Ag molecules was determined by a coin toss with probability 0.5. At Z=2, Ags come in contact with receptor molecules, and can bind to them with probability Pon.
At every time step in the simulation, a molecule is randomly selected on the three-dimensional grid, and checked whether it is an Ag or a receptor. We attempt either diffusion or reaction for the chosen molecule, determined by means of a coin toss with probability 0.5.
In our model, we choose a nodal spacing of 20 nm, thus simulating a 4 µm×4 µm region for 200×200 nodes. Thus, the simulated area is large enough to model experimentally observed caps (∼10 µm2).31 The explicit simulation of BCR and Ag molecules as individual agents allows us to include the effect of mutual physical exclusion of BCR molecules. The simulated area is believed to be sufficiently large such that a zero net flux condition exists at the boundaries, which in our simulations is implemented by means of fully reflecting boundaries. The various parameters that relate to the spatial dimensions of our model are listed in Table 1.
Table 1. Spatial dimensions of the model.
| Parameter | Value |
|---|---|
| Simulation domain size | 4 µm×4 µm |
| Number of nodes | 200×200 |
| Nodal spacing | 20 nm |
| Radius of B cell | 8 µm |
Reaction
If a BCR or Ag molecule has been selected to undergo a reaction, the first step is to check the opposing node (Z=2 for BCR and Z=1 for Ags) with the same (x, y) coordinates for a complementary molecule. If that is the case, a random number trial with probability Pon is performed to determine if the two molecules will bind together and form a molecular complex. If a BCR molecule is selected for a reaction, one of its two Fab domains is chosen at random and checked for its binding status by means of a binding flag. The binding flag is set to zero if the Fab is free and set to one if an Ag is bound. If the binding flag is zero, the corresponding lattice site at Z=2 is checked for the presence of a free Ag. A crosslinked chain of BCR–Ag molecules can expand to become a microcluster of arbitrary size and shape. If the selected Fab fragment of a BCR molecule is already bound to an Ag molecule, then the molecules may undergo dissociation with probability Poff. The possible reversible reactions are:
BCR+Ag↔BCR–Ag (one bond/two bonds);
BCR–Ag+Ag↔BCR–Ag2;
BCR–Ag+BCR↔BCR2–Ag;
BCR2–Ag+Ag↔BCR2–Ag2.
Diffusion
If a BCR or Ag molecule is selected to undergo diffusion, a random number trial with probability Pdiff is conducted to determine if the diffusion move will occur. BCRs can move in one of four possible directions, chosen randomly in the Z=1 layer. Ags in the Z=2 layer can move in five possible directions (four directions in the plane parallel to the cell surface, plus away from the cell surface), while above the Z=2 layer they can move in six possible directions. If the diffusion trial is successful, the selected molecule will ‘hop' by a distance of one-nodal spacing in the specified direction. Because two molecules are not allowed to occupy the same node, the diffusion hop will only occur if the target node is unoccupied. If the selected molecule had already formed a complex, then the BCR–Ag complex will hop in the chosen direction if all the necessary adjacent nodes are empty. If two or more BCR molecules are crosslinked by Ags as a BCR–Ag chain, diffusion becomes more challenging, as complexity increases with the increasing chain length. We designed the following scheme for performing diffusion moves for large crosslinked BCR chains. The diffusion move takes place in two steps: (i) all the adjacent nodes of every BCR and Ag molecules of the chain need to be checked for occupancy in the chosen direction; and (ii) if the conditions are such that the move is allowed to occur, all the component molecules of a chain of BCR–Ag molecules of arbitrary size need to move. The diffusion rate of crosslinked BCR–Ag chains decreases in proportion to the increase in chain length, as discussed in the ‘Parameters' section below.
Our procedure can simulate directed transport of BCR molecules: (i) towards the largest cluster or (ii) towards a randomly chosen microcluster. We define a biasing factor Pbias such that movement of the BCR molecule towards the largest/random microcluster is bias sampled with probability Pbias. In previous work, we have shown that simulating directed transport by biasing diffusion is equivalent to simulating transport by explicit attachment of receptors to the cytoskeleton.19, 20, 21
Parameters
Monte Carlo simulations are performed for various BCR concentrations (NBCR), Ag concentrations (NAg), and also various parameters such as probability of dissociation (Poff) and probability of bias diffusion (Pbias). The parameter values used in our model are listed in Table 2.
Table 2. Experimentally measured parameters and their probabilistic counterparts.
| Experimental parameter | Measured value | Simulation parameter | Mapped/considered value |
|---|---|---|---|
| Kon BCR/Ag | 104/M s (Refs 36 and 37 | Pon BCR/Ag | 1 |
| Koff BCR/Ag | 102–10−3/s (Refs 36 and 37) | Poff BCR/Ag | 10−1–10−6 |
| BCR concentration | 100–200molecules/µm2 (Ref. 36) | NBCR | 125–300 molecules/µm2 |
| Ag concentration | 10–1000 molecules/µm3 (Ref. 36) | NAg | 16–32 molecules/µm3 |
| D-free molecules | ∼0.01–0.1 µm2/s (Refs 26 and 32) | Diffusion (ΔX) | 0.4 µm2/s |
| Dchain BCR–Ag chain | Pdiff(ch)=1/α | α=number of BCRs in the BCR–Ag crosslinked chain | |
| Time step (ΔT) | 0.001 s |
Abbreviations: Ag, antigen; BCR, B-cell receptor.
The radius of a typical B lymphocyte is assumed to be 8 µm,11 resulting in an overall surface area of ∼800 µm2. The typical number of BCR molecules is assumed to be 105 per B cell, resulting in 125 BCR molecules per µm2.25 The number of BCR molecules in the 4 µm×4 µm simulation domain is thus ∼2000 molecules. The number of Ag molecules is set to ∼16–32 molecules per µm3.13, 14, 15, 16, 17
The diffusion coefficient of free molecules in a biological membrane is in the range of 0.01–0.1 µm2/s.26, 32 Free molecules being the fastest diffusing species in the simulation, we set Pdiff for free molecules equal to 1. As shown in previous work, this leads to an equivalence of 10−3 s per simulation time step.21 The diffusion rate of crosslinked BCR chains (Dc) is inversely proportional to its chain length (Pdiff(ch)=1/α; where α is number of BCRs in the BCR–Ag crosslinked chain).
Affinity is varied by varying Poff, while keeping Pon constant, as is done in recent B-cell activation experiments33, 34 and our previous work.19, 20, 21 The quantities Pon and Poff are directly analogous to the physical on-rate kon and off-rate koff, and their ratio Pon/Poff is directly analogous to the affinity KA=kon/koff. In previous work, we have developed a mapping between Pon, Poff and kon, koff, which allows us to physically interpret the Monte Carlo model's results. Poff can be directly estimated from koff by means of the timescale mapping (1 simulation time step=10−3 s). A Pon/Poff ratio of 1 corresponds to KA=104 M−1.21
Network-based measures for the characterization of receptor micro- and macroclustering
In a previous study, we have shown that network-based metrics such as the average BCR interpair distance <S> and the number of adjacent BCR pairs <P>, can be used to quantitatively characterize various forms of receptor clustering.12 In addition to <S> and <P>, we now consider: (i) the length of the longest BCR–Ag chain; and (ii) the number of BCR molecules in the largest microcluster, even if they are not crosslinked by Ag.
Results
Crosslinking by Ag leads to microcluster formation in an affinity-dependent manner
Crosslinking of bivalent BCRs by Ag resulted in the formation of small microclusters (Figure 3). Figure 3 depicts BCR microclusters formed due to changes in the affinity of BCR–Ag binding. The left and right Fab domains of the BCR molecules are depicted in red and green, respectively. The formation of microclusters is fast (∼100 s) and they are stable over the time, but microcluster formation crucially depended on the affinity of BCR–Ag binding. We observe considerable microcluster formation by 105–106 Monte Carlo time steps (∼100–1000 s). Figure 4 shows the number of adjacent BCR pairs, <P>, which measures the amount of clustering at various Poff values. There is no microclustering above the threshold value of Poff>0.1, and the amount of microclustering increased when the value of Poff decreased. Maximal clustering is observed at Poff=10−5 (Figures 3 and 4). When we decreased the Poff value further, from 10−5 to 10−6, the degree of clustering also decreased. This is due to the effective lowering of the diffusion rate of BCR–Ag complexes arising from very large bound time of BCR–Ag complexes at very low Poff values. As the maximal amount of microclustering is observed at Poff=10−5, we used this value in subsequent simulations. At very low Poff values, Ags cannot further trigger microcluster formation once they are bound to BCR, whereas at very high Poff values the binding time of a BCR–Ag complex is not sufficiently long to result in cluster formation. At intermediate Poff values, Ags serially engage multiple BCR molecules over the course of a single simulation run, leading to effective microcluster formation.23
Figure 3.

BCR microclustering at different BCR–Ag affinity values (NBCR=2000; NAg=2000; L=200; T=106). The left and right Fab domains of the BCR are depicted with red (left) and green (right) colors. Ag, antigen; BCR, B-cell receptor.
Figure 4.

Variation of the average number of adjacent BCR pairs with BCR–Ag affinity. The results are obtained by averaging over 15 simulation runs (NBCR =2000; NAg=2000; L=200; T=106). Ag, antigen; BCR, B-cell receptor.
Effect of variation in BCR and Ag concentrations
When the number of Ag molecules is increased from 1000 to 2000, microclustering is increased as measured by the size distribution of microclusters as well as the number of such clusters (Figure 5a). However, an increase in the concentration of BCR or Ag did not lead to macrocluster formation. When the number of BCR molecules increases from 2000 to 5000 (Figure 5b–d), the size of the microclusters did not seem to grow, but the number of microclusters increased. However, we see an increase in the <P> value with the increase of either Ag or BCR molecules (Figure 6).
Figure 5.

Microclustering of BCR molecules for various values of BCR/Ag (NBCR/NAg) concentrations (Poff=10−5; L=200; T=106). The left and right Fab domains of the BCR are depicted with red (left) and green (right) colors. Ag, antigen; BCR, B-cell receptor.
Figure 6.

Change in the number of adjacent BCR pairs <P>, with the number of BCR molecules (Poff=10−5; L=200; T=106) by antigen crosslinking. The results are obtained by averaging over 15 simulation runs. BCR, B-cell receptor.
Thus, crosslinking by Ag alone could not lead to the formation of a single macrocluster, and from our earlier study,12 it is known that the intrinsic attractions among the free BCRs cannot by itself lead to macrocluster formation at physiological values of BCR concentration. Hence, a directed transport-based mechanism appears necessary to achieve receptor clustering on a large scale (about micrometre size).
Directed transport leads to receptor macroclustering
Directed transport has been implicated in receptor clustering in the form of B-cell immune synapse formation.19, 20, 21, 35 In studies involving membrane-bound Ags, the direction of receptor diffusion is thought to be towards the cell–cell contact region.19 In the case of soluble Ags, there is no cell–cell contact point, and thus no such obvious preferred region toward which receptors would diffuse in a directed manner. This poses a challenge in selecting a direction for directed diffusion of BCRs.
We study two possible cases of directed diffusion: (i) towards the largest microcluster, which, formed at early times by stochastic fluctuation, would trigger the strongest signal inside a B cell and thus would induce directed transport towards itself; and (ii) towards any randomly chosen microcluster. In both cases, receptors aggregated into a single, large macrocluster (Figure 7 and Supplementary Figure 1). When we varied the strength of directed transport (i.e. Pbias), as depicted in Supplementary Figure 2 (NBCR=2000, NAg=2000 and L=200), macrocluster formation is only observed when Pbias is set to greater than 0.1. At Pbias=10−3 or 10−2, no macrocluster formation was observed. The minimum value of Pbias for which macrocluster formation occurs depends on receptor concentration. The shapes of various macroclusters formed are like ‘X' in Figure 7, and linear in Supplementary Figures 1 and 2, which could be artifact of the rectangular area used for the model.
Figure 7.

BCR molecules at regular time intervals (1×10⁶ time steps) during microcluster formation followed by the directed diffusion towards a randomly chosen BCR–Ag chain (NBCR=2000; NAg=2000; Poff=10−5; L=200; T=107; Pbias=1). Two hands of the BCR are depicted with red (left) and green (right) colors. Ag, antigen; BCR, B-cell receptor.
We estimate various network parameters: (i) the length of the longest BCR–Ag chain; (ii) the number of adjacent BCR pairs <P> (iii) the average BCR interpair distance <S> and (iv) the number of BCR molecules in the largest microcluster, for both the scenarios of directed diffusion. It is observed that <S> cannot capture initial microclustering; however, <P> can.12 After the initiation of directed diffusion at time t=T/2 time, the variation in the abovementioned parameters for the case of bias towards the largest microcluster is sharper when compared to the case of directed motion towards a randomly chosen microcluster (Figures 8 and 9).
Figure 8.

Variation in the (a) average BCR interpair distance <S> and (b) number of adjacent BCR pairs <P> with time, for directed diffusion towards the largest microcluster (green) or a randomly chosen microcluster (red). All results are obtained by averaging over 20 simulation runs (NBCR=2000; NAg=2000; Poff=10−5; L=200; T=106; Pbias=1). Data points were recorded 200 time steps before and after the onset of directed transport. BCR, B-cell receptor.
Figure 9.
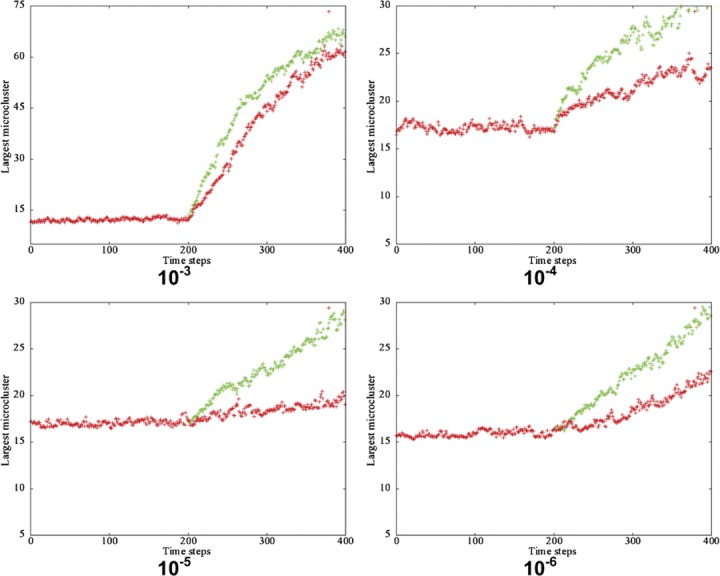
Variation of largest microcluster size with time for directed diffusion towards the largest microcluster (green) or a random microcluster (red). Results obtained by averaging over 20 runs (NBCR=2000; NAg=2000; Poff=10−3 to 10−6; L=200; T=106; Pbias=1). Data points were recorded 200 time steps before and after directed diffusion.
The average BCR interpair distance <S>, and the number of adjacent BCR pairs <P> are evaluated by averaging over 20 Monte Carlo runs and plotted against time (T) (Figure 8). Figure 9 shows the change in the size of the largest microcluster. Data points were recorded and plotted 200 time steps before and after the onset of directed diffusion.
No variation is observed in both <S> and <P> values until the initiation of directed diffusion (Figure 8). However, for both directed diffusion cases: (i) directed diffusion towards the largest microcluster; and (ii) directed diffusion towards a randomly chosen microcluster, we observe a sharp change after the onset of directed diffusion. There is a small decrease in the value of <S> value and the two curves of <S> are identical (Figure 8a), whereas the increase in the value of <P> is significant and is relatively sharper for the case of directed diffusion towards the largest microcluster (green curve).
Following the onset of directed diffusion, an increase in the size of the largest microcluster (Figure 9) is observed for both types of directed diffusion. However, for the case of directed diffusion towards the largest microcluster, the increase was sharper compared to the case of directed diffusion towards a randomly chosen microcluster. Simulations were performed in which BCR–Ag affinity was varied, and we observed that macrocluster formation is slower at higher affinity values (i.e. lower Poff values).
Characterization of micro- and macroclustering
At the beginning of a simulation run, when BCR molecules are randomly distributed, (i) the average BCR interpair distance <S> does not depend on the number of molecules (Supplementary Figure 3a); and (ii) <S> was found to be proportional to the lattice size L (Supplementary Figure 3b). This is analogous to the results from our earlier study of BCR clustering by monovalent Ags.12 When the lattice size is scaled down to L=60, the number of Ag molecules is fixed at 100, and the number of BCR molecules is increased from 100 to 600, <S> did not depend on the number of molecules (Supplementary Figure 3a). When the number of BCR and Ag molecules is fixed at 100 and the lattice size is varied from 20–100, we observed a linear relationship between <S> and lattice size (Supplementary Figure 3b).
Similar to the case of macroclustering of BCRs due to intrinsic attraction,12 we obtained the following simple scaling relations with respect to network metrics: (i) the average BCR interpair distance <S> versus the number of BCR molecules N (Equation (1)) and (ii) the number of adjacent BCR pairs <P> versus the number of BCR molecules N (Equation (2)):
 |
where N is the total number of receptor molecules and l0 is nodal spacing.
 |
When macrocluster formation is driven by directed diffusion, <S> is plotted against the number of molecules (Supplementary Figure 4a) and it is observed that <S> is directly proportional to the square root of the number of molecules. The graph plotted on a log scale confirms the power law increase with a slope of 0.4696. Similarly <P>/N1/2 shows a scaling relation with the number of molecules (Supplementary Figure 4c). However, in the case of microclustering, the number of adjacent BCR pairs <P> results in a simple scaling relation (Supplementary Figure 4d), but not the average BCR interpair distance <S> (Supplementary Figure 4b).
Discussion
In the present study, we have developed a simple model of BCR clustering that occurs due to crosslinking by soluble Ags and late time, signaling-driven directed transport of BCR molecules. Our simulations show that crosslinking of BCRs by bivalent Ags is sufficient to generate microclusters of BCRs. The fact that BCR molecules have two possible orientations (vertical and horizontal) in our simulations allows the formation of two-dimensional microclusters. Increasing Ag valency to values greater than 2 would microcluster BCRs in a manner similar to that observed for bivalent Ags; however, the clusters would be more compact. Microcluster formation by Ag crosslinking is highly dependent on the off-rate, with Poff=10−5 being the optimal off-rate for microcluster formation. However, lipid-mediated interactions might enhance the microcluster formation in a steady manner with decreasing the off-rate. Using the mapping that one of our model's time steps corresponds to 10−3 s, the range of Poff values used in our simulation, 10−1–10−6 corresponds to off-rates of 102–10−3 s−1 (Table 2), comparable to off-rates for BCR–Ag binding found in the experimental literature of the order of 1–10−4 s−1.36, 37 The timescale of microcluster formation in experimental studies of B-cell recognition of soluble Ags was of the order of minutes,36 and correlates with the timescale of 100–1000 s observed in our simulations. The concentration of Ag used in our simulations (∼32 molecules per µm3) is also in the physiological range.13, 14, 15, 16, 17
Microclusters formed by Ag crosslinking fail to coalesce into a single large macrocluster, even at very high Ag concentrations. We therefore introduced intrinsic attractions among free BCR molecules. Such attractions can arise due to raft domain formation upon BCR–Ag crosslinking, something which can further cluster individual BCRs. However, we found that strong BCR intrinsic attraction among unligated receptors led to the formation of large macrocluster only at very high, non-physiological BCR concentrations (Supplementary Figures 5–7). Hence, cap formation implies the presence of an additional clustering mechanism, such as signaling-driven directed transport of receptors. Even though for multivalent (>2) Ags with a large number of epitopes we expect microcluster formation will be easier than for the case of bivalent Ags, it is still difficult for such microclusters to coalesce into one large macrocluster as large microclusters formed due to increased valency will also be slower to merge together. More importantly, previous experiments indicate a directed transport mechanism for cap formation, as actin cytoskeleton inhibitors such as cytochalasin D were shown to interfere only with the BCR macroclustering in large caps, but not with initial formation of microclusters.3, 4, 5 For soluble multivalent Ags, the preferred location of directed transport is difficult to determine, particularly due to lack of suitable experimental studies. The consolidation of microclusters into a single macrocluster is studied by assuming directed diffusion towards the largest microcluster or a randomly chosen microcluster. Although a single macrocluster is formed at the end for both cases, there was a quick jump in the size of the largest macrocluster size and the length of the longest BCR–Ag chain immediately after the start of directed diffusion for the case of direction diffusion towards the largest microcluster. Such quantitative estimates can provide insight into the nature of cap formation.
To quantitatively describe receptor networking, we have devised metrics such as the average distance between receptor pairs <S> and the number of adjacent BCR pairs <P>, which can effectively yield quantitative estimates for different types of receptor clustering. We also considered the number of BCR molecules in the largest microcluster as a metric of differentiation between the two cases of directed diffusion. Similar metrics can be potentially used to analyze experimental data of BCR clustering, and could thus connect experimental results with computational studies. Imaging studies could yield position information of BCRs in a dynamic manner as they organize into clusters on the B-cell surface. Such positional information could then be used to estimate our proposed network metrics. In addition, recent fluorescent resonance energy transfer experiments, such as the fluorescent resonance energy transfer between Ig-α green fluorescent protein and Ig-β yellow fluorescent protein, can estimate the degree of receptor clustering38 and can be well correlated with the number of adjacent BCR pairs calculated in our theoretical modeling study.
In conclusion, we have developed a Monte Carlo model to elucidate the mechanisms of BCR clustering by crosslinking of soluble Ags. The effect of BCR–Ag affinity, and their concentrations on clustering, the stability of the formed clusters over the time, and the size of BCR–Ag crosslinked chains are all analyzed. Our results indicate that microcluster formation is dependent on the BCR's affinity for Ag. We also observe a need for directed transport of BCR molecules for the clustering of BCRs in cap-like macroclusters. In addition, our model provides a mechanistic description of BCR macrocluster formation by directed diffusion towards the largest microcluster or a random microcluster. The study motivates us to further probe the details of BCR clustering in cap-like structures. A more detailed model involving the lipid rafts is currently under development.
Acknowledgments
ASR, PKT and SR are supported from National Institutes of Health grant AI074022. The results obtained with different binding strength values (K), and considering the eight neighboring nodes are reported in supporting information.
Footnotes
Note: Supplementary information is available on the Cellular & Molecular Immunology website(http://www.nature.com/cmi/).
Supplementary Information
References
- Sohn HW, Tolar P, Jin T, Pierce SK. Fluorescence resonance energy transfer in living cells reveals dynamic membrane changes in the initiation of B cell signaling. Proc Natl Acad Sci USA. 2006;103:8143–8148. doi: 10.1073/pnas.0509858103. [DOI] [PMC free article] [PubMed] [Google Scholar]
- Tolar P, Sohn HW, Pierce SK. Viewing the antigen-induced initiation of B-cell activation in living cells. Immunol Rev. 2008;221:64–76. doi: 10.1111/j.1600-065X.2008.00583.x. [DOI] [PubMed] [Google Scholar]
- Unanue ER, Karnovsky MJ. Ligand-induced movement of lymphocyte membrane macromolecules: V. capping, cell movement, and microtubular function in normal and lectin-treated lymphocytes. J Exp Med. 1974;140:1207–1220. doi: 10.1084/jem.140.5.1207. [DOI] [PMC free article] [PubMed] [Google Scholar]
- Kim YM, Pan JY, Korbel GA, Peperzak V, Boes M, Ploegh HL. Monovalent ligation of the B cell receptor induces receptor activation but fails to promote antigen presentation. Proc Natl Acad Sci USA. 2006;103:3327–32. doi: 10.1073/pnas.0511315103. [DOI] [PMC free article] [PubMed] [Google Scholar]
- Schreiner GF, Fujiwara K, Pollard TD, Unanue ER. Redistribution of myosin accompanying capping of surface Ig. J Exp Med. 1977;145:1393–1398. doi: 10.1084/jem.145.5.1393. [DOI] [PMC free article] [PubMed] [Google Scholar]
- Pulendran B, Kannourakis G, Nouri S, Smith KG, Nossal GJ. Soluble antigen can cause enhanced apoptosis of germinal-centre B cells. Nature. 1995;375:331–334. doi: 10.1038/375331a0. [DOI] [PubMed] [Google Scholar]
- Minguet S, Dopfer EP, Schamel WW. Low-valency, but not monovalent, antigens trigger the B-cell antigen receptor (BCR) Int Immunol. 2010;22:205–212. doi: 10.1093/intimm/dxp129. [DOI] [PubMed] [Google Scholar]
- Sauerborn M, Brinks V, Jiskoot W, Schellekens H. Immunological mechanism underlying the immune response to recombinant human protein therapeutics. Trends Pharmacol Sci. 2010;31:53–59. doi: 10.1016/j.tips.2009.11.001. [DOI] [PubMed] [Google Scholar]
- Nossal GJV, Karvelas M, Pulendran B. Soluble antigen profoundly reduces memory B-cell numbers even when given after challenge immunization. Proc Natl Acad Sci USA. 1993;90:3088–3092. doi: 10.1073/pnas.90.7.3088. [DOI] [PMC free article] [PubMed] [Google Scholar]
- Graziadei L, Riabowol K, Bar-Sagi D. Co-capping of ras proteins with surface immunoglobulins in B lymphocytes. Nature. 1990;347:396–400. doi: 10.1038/347396a0. [DOI] [PubMed] [Google Scholar]
- LePage JF.A Computational model of cross-linking surface immunoglobin receptors on the surface of a B-lymphocyte cell, US Naval Academy Trident Scholar Project Report 158, 1989.
- Reddy AS, Chilukuri S, Raychaudhuri S. The network of receptors characterize B cell receptor micro- and macroclustering in a Monte Carlo model. J Phys Chem B. 2010;114:487–494. doi: 10.1021/jp9079074. [DOI] [PMC free article] [PubMed] [Google Scholar]
- Le Doussal JM, Gautherot E, Martin M, Barbet J, Delaage M. Enhanced in vivo targeting of an asymmetric bivalent hapten to double-antigen-positive mouse B cells with monoclonal antibody conjugate cocktails. J Immunol. 1991;146:169–175. [PubMed] [Google Scholar]
- Dembo M, Goldstein B. Theory of equilibrium binding of symmetric bivalent haptens to cell surface antibody: application to histamine release from basophils. J Immunol. 1978;121:345–353. [PubMed] [Google Scholar]
- Shchelkunov SN, Salyaev RK, Pozdnyakov SG, Rekoslavskaya NI, Nesterov AE, Ryzhova TS, et al. Immunogenicity of a novel, bivalent, plant-based oral vaccine against hepatitis B and human immunodeficiency viruses. Biotechnol Lett. 2006;28:959–967. doi: 10.1007/s10529-006-9028-4. [DOI] [PubMed] [Google Scholar]
- Kane PM, Holowka D, Baird B. Cross-linking of IgE-receptor complexes by rigid bivalent antigens greater than 200 A in length triggers cellular degranulation. J Cell Biol. 1988;107:969–980. doi: 10.1083/jcb.107.3.969. [DOI] [PMC free article] [PubMed] [Google Scholar]
- Lin S, Lee AS, Lin CC, Lee CK. Determination of binding constant and stoichiometry for antibody-antigen interaction with surface plasmon resonance. Current Proteomics. 2006;3:271–282. [Google Scholar]
- Tolar P, Sohn HW, Pierce SK. Viewing the antigen-induced initiation of B-cell activation in living cells. Immunol Rev. 2008;221:64–76. doi: 10.1111/j.1600-065X.2008.00583.x. [DOI] [PubMed] [Google Scholar]
- Tsourkas PK, Raychaudhuri S. Modeling of B cell synapse formation by Monte Carlo simulation shows that directed transport of receptor molecules is a potential formation mechanism. Cellular Mol Bioeng. 2010;3:256–268. doi: 10.1007/s12195-010-0123-1. [DOI] [PMC free article] [PubMed] [Google Scholar]
- Tsourkas PK, Longo ML, Raychaudhuri S. Monte Carlo study of single molecule diffusion can elucidate the mechanism of B cell synapse formation. Biophys J. 2008;95:1118–1125. doi: 10.1529/biophysj.107.122564. [DOI] [PMC free article] [PubMed] [Google Scholar]
- Tsourkas PK, Baumgarth N, Simon SI, Raychaudhuri S. Mechanisms of B-cell synapse formation predicted by Monte Carlo simulation. Biophysical J. 2007;92:4196–4208. doi: 10.1529/biophysj.106.094995. [DOI] [PMC free article] [PubMed] [Google Scholar]
- Dykstra M, Cherukuri A, Sohn HW, Tzeng SJ, Pierce SK. Location is everything: lipid rafts and immune cell signaling. Annu Rev Immunol. 2003;21:457–481. doi: 10.1146/annurev.immunol.21.120601.141021. [DOI] [PubMed] [Google Scholar]
- Schmidt C, Kim D, Ippolito GC, Naqvi HR, Probst L, Mathur S, et al. Signalling of the BCR is regulated by a lipid rafts-localised transcription factor, Bright. EMBO J. 2009;28:711–724. doi: 10.1038/emboj.2009.20. [DOI] [PMC free article] [PubMed] [Google Scholar]
- Goldstein B, Faeder JR, Hlavacek WS. Mathematical and computational models of immune-receptor signalling. Nat Rev Immunol. 2004;4:445–456. doi: 10.1038/nri1374. [DOI] [PubMed] [Google Scholar]
- Rabellino E, Colon S, Grey HM, Unanue ER. Immunoglobulins on the surface of lymphocytes: I. Distribution and quantitation. J Exp Med. 1971;133:156–167. doi: 10.1084/jem.133.1.156. [DOI] [PMC free article] [PubMed] [Google Scholar]
- Favier B, Burroughs NJ, Wedderburn L, Valitutti S. TCR dynamics on the surface of living T cells. Int Immunol. 2001;13:1525–1532. doi: 10.1093/intimm/13.12.1525. [DOI] [PubMed] [Google Scholar]
- Alarcon T, Page KM. Stochastic models of receptor oligomerization by bivalent ligand. J R Soc Interface. 2006;3:545–559. doi: 10.1098/rsif.2006.0116. [DOI] [PMC free article] [PubMed] [Google Scholar]
- Beltman JB, Henrickson SE, von Andrian UH, de Boer RJ, Marée AF. Towards estimating the true duration of dendritic cell interactions with T cells. J Immunol Methods. 2009;347:54–69. doi: 10.1016/j.jim.2009.05.013. [DOI] [PMC free article] [PubMed] [Google Scholar]
- Nudelman G, Weigert M, Louzoun Y. In-silico cell surface modeling reveals mechanism for initial steps of B-cell receptor signal transduction. Mol Immunol. 2009;46:3141–3150. doi: 10.1016/j.molimm.2009.03.027. [DOI] [PubMed] [Google Scholar]
- Raychaudhuri S, Tsourkas P, Willgohs E.Computational modeling of receptor–ligand binding and cellular signaling processesIn: Jue T (ed.)Handbook of Modern Biophysics, Volume I: Fundamentals. New York; Humana Press, Springer; 2009. [Google Scholar]
- Splinter ThA, Collard JG, de Wildt A, Temmink JH, Decary F. Capping of surface immunoglobulin on ‘hairy cells' is independent of energy production. J Cell Sci. 1979;36:45–59. doi: 10.1242/jcs.36.1.45. [DOI] [PubMed] [Google Scholar]
- Liu W, Meckel T, Tolar P, Sohn HW, Pierce SK. Antigen affinity discrimination is an intrinsic function of the B cell receptor. J Exp Med. 2010;207:1095–1111. doi: 10.1084/jem.20092123. [DOI] [PMC free article] [PubMed] [Google Scholar]
- Batista FD, Iber D, Neuberger MS. B cells acquire antigen from target cells after synapse formation. Nature. 2001;411:489–494. doi: 10.1038/35078099. [DOI] [PubMed] [Google Scholar]
- Batista FD, Harwood NE. The who, how and where of antigen presentation to B cells. Nat Rev Immunol. 2009;9:15–27. doi: 10.1038/nri2454. [DOI] [PubMed] [Google Scholar]
- Fleire SJ, Goldman JP, Carrasco YR, Weber M, Bray D, Batista FD. B cell ligand discrimination through a spreading and contraction response. Science. 2006;312:738–741. doi: 10.1126/science.1123940. [DOI] [PubMed] [Google Scholar]
- Carrasco YR, Fleire SJ, Cameron T, Dustin ML, Batista FD. LFA-1/ICAM-1 interaction lowers the threshold of B cell activation by facilitating B cell adhesion and synapse formation. Immunity. 2004;20:589–599. doi: 10.1016/s1074-7613(04)00105-0. [DOI] [PubMed] [Google Scholar]
- Carrasco YR, Batista FD. B-cell activation by membrane-bound antigens is facilitated by the interaction of VLA-4 with VCAM-1. EMBO J. 2006;25:889–899. doi: 10.1038/sj.emboj.7600944. [DOI] [PMC free article] [PubMed] [Google Scholar]
- Grakoui A, Bromley SK, Sumen C, Davis MM, Shaw AS, Allen PM, et al. The immunological synapse: a molecular machine controlling T cell activation. Science. 1999;285:221–227. [PubMed] [Google Scholar]
Associated Data
This section collects any data citations, data availability statements, or supplementary materials included in this article.