

Abstract
BACKGROUND AND PURPOSE
Glucagon-like peptide-1 (GLP-1) is secreted from enteroendocrine L-cells after food intake. Increasing GLP-1 signalling either through inhibition of the GLP-1 degrading enzyme dipeptidyl-peptidase IV or injection of GLP-1-mimetics has recently been successfully introduced for the treatment of type 2 diabetes. Boosting secretion from the L-cell has so far not been exploited, due to our incomplete understanding of L-cell physiology. Elevation of cyclic adenosine monophosphate (cAMP) has been shown to be a strong stimulus for GLP-1 secretion and here we investigate the activities of adenylate cyclase (AC) and phosphodiesterase (PDE) isozymes likely to shape cAMP responses in L-cells.
EXPERIMENTAL APPROACH
Expression of AC and PDE isoforms was quantified by RT-PCR. Single cell responses to stimulation or inhibition of AC and PDE isoforms were monitored with real-time cAMP probes. GLP-1 secretion was assessed by elisa.
KEY RESULTS
Quantitative PCR identified expression of protein kinase C- and Ca2+-activated ACs, corresponding with phorbolester and cytosolic Ca2+-stimulated cAMP elevation. Inhibition of PDE2, 3 and 4 were found to stimulate GLP-1 secretion from murine L-cells in primary culture. This corresponded with cAMP elevations monitored with a plasma membrane targeted cAMP probe. Inhibition of PDE3 but not PDE2 was further shown to prevent GLP-1 secretion in response to guanylin, a peptide secreted into the gut lumen, which had not previously been implicated in L-cell secretion.
CONCLUSIONS AND IMPLICATIONS
Our results reveal several mechanisms shaping cAMP responses in GLP-1 secreting cells, with some of the molecular components specifically expressed in L-cells when compared with their epithelial neighbours, thus opening new strategies for targeting these cells therapeutically.
Keywords: glucagon-like peptide 1, cyclic adenosine monophosphate, adenylate cyclase (AC), phosphodiesterase, guanylin
Introduction
Glucagon-like peptide 1 (GLP-1) is an incretin hormone secreted from the intestinal L-cell after a meal. It potentiates glucose-dependent insulin secretion from the pancreatic beta cell, inhibits glucagon secretion from the pancreatic alpha cell and reduces food intake (Drucker and Nauck, 2006; Holst, 2007; Gribble, 2008). However, despite its proven effectiveness in people with type 2 diabetes, the peptide itself is unsuitable as a therapeutic agent because it is rapidly inactivated by dipeptidyl-peptidase IV (DPP-IV) (Drucker, 2007). This problem has been overcome by a number of DPP-IV-resistant mimetics with prolonged circulating half-lives, which are now routinely used as subcutaneous injections for the treatment of type 2 diabetes. DPP-IV inhibitors, by contrast, are orally available, and act at least in part by increasing the half-life of endogenously secreted GLP-1. As the plasma GLP-1 levels and antidiabetic effects achieved by DPP-IV inhibition do not match those of injectable mimetics (Nauck et al., 2009) an obvious strategy would be to combine them with agents that boost secretion of endogenous GLP-1. That such a GLP-1 pool would be available and effective is suggested by the elevated GLP-1 concentrations seen after bariatric surgery (Morínigo et al., 2006; Dirksen et al., 2009; Vidal et al., 2009).
For such a strategy to be successful we need to understand better what regulates the secretion of GLP-1 – and the co-stored hormones oxyntomodulin, GLP-2 and peptide YY – from enteroendocrine L-cells. Using model cell lines such as STC-1 (derived from a murine small intestinal tumour), NCI-H716 (derived from a poorly differentiated adenocarcinoma of human caecum) and GLUTag (derived from a murine colonic tumour), an elevation of intracellular cAMP has been shown to be one of the strongest stimuli for GLP-1 secretion (Katsuma et al., 2005; Simpson et al., 2007; Islam et al., 2009; Lauffer et al., 2009). Downstream targets in cell lines have been shown to include protein kinase A and cAMP-regulated guanine nucleotide exchange factor II (Epac2) (Lotfi et al., 2006; Simpson et al., 2007). cAMP levels reflect an equilibrium between production by adenylate cyclases and hydrolysis by phosphodiesterases. Both enzymes have a number of isozymes and this study aimed to investigate which of these are important in L-cell physiology.
Methods
Tissue culture
Colonic epithelial cells isolated from adult mice aged between 6 to 20 weeks were cultured as described previously (Reimann et al., 2008). All animal procedures were approved by the local ethical committee and conformed to UK Home Office regulations. Briefly, GLU-Venus transgenic mice were killed by cervical dislocation and the gut collected into ice-cold Leibovitz-15 (L-15) medium (PAA, UK). The colon was dissected distal to the ileocolic junction, rinsed in L-15 and minced. For culture, the tissue was digested three times with Collagenase XI (0.4 mg·mL−1) in Dulbecco's modified Eagle's medium (DMEM, 25 mM glucose) for 10–15 min at 37°C. Supernatants were centrifuged at 300×g and the pellets resuspended in DMEM supplemented with 10% FBS, 2 mM L-glutamine, 100 U·mL−1 penicillin and 0.1 mg·mL−1 streptomycin. Aliquots were plated onto 24-well plates coated with Matrigel (BD Biosciences, Oxford, UK) for 24–36 h at 37°C, 5% CO2.
GLUTag cells were cultured in DMEM containing 5.5 mM glucose supplemented with 10% FBS, 2 mM L-glutamine, 100 U·mL−1 penicillin and 0.1 mg·mL−1 streptomycin, as described previously (Drucker et al., 1994; Reimann and Gribble, 2002).
GLP-1 secretion
Cells were washed at least twice with standard bath solution supplemented with 0.1% w·v−1 bovine serum albumin (BSA, fatty acid free). Experiments were performed by incubating the cells with test reagents in the same solution for 2–4 h at 37°C. For primary cells, secreted and cellular GLP-1 were extracted as previously described and quantified using an elisa specific for active GLP-1 (Millipore, Watford, UK) (Reimann et al., 2008). Secretion was expressed as a fraction of the total hormone (secreted + extracted) measured from a well. For GLUTag cells only GLP-1 secreted into the supernatant was quantified. In both cases secretion was normalized to the basal secretion measured under control conditions in parallel in the same set of experiments.
cAMP measurements
GLUTag cells were transfected with 3 µg of the Förster resonance energy transfer (FRET) cAMP probes, Epac1-camps, Epac2-camps, or pmEpac2-camps using Lipofectamine 2000 reagent (Invitrogen, Paisley, UK), overnight. The cells were then seeded onto matrigel-coated glass dishes (MatTek, Ashland, MA, USA) and imaged 24–96 h later. Apart from initial experiments [contributing to Figure 2 and performed in Dermot Cooper's laboratory using equipment described elsewhere (Goraya et al., 2008)], experiments were performed using an inverted fluorescence microscope (Olympus IX71, Southall, UK) with a 40× oil-immersion objective. The FRET probe was excited every 2–5 s at 435/10 nm using a 75 W xenon arc lamp and a monochromator (Cairn Research, Faversham, UK) controlled by MetaFluor software (Molecular Devices, UK). Emission was recorded with an Orca-ER CCD camera (Hamamatsu, Welwyn Garden City, UK) behind an Optosplit II image splitter (Cairn Research) equipped with cyan fluorescent protein (CFP) and yellow fluorescent protein (YFP) emission filter sets, acquiring 470/24 nm and 535/30 nm respectively. Fluorescence was recorded from individual cells and background corrected and expressed as the ratio of CFP over YFP. For illustrations traces were smoothened using adjacent averaging over 5 points in origin.
Figure 2.
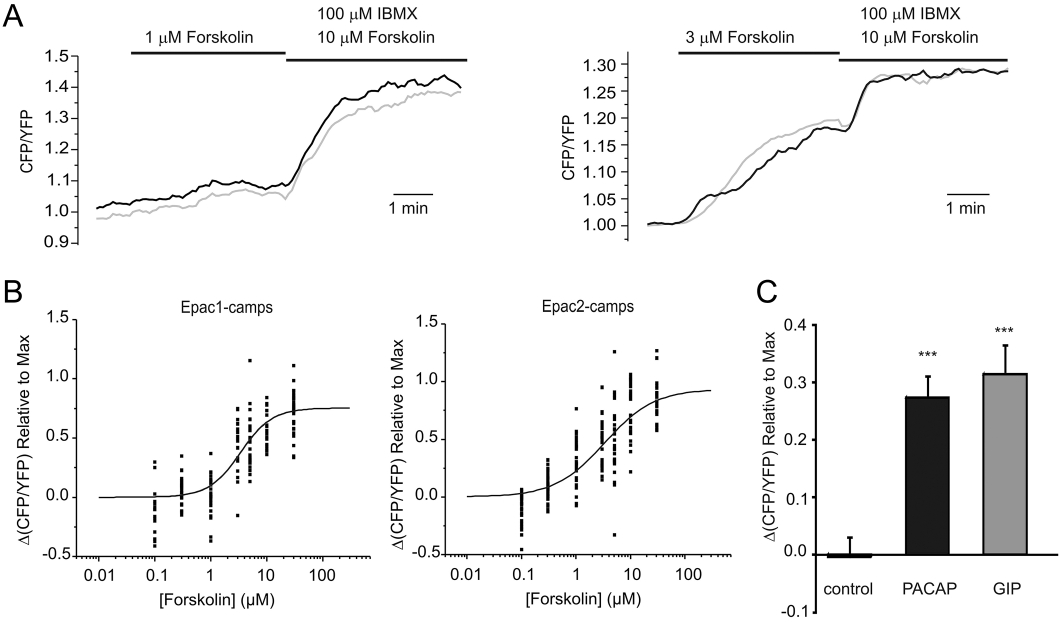
Changes in cAMP concentration in response to AC-activation. (A) GLUTag cells transfected with cytosolic Epac1-based FRET probes were perfused with 1 µM (left) or 3 µM (right) forskolin, followed by 10 µM forskolin/100 µM IBMX, as indicated while CFP and YFP emission was monitored in response to excitation with 435/10 nm. Each trace represents the CFP/YFP ratio of a single cell normalized to the starting value. (B) Changes in the CFP/YFP emission ratio in response to forskolin concentrations ranging from 100 nM to 30 µM for cells transfected with (left) Epac1-camps or (right) Epac2-camps. Each point represents measurements of a single cell; n = 18–40 from ≥4 separate experiments for each concentration. Data are presented as signal change in response to forskolin expressed as a fraction of the maximal CFP/YFP rise, achieved using 10 µM forskolin/100 µM IBMX at the end of the experiment as seen in (A). Logistic curves were fit and EC50s were 3.4 ± 0.6 µM for Epac1-camps and 3.4 ± 0.9 µM for Epac2-camps. (C) Changes in the CFP/YFP emission ratio in response to saline control, PACAP (100 nM) or GIP (100 nM) as indicated. Each treatment was applied to n = 22–28 cells in ≥4 separate experiments and responses were normalized to the maximal response elicited by 10 µM forskolin/100 µM IBMX. Statistical significance was assessed using Student's unpaired t-test; ***P < 0.001, as compared with control. Error bars represent 1 SEM.
In some experiments three-cube measurements were used in order to correct for bleed through signals and non-specific excitation of the two fluorophores (Gordon et al., 1998; Chen et al., 2006). Cells were excited at 435/10 nm for 250 ms and 500/10 nm for 40 ms every 2–5 s. Direct YFP excitation and bleed through of CFP emission into the YFP channel were corrected for after calculation of the setup parameters a = Ida/Iaa and d = Ida/Idd in which Ida is the observed emission from the acceptor (YFP) upon excitation of the donor (CFP), Iaa is the observed emission of the acceptor upon excitation with an acceptor-specific wavelength (500/10 nm) and Idd is the observed emission of the donor excited with a donor-specific wavelength (435/10 nm). We measured values of a = 0.134 ± 0.001 and d = 0.776 ± 0.015 using GLUTag cells transfected with YFP and CFP probes individually, allowing the calculation of corrected FRET signals (Fc) with the formula Fc= Ida− aIaa− dIdd.
Reagents were prepared in standard saline and perfused at ∼1 mL·min−1. At the end of each experiment, cAMP was maximally elevated by co-application of 10 µM forskolin (forskolin) and 100 µM 3-isobutyl 1-methylxanthine (IBMX) (forskolin/IBMX). Average fluorescence readings in individual cells were determined over ∼40 s before and at the peak of the response. Peak FRET responses were obtained by subtraction of the baseline from the averaged peak response. All test responses are expressed relative to the maximal response (forskolin/IBMX) in that individual cell. For experiments with different PDE inhibitors cells were primed with a pre-application of forskolin. This protocol was developed after initial attempts, in which cells were treated with PDE inhibitors alone, elicited only small or undetectable and variable cAMP responses, presumably due to low or fluctuating basal AC and PDE activity. IBMX response size was not reproducible after forskolin priming, in contrast to the response to a cocktail mix of PDE-2,3 and 4 inhibitors. Individual inhibitor responses are thus reported as a fraction of the response to a cocktail mix of all three PDE inhibitors investigated, which was applied randomly either before or after the individual test inhibitor.
Ca2+-measurements
In some experiments cytosolic Ca2+ and cAMP concentrations were monitored simultaneously after loading the cells with the AM-ester of the Ca2+-sensitive dye Fura-2, as previously described (Reimann et al., 2004). Briefly, cells were additionally excited at 340/10 nm and 380/4 nm for 250 ms every 5 s and 340/380 ratios were calculated from background subtracted emissions measured in the YFP channel. Cells were pooled into Ca2+-responsive cells and Ca2+-unresponsive cells determined by a change of the 340/380 nm signal of ≥0.05 and <0.05 (relative to basal readings) in response to 30 mM KCl respectively.
Expression analysis by quantitative PCR
RNA was extracted from GLUTag cells using TRI reagent and reversed transcribed as described previously (Reimann and Gribble, 2002). For primary tissue, cells were isolated from transgenic mice expressing the fluorescent protein Venus under the control of the proglucagon promoter (Reimann et al., 2008). Colonic tissue was digested to single cells with collagenase and sorted into Venus-fluorescent positive L-cells and non-fluorescent control cells using a MoFlo Beckmann Coulter Cytomation sorter. RNA was isolated from ∼10 000 cells sorted into lysis buffer using micro scale RNA isolation kit (Ambion/Applied Biosystems, Warrington, UK) and reverse transcribed according to the manufacturer's instructions (SuperScriptII, Invitrogen). cDNA from ≥3 independent RNA isolations/FACS sorts was amplified with QuantiTect SYBR Green PCR mix (Qiagen) or Absolute Blue SYBR Green ROX mix (ABgene/Thermo Fisher Scientific, Epsom, UK) using specific primers designed with Primer-BLAST (NCBI) software (see Table 1) on an Applied Biosystems 7900 HT Fast real-time PCR system controlled by SDS 2.3 software. In all cases, expression was compared with that of β-actin measured on the same sample in parallel on the same plate, giving a CT difference (ΔCT) for β-actin minus the test gene. CTs for β-actin ranged from 20–25 in the different samples, and reactions in which the test gene was undetectable were assigned a CT value of 40. A ΔCT value of −12 to −15 is therefore close to the detection limit of the assay. Mean, standard error and statistics were performed on the ΔCT data and only converted to relative expression levels (2∧ΔCT) for presentation in the figures.
Table 1.
Oligonucleotides used for RT-PCR
| A | ||||
|---|---|---|---|---|
| AC | NCBI mRNA accession No. | Amplicon length (region of mRNA amplified) | Primer Sequences (5′-3′) | |
| AC1 | NM_009622 | 102 (606–707) | F: CCTTTTGGTCACCTTCGTGT | |
| R: GCTGTGACCAGTAAGTGCGA | ||||
| AC2 | NM_153534 | 126 (2044–2169) | F: GCACTGCCAGCATTCAAGTA | |
| R: GAGAAATGCAGCTCCAAAGG | ||||
| AC3 | NM_138305 | 120 (1028–1147) | F: ATGAAGAAGGACGAGAGCCA | |
| R: AGCAGAGGACAGCTGGGTAA | ||||
| AC4 | NM_080435 | 170 (1613–1782) | F: GTGTCCACCTCCACTCCACT | |
| R: AAGTCCTTCGACTGCTTCCA | ||||
| AC5 | NM_001012765 | 106 (3816–3921) | F: GGCAGCTGGAAAAGATCAAG | |
| R: GCAATAGCCTTGATGTGGGT | ||||
| AC6 | NM_007405 | 172 (2255–2426) | F: TATGCCGCTATCTTCCTGCT | |
| R: TGGCAGAGATGAACACAAGC | ||||
| AC7a | NM_007406 | 143 (2415–2557) | F: AAGGGCTTTGAGCGTGAGTA | |
| R: CCAAAGGACACACCCAGAGT | ||||
| AC8 | NM_009623 | 113 (1600–1712) | F: TCGGATTTCTTCCTCAATGG | |
| R: CCCAGGAAATAGCGTTGGTA | ||||
| AC9 | NM_009624 | 131 (3875–3967) | F: CGGTCTCCCACAGATGAGAT | |
| R: GGCTCTCTCCAGGACCTCTT | ||||
| sAC (AC10) | NM_173029 | 154 (1833–1986) | F: GGCTGTTGCTATTGCACTGA | |
| R: CTCATCCAACAGCGTCTTGA | ||||
| B | ||||
|---|---|---|---|---|
| PDE | NCBI mRNA accession No.a | Amplicon length (region of mRNA amplified) | Primer Sequences (5′-3′) | Transcript variants detected |
| 1a | NM_001159582 | 147 (1066–1212) | F: CACTGGCTCACTGAACTGGA | 1, 2, 7, 9 |
| R: ATTCTCAAGCACTGAGCGGT | ||||
| 1b | NM_008800 | 126 (1303–1428) | F: TGCCCTTCTCTCCACTCTGT | N/A |
| R: GCTGGACACTCTTTTCTGCC | ||||
| 1c | NM_011054 | 102 (1885–1986) | F: TTGACGAAAGCTCCCAGACT | 1, 2, 3, 4, 5, 6, 7, 8 |
| R: ACCCAGAACTCTTGACACCG | ||||
| 2a | NM_001143848 | 124 (651–774) | F: CAAGTGCTGGTCATACCCCT | 1, 2, 3, 4 |
| R: GAGCGTGCTTCTCTACCACC | ||||
| 3a | NM_018779 | 128 (2438–2565) | F: AATGTGGCCGTATTCTGAGC | N/A |
| R: GTCCCTGTATCCGATCTCCA | ||||
| 3b | NM_011055 | 105 (1178–1282) | F: GACCGTCGTTGCCTTGTATT | N/A |
| R: CTCCATTTCCACCTCCAGAA | ||||
| 4a | NM_019798 | 115 (513–627) | F: GGAAATGAGCAGGTCAGGAA | 1, 5 |
| R: CTGCTGGAAGGGTCTCTGTC | ||||
| 4b | NM_019840 | 144 (1187–1330) | F: GCTCAAGCCTGAACAACACA | N/A |
| R: TAAGGGGCCGATTATGTGAG | ||||
| 4c | NM_201607 | 138 (1169–1306) | F: TGTTCAAAGTGGCTGAGCTG | N/A |
| R: GCCCCTCTAGTGTCAGCAAG | ||||
| 4d | NM_011056 | 137 (1101–1237) | F: GAAGTTGATGCACAGCTCCA | N/A |
| R: GCTCTGCTATTCGGAAAACG | ||||
| 7a | NM_008802 | 146 (781–926) | F: CCAGGTGTTAATCAGCCGTT | 1, 2 |
| R: TCCAATGGCAAGTGTGAGAA | ||||
| 7b | NM_013875 | 116 (490–605) | F: CCATGCATCTAGGCTTCTCC | N/A |
| R: CAAAGTCCCACGTTCCAACT | ||||
| 8a | NM_008803 | 139 (275–413) | F: GCGCCTCGAAGGTATCAGTA | N/A |
| R: AACCCAGCTTTCTCACATGC | ||||
| 8b | NM_172263 | 143 (1102–1244) | F: GTAGCAGAGGCCTTGGACAG | N/A |
| R: CCTGACAGTCTCCTCAAGCC | ||||
| 10a | NM_011866 | 114 (2231–2344) | F: ACCGACCTCGCCCTATACTT | N/A |
| R: CATCATCAAGCCGATGACAC | ||||
| 11a | NM_001081033 | 142 (1374–1515) | F: AACTGATGTCCCCAAAGTGC | N/A |
| R: TCGCTGACATTCACAGGAAG | ||||
(A) Primer sequences for known AC isoforms in Mus musculus.
Primers for AC7 are not transcript-variant specific. Primers amplify all four transcript variants. Accession number given is for transcript variant 1.
(B) Primer sequences for known cAMP-PDE families in Mus musculus. In all cases, primers were designed to amplify every transcript variant catalogued on NCBI.
Non-specific to transcript variants, accession number refers to variant 1.
Solutions
The standard bath solution used for most experiments contained (in mM): 4.5 KCl, 138 NaCl, 4.2 NaHCO3, 1.2 NaH2PO4, 2.6 CaCl2, 1.2 MgCl2, and 10 HEPES (pH 7.4, NaOH). Calcium-free buffer was a modified bath solution in which CaCl2 was omitted and 0.5 mM EGTA was included. For experiments in which cells were depolarized by elevation of the extracellular potassium concentration to 30 mM, NaCl was concomitantly reduced to 112.5 mM to maintain osmolarity. Where possible all drugs were prepared as a 1000X stock. All reagents were supplied by Sigma (Poole, UK) unless otherwise stated.
Analysis
Comparisons between conditions were made using regression analysis or by Student's two sample or one sample t-tests (Microsoft Excel), as indicated, with a threshold for significance of P = 0.05. The dose–response curves in Figures 1 and 2 were fit with a logistic equation y = A2 + ((A1-A2)/(1 + ([fsk]/EC50)^p)) using Microcal Origin software. All data are expressed as mean ± SEM.
Figure 1.
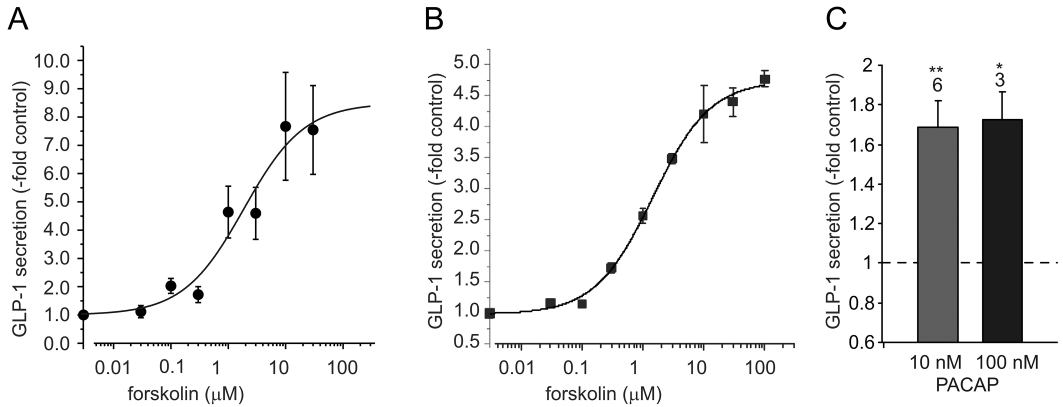
GLP-1 secretion in response to AC-activation. (A, B) Dose-dependent stimulation of GLP-1 secretion from (A) murine colonic epithelial cultures and (B) GLUTag cells incubated with bath solution containing the forskolin concentration indicated. Secreted GLP-1 is expressed relative to the amounts secreted in the absence of forskolin on the same day. Each point represents results from 3–6 wells and error bars represent 1 SEM. The solid line dose–response curves were fitted to the data set using a logistic equation, giving EC50s of 1.9 ± 1.7 µM (A) and 1.5 ± 0.4 µM (B) respectively. (C) GLP-1 secretion from murine colonic epithelial cultures incubated with either 10 or 100 nM PACAP as indicated. Secretion was normalized to secretion measured in parallel in the absence of PACAP (indicated by the dashed line). The number of wells is indicated above the bars and error bars represent 1 SEM. Statistical significance comparing to basal secretion in the absence of PACAP was evaluated using Student's one-factor t-test. **P < 0.01; *P < 0.05.
Results
To investigate if activation of adenylate cyclase is sufficient to stimulate GLP-1 secretion we incubated GLUTag cells and murine colonic L-cells in primary culture with forskolin. Secretion was triggered dose-dependently by forskolin, with EC50s of 1.9 ± 1.7 µM and 1.5 ± 0.4 µM respectively (Figure 1A,B). GLP-1 secretion from primary L-cells was also stimulated by application of pituitary adenylate cyclase activating peptide (PACAP) (Figure 1C).
To monitor changes in intracellular cAMP in response to these agents in single cells, we transfected GLUTag cells with FRET-based cAMP sensors Epac1-camps and Epac2-camps (Nikolaev et al., 2004). With these probes, cAMP elevation results in an increase of the CFP/YFP emission ratio on excitation at 435 nm. As shown in Figure 2A, the CFP/YFP ratio increased in single cells within seconds of applying forskolin. Incubation with saturating concentrations of forskolin (10 µM) and IBMX (100 µM) (Ong et al., 2009) at the end of the experiment was used to evaluate the maximal response. A dose–response curve was constructed for forskolin using the two different probes (Figure 2B), and showed that the pattern of cAMP changes mirrors the pattern of GLP-1 secretion, with both probes showing an EC50 for forskolin of 3.4 µM. We also observed changes in FRET when we applied PACAP or glucose-dependent insulinotropic polypeptide (GIP) (Figure 2C). The responses were generally slow to reverse, and were each ∼30% of the maximal response to forskolin/IBMX.
To identify members of the adenylate cyclase families that might play a role in mediating the effect of Gs-coupled receptors, we examined expression levels of the different gene families by quantitative RT-PCR in GLUTag cells, primary colonic L-cells and non-fluorescent control colonic cells (Figure 3). L-cells expressed relatively high mRNA levels of AC2, 5, 6, 8 and 9. AC6 was the most abundantly detected adenylate cyclase mRNA in all three cell populations and no significant differences in expression levels were detected between L-cells and their non-fluorescent neighbours, an observation also true for AC9. mRNA for the calcium-sensitive AC1 was highly expressed in GLUTag cells, but not in primary L-cells, which, however appeared to express higher levels of another Ca2+-sensitive adenylate cyclase, AC8. AC5, the mRNA for which was expressed at similar levels in both primary cell populations, was absent from the GLUTag cell line. Of all the AC mRNAs expressed in L-cells, only AC2 was expressed at significantly higher levels in L-cells compared with their neighbours, and the expression level of this enzyme seemed preserved in the GLUTag cell line.
Figure 3.
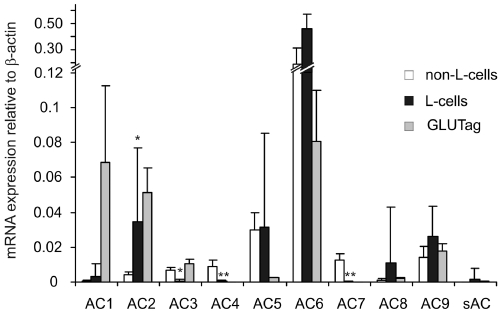
Expression of adenylate cyclases in colonic L-cells. Histogram showing the relative mRNA expression of adenylate cyclase genes in colonic Venus-fluorescence-negative (non-L-cells), fluorescence-positive (L-cells) and GLUTag cells. Expression was analysed by quantitative RT-PCR and compared with that of β-actin in the same sample; 3–6 samples from separate mice were analysed for each column. Data are presented as geometric mean, and the error bar was calculated from the log(base 2) data representing the upper SEM. Significance comparisons for each AC were performed first by anova[which showed significant differences between the three cell types for all ACs, except AC8, AC9 and soluble AC (sAC)], and subsequently by comparing only non-L-cells and L-cells by Student's unpaired t-test; *P < 0.05; **P < 0.01.
AC2 has previously been implicated in crosstalk between protein kinase C (PKC)-activation and cAMP-signalling (Jacobowitz and Iyengar, 1994). We therefore tested the effects of the phorbol ester, phorbol 12-myristate 13-acetate, on single cell cAMP levels and found significant increases in the FRET signal of Epac2-camps-transfected GLUTag cells (Figure 4A). Another important stimulus for GLP-1 secretion is the elevation of cytosolic Ca2+, which could potentially elevate cAMP levels via the Ca2+-sensitive cyclases AC1 (in GLUTag cells) and AC8 (in L-cells). Using 30 mM KCl to depolarize GLUTag cells and open voltage-gated Ca2+ channels, we observed a strong correlation between elevations of cytosolic Ca2+ monitored by Fura2 and cAMP monitored by Epac2-camps (Figure 4B,C). This was further explored in experiments applying 30 mM KCl in the absence of extracellular Ca2+. Under these conditions KCl failed to trigger fura-2 340/380-ratio changes (not shown), and Epac-2-camps FRET changes were significantly smaller compared with the changes observed in the same cells stimulated by KCl in the presence of Ca2+ in the bath solution (Figure 4D).
Figure 4.
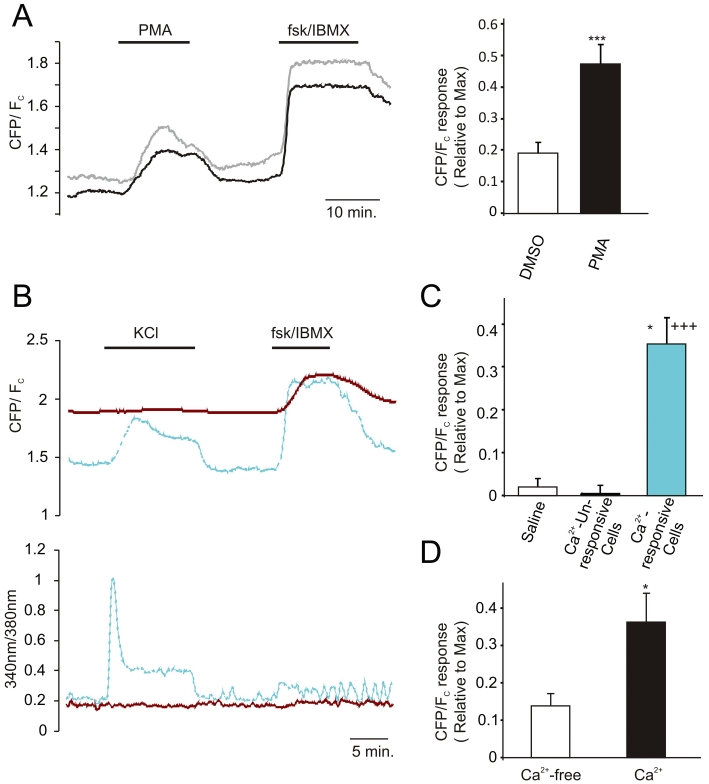
Phorbol-ester and Ca2+-stimulated changes in cAMP concentration. (A) (left) cAMP level monitored as ratio of CFP to corrected FRET (Fc) in GLUTag cells transfected with Epac2-camps and excited at 435/10 nm and 500/10 nm. Traces represent individual cell responses. Cells were treated with PMA (1 µM) and forskolin/IBMX (10 and 100 µM, respectively) as indicated. (right) Mean responses as measured on the left expressed as a fraction of the maximal response elicited by forskolin/IBMX. Each treatment was applied to n = 15–18 cells in ≥3 separate experiments. ***P < 0.001 as compared with vehicle control. Statistical significance was assessed by Student's unpaired t-test and error bars represent 1 SEM. (B) (left) cAMP concentration (top) and [Ca2+] (bottom) monitored as ratio of CFP to corrected FRET (Fc) and 340/380 nm emission ratio, respectively, in GLUTag cells transfected with Epac2-camps and loaded with Fura-2 and excited at 435/10 nm, 500/10 nm, 340/8 nm and 380/4 nm. The blue trace represents a Ca2+-responsive and the red trace a Ca2+-unresponsive cell monitored simultaneously in the same experiment. Top and bottom plots are from the same experiment. KCl (30 mM) and forskolin/IBMX (10 and 100 µM, respectively) were applied as indicated. (C) Mean cAMP responses to 30 mM KCl or saline relative to the maximal responses, as elicited using 10 µM forskolin/100 µM IBMX. Cells were pooled into Ca2+-responsive cells (increase in 340 nm/380 nm signal of ≥0.05 in response to 30 mM KCl) and Ca2+-unresponsive cells (increase in 340 nm/380 nm signal of <0.05 in response to 30 mM KCl). Each treatment was for n = 4-22 cells in ≥3 separate experiments. Statistical significance was assessed by Student's unpaired t-test and error bars represent 1 SEM.*P < 0.05 as compared with Ca2+-unresponsive cells; +++P < 0.001 as compared with saline control. (D) Mean cAMP responses to 30 mM KCl relative to the maximal responses, as elicited using 10 µM forskolin/100 µM IBMX in the presence and absence of extracellular Ca2+. Only cells showing a KCl induced Ca2+-response of ≥0.05 in the presence of extracellular Ca2+ were included in the analysis (n = 4 excluded on this basis). Data represent n = 11 cells in four separate experiments. Statistical significance was assessed by Student's paired t-test and error bars represent 1 SEM.*P < 0.05 as compared with Ca2+-free condition.
Although Gαs stimulation usually raises cAMP levels by coupling to adenylate cyclases, inhibition of cAMP-phosphodiesterase activity may also result in increased cytosolic cAMP. We previously reported microarray expression data of PDE-isoforms in L-cells (Ong et al., 2009). This was further quantified by RT-PCR, confirming significant mRNA expression of PDE2a, 3b, 4d, 7a, 8a and 8b in primary L-cells (Figure 5). However, by using RT-PCR we also detected significant levels of mRNA for PDEs 1c, 3a and 11a, but did not confirm the intermediate levels detected by microarray for PDEs 1b and 10a. PDE2a, 4d, 8a, 8b and 11a mRNAs were expressed at significantly higher levels in L-cells compared with their neighbouring non-L-cells, and their expression was broadly similar in primary L-cells and GLUTag cells.
Figure 5.
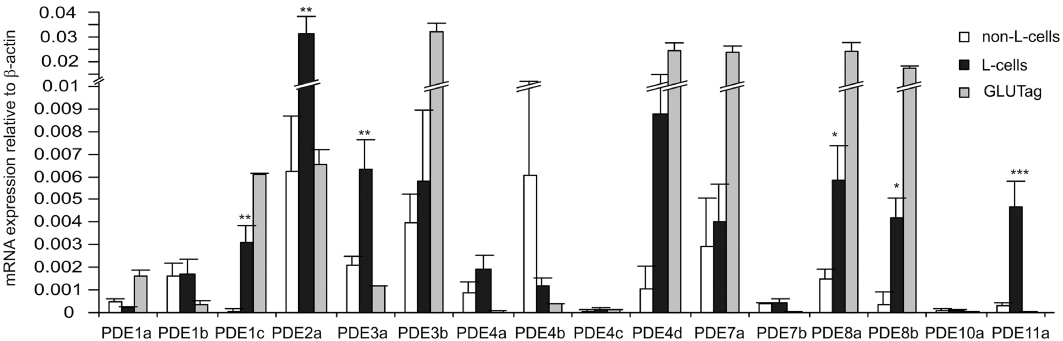
Expression of cAMP-phosphodiesterases in colonic L-cells. Histogram showing the relative mRNA expression of cAMP-hydrolysing phosphodiesterase genes in colonic Venus-fluorescence-negative (non-L-cells), fluorescence-positive (L-cells) and GLUTag cells. Expression was analysed by quantitative RT-PCR and compared with that of β-actin in the same sample; 3–6 samples from separate mice were analysed for each column. Data are presented as geometric mean, and the error bar was calculated from the log(base 2) data representing the upper SEM. Significance comparisons for each PDE were performed first by anova (which showed significant differences between the 3 cell types for all PDEs), and subsequently by comparing only non-L-cells and L-cells by Student's unpaired t-test; *P < 0.05; **P < 0.01; ***P < 0.001.
We next examined whether specific inhibition of PDE-2, 3 or 4, using BAY-60-7550, Org-9935 and rolipram, respectively, affected GLP-1 secretion from primary colonic cultures. GLP-1 secretion was enhanced similarly by BAY-60-7550, Org 9935 and rolipram, although all agents were less effective than the non-selective PDE inhibitor, IBMX (Figure 6A). Using the global Epac2-camps probe in GLUTag cells, we observed that rolipram, but not Org-9935 or BAY-60-7550, triggered significant changes in the FRET signal, indicating a rise in the cytosolic cAMP concentration (Figure 6B,C). In view of the finding that all three PDE inhibitors stimulated GLP-1 secretion from primary colonic cultures, we repeated the cAMP imaging experiment using a FRET probe targeted to the plasma membrane through an N-terminal modification with an ‘SH4’ motif (MGCINSKRKD) of Lyn kinase, which initiates palmitoylation and myristoylation at the cysteine and glycine residues respectively (pmEpac2-camps; Wachten et al., 2010). Interestingly, cAMP at the plasma membrane was significantly enhanced by all three PDE inhibitors, more closely mirroring the findings in secretion experiments (Figure 6D).
Figure 6.
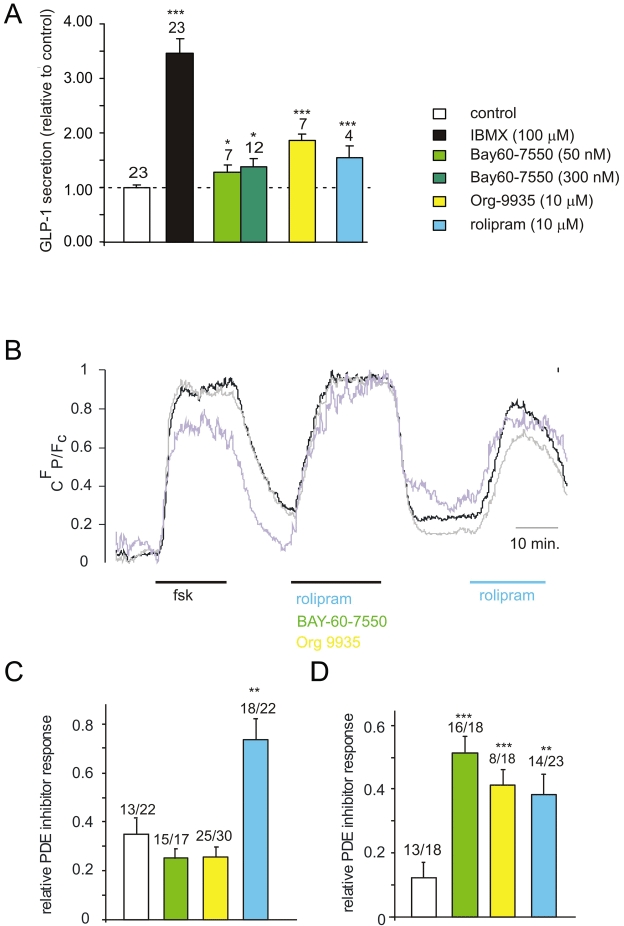
Effects of phosphodiesterase inhibition. (A) GLP-1 secretion from murine colonic epithelial cultures incubated for 2 h with either IBMX (100 µM), BAY-60-7550 (50 and 300 nM), rolipram (10 µM) and Org 9935 (10 µM) or control in bath solution supplemented with 10 mM glucose. Secreted GLP-1 was normalized to the total content of each well and data were further normalized to the GLP-1 secretion measured in the absence of PDE inhibition on the same day (control, dashed line). The number of wells is shown above the columns. Significance comparisons were performed first by ANOVA (which showed significant differences between groups), and subsequently by comparing each PDE inhibitor to control by Student's t-tests; ***P < 0.001;*P < 0.05; error bars represent 1SEM. (B) Example trace of cAMP concentration as monitored by changes in CFP/Fc. After an initial priming with forskolin (10 µM) Epac2-camps-transfected GLUTag cells were perfused with a cocktail of three PDE inhibitors [rolipram (10 µM) + BAY-60-7550 (50 nM) + Org 9935 (10 µM)] or rolipram (10 µM) alone as indicated. Traces represent single cells normalized to a range between 0 and 1 for clarity. (C) Rises in cAMP concentration as monitored with Epac2-camps in response to specific PDE2, 3 and 4 inhibitors, expressed as fractions of the cAMP response to the cocktail of these inhibitors either applied before (as shown in B) or after the application of the single agent, DMSO (0.1%; vehicle control), BAY-60-7550 (50 nM), rolipram (10 µM) and Org 9935 (10 µM). Single cell measurements from n = 13–25 cells were included for each treatment from ≥4 separate experiments per treatment. Numbers of cells included in the analysis are given above each column before the slash. Numbers after the slash indicate the total number of cells measured. The difference is made up of cells excluded on the basis that they did not respond to the inhibitor cocktail with CFP/Fc changes ≥5%. Statistical significance as compared with the vehicle control (DMSO, 0.1%) was evaluated using Student's t-test. **P < 0.01, after initial assessment by anova had indicated significant differences between groups. (D) As in (C) but monitored with the plasma membrane targeted probe pmEpac2-camps. Single cell measurements from n = 8–16 cells were included for each treatment from ≥4 separate experiments per treatment. Statistical significance as compared with the vehicle control (DMSO, 0.1%) was evaluated using Student's t-test. ***P < 0.001; **P < 0.01, after initial assessment by anova had indicated significant differences between groups.
Interestingly, two of the PDEs found in L-cells are known to be additionally modulated by cGMP. Thus, PDE2 is allosterically activated by cGMP, and PDE3 is competitively inhibited. We therefore tested if and how these PDEs might be involved in crosstalk between cAMP and cGMP signalling in L-cells. We found primary L-cells to express relatively high levels of mRNA for the guanylate cyclase-coupled receptor GC-C, which responds to guanylin (Affymetrix chip 430 2.0 hybridization data, not shown). Application of 1 µM guanylin stimulated GLP-1 secretion from primary L-cells and this effect was blocked when cultures were pretreated with 10 µM IBMX or the PDE3-specific inhibitor Org-9935 (10 µM) (Figure 7). By contrast, inhibition of PDE2, which can be allosterically activated by cGMP, did not prevent guanylin-stimulated GLP-1 secretion (Figure 7).
Figure 7.
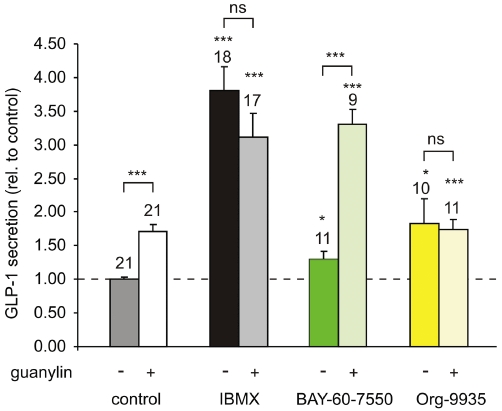
Guanylate-stimulated GLP-1 secretion. GLP-1 secretion from murine colonic epithelial cultures incubated for 2 h in bath solution supplemented with 10 mM glucose and IBMX (10 µM), BAY-60-7550 (300 nM), rolipram (10 µM), Org 9935 (10 µM), with or without guanylin (1 µM) as indicated. Secreted GLP-1 was normalized to the total content of each well and data were further normalized to the GLP-1 secretion measured in the absence of PDE inhibition and guanylin on the same day (dashed line). Number of wells is given above each column. Statistical significance was assessed using Student's t-test; ***P < 0.001;*P < 0.05; ns = non-significant. Error bars represent 1 SEM.
Discussion and conclusions
Elevation of cAMP is perhaps the most effective stimulus for GLP-1 secretion from L-cells identified to date. Similar to our observation with the model L-cell line GLUTag (Simpson et al., 2007), we found previously that direct activation of adenylate cyclase and concomitant inhibition of phosphodiesterase using forskolin and IBMX respectively, provided a strong stimulus for secretion from murine L-cells in primary culture, potentiating both basal and glucose-stimulated secretion (Reimann et al., 2008). While activation of adenylate cyclase – for example, in response to GIP or PACAP (Brubaker et al., 1998; Simpson et al., 2007) – is sufficient to stimulate GLP-1 release in the absence of pharmacological phosphodiesterase inhibition, previously, we were technically limited to monitoring total intracellular cAMP changes in GLUTag cells at a fixed time point after Gαs-stimulation and in the concomitant presence of the broad-spectrum PDE inhibitor IBMX (Simpson et al., 2007). Utilizing fluorescent FRET-based sensors, we now demonstrate dynamic single cell monitoring of cAMP changes. With these probes, we found that cAMP responses to a variety of stimuli, including stimulation of the Gαs-coupled GIP and PACAP receptors, were reproducible without the need for PDE inhibition and could be normalized to maximal FRET responses triggered by forskolin plus IBMX in the same cells at the end of the experiment. Using this protocol we obtained forskolin dose–response curves with two slightly different FRET sensors based on Epac2 and Epac1 respectively. No significant difference in sensitivity between the probes was observed and the estimated EC50 for forskolin closely matched its potency to trigger GLP-1 secretion from both GLUTag cells and murine L-cells in primary culture.
cAMP levels are dynamically regulated as a result of changes in the activities of cAMP-producing enzymes (ACs) and cAMP-hydrolysing enzymes (PDEs). We used our recently established transgenic mouse with fluorescently labelled L-cells (see Reimann et al., 2008) to investigate the mRNA expression of ACs and PDEs in these cells and their non-fluorescent neighbours, a population dominated by enterocytes.
All membrane-bound ACs are stimulated by Gαs and forskolin, but can be further grouped based on their sensitivity to other stimuli; thus AC1, AC3 and AC8 are activated while AC5 and AC6 are inhibited by Ca2+/calmodulin and AC2, AC4 and AC7 are activated by PKC phosphorylation or Gβγ subunits (Hanoune et al., 1997; Patel et al., 2001). Of the ACs only AC2 mRNA was specifically enriched in the enteroendocrine cells and these higher expression levels were preserved in the immortalized L-model cell line GLUTag. Consistent with reports of AC2 being stimulated by PKC phosphorylation (Jacobowitz and Iyengar, 1994; Cooper et al., 1995), we observed elevations of cytosolic cAMP levels in response to phorbol ester application. Potential crosstalk with cAMP-dependent pathways should therefore be taken into account when signals from Gαq-coupled receptors, such as GPR40 and GPR120, which have been implicated in fatty acid stimulated GLP-1 secretion, are investigated. The situation is further complicated by the finding that elevated Ca2+ itself was a strong stimulus for cAMP elevation in GLUTag cells, presumably via AC1 activation. Although primary L-cells appear to express less AC1 mRNA than GLUTag cells, they have correspondingly higher mRNA expression levels of an alternative Ca2+-stimulated cyclase, AC8. While we observed a strong correlation between KCl triggered Ca2+ and cAMP elevation, some small additional Ca2+-independent effect of KCl on cAMP levels was also observed when extracellular Ca2+ was removed. As we previously showed that forskolin/IBMX application can promote Ca2+ increases in GLUTag cells as a consequence of modulatory effects on ion-channel activity (Reimann et al., 2005; Simpson et al., 2007), it will be interesting in the future to address the relative timing of the changes in Ca2+, cAMP and electrical activity.
While there is a scarcity of pharmacological tools with specificity for members of the adenylate cyclase family, such tools are available for the cAMP-hydrolysing phosphodiesterases. By RT-PCR we detected a qualitatively similar PDE mRNA expression profile for L-cells to that found previously by microarray analysis. PDE2a and PDE4d seemed to be the predominant isoforms specifically expressed in L-cells, with moderate but detectable levels of PDE1c, PDE3a, PDE8a, PDE8b and PDE11a mRNAs. Consistent with previous reports showing acute GLP-1 responses in rats upon injection of the PDE4 inhibitor rolipram (Ong et al., 2009), we observed an elevation of cAMP in GLUTag cells when rolipram was applied, presumably due to inhibition of PDE4d. The fact that we did not observe similar changes in response to the PDE2 and PDE3 inhibitors Bay-60-7550 and Org 9935 using the ‘cytosolic’ FRET sensor probably reflects compartmentalization of different PDEs within the cell. Different PDEs, including PDE2-, PDE3- and PDE4-family isoforms, have been shown to be targeted to specific subcompartments either close to cAMP-production or -sensing sites, with further specificity achieved through alternative splicing (Shakur et al., 2000; Mongillo et al., 2006; Nilsson et al., 2006; Houslay, 2010). However, the observed stimulation of GLP-1 secretion by rolipram, Bay-60-7550 and Org 9935, corresponds well with the cAMP changes seen in response to all three agents when monitored with a plasma membrane targeted sensor, thus suggesting a role for PDE2a, PDE3a/b and PDE4d in GLP-1 secretion, even if the cAMP concentration at the site of the non-targeted ‘cytosolic’ FRET sensor is dominated by PDE4-activity.
In contrast to PDE4, which is cAMP-specific, PDE2 and PDE3 can both also hydrolyse cGMP. They differ, however, in their sensitivity to cGMP, which allosterically activates PDE2 but competitively inhibits PDE3. Our observation that activation of the guanylate cyclase-coupled guanylin receptor (GC-C) stimulates GPL-1 secretion suggests a stimulating role for cGMP, acting either via PDE3 inhibition or an alternative signalling pathway. The idea that it acts through PDE3 is suggested by the finding that guanylin was ineffective on GLP-1 secretion in the presence of the non-specific PDE inhibitor IBMX or the PDE3-specific inhibitor Org 9935, whereas its effect was retained, or even tended to increase, when PDE2 was inhibited by Bay-60-7550. Guanylin is believed to be secreted into the lumen of the intestine (Currie et al., 1992; de Sauvage et al., 1992) and our results suggest it may stimulate more distally located L-cells via a GC-C receptor pathway resulting in cGMP elevation and inhibition of PDE3. Stimulation of GLP-1 release by guanylin has not previously been reported and may represent a novel paracrine signalling loop within the intestine.
Acknowledgments
The authors would like to thank Martin Lohse for gift of the Epac-based cAMP sensors, Daniel Drucker for GLUTag cells and Brian Furman for advice and the gift of rolipram and Org 9935. This work was supported by Wellcome Trust fellowships to FMG (WT088357) and FR (WT084210). RSF received funding from the Gates Cambridge Trust.
Glossary
Abbreviations
- AC
adenylate cyclase
- cAMP
cyclic adenosine monophosphate
- DPP-IV
dipeptidyl-peptidase IV
- Epac2
cAMP-regulated guanine nucleotide exchange factor II
- FRET
Förster resonance energy transfer
- fsk
forskolin
- GIP
glucose-dependent insulinotropic polypeptide
- GLP-1
glucagon-like peptide 1
- PDE
phosphodiesterase
Conflicts of interest
On behalf of all authors, Frank Reimann declares that there are no conflicts of interests.
Supporting Information
Teaching Materials; Figs 1–7 as PowerPoint slide.
References
- Brubaker PL, Schloos J, Drucker DJ. Regulation of glucagon-like peptide-1 synthesis and secretion in the GLUTag enteroendocrine cell line. Endocrinology. 1998;139:4108–4114. doi: 10.1210/endo.139.10.6228. [DOI] [PubMed] [Google Scholar]
- Chen H, Puhl H, Koushik S, Vogel S, Ikeda S. Measurement of FRET efficiency and ratio of donor to acceptor concentration in living cells. Biophys J. 2006;91:L39–L41. doi: 10.1529/biophysj.106.088773. [DOI] [PMC free article] [PubMed] [Google Scholar]
- Cooper D, Mons N, Karpen J. Adenylyl cyclases and the interaction between calcium and cAMP signalling. Nature. 1995;374:421–424. doi: 10.1038/374421a0. [DOI] [PubMed] [Google Scholar]
- Currie M, Fok K, Kato J, Moore R, Hamra F, Duffin K, et al. Guanylin: an endogenous activator of intestinal guanylate cyclase. Proc Natl Acad Sci USA. 1992;89:947–951. doi: 10.1073/pnas.89.3.947. [DOI] [PMC free article] [PubMed] [Google Scholar]
- Dirksen C, Hansen DL, Madsbad S, Hvolris LE, Naver LS, Holst JJ, et al. Postprandial diabetic glucose tolerance is normalized by gastric bypass feeding as opposed to gastric feeding and is associated with exaggerated GLP-1 secretion: a case report. Diabetes Care. 2009;33:375–377. doi: 10.2337/dc09-1374. [DOI] [PMC free article] [PubMed] [Google Scholar]
- Drucker D. Dipeptidyl peptidase-4 inhibition and the treatment of type 2 diabetes: preclinical biology and mechanisms of action. Diabetes Care. 2007;30:1335–1343. doi: 10.2337/dc07-0228. [DOI] [PubMed] [Google Scholar]
- Drucker DJ, Nauck MA. The incretin system: glucagon-like peptide-1 receptor agonists and dipeptidyl peptidase-4 inhibitors in type 2 diabetes. Lancet. 2006;368:1696–1705. doi: 10.1016/S0140-6736(06)69705-5. [DOI] [PubMed] [Google Scholar]
- Drucker D, Jin T, Asa SL, Young TA, Brubaker PL. Activation of proglucagon gene transcription by protein kinase-A in a novel mouse enteroendocrine cell line. Mol Endocrinol. 1994;8:1646–1655. doi: 10.1210/mend.8.12.7535893. [DOI] [PubMed] [Google Scholar]
- Goraya T, Masada N, Ciruela A, Willoughby D, Clynes M, Cooper D. Kinetic properties of Ca2+/calmodulin-dependent phosphodiesterase isoforms dictate intracellular cAMP dynamics in response to elevation of cytosolic Ca2+ Cell Signal. 2008;20:359–374. doi: 10.1016/j.cellsig.2007.10.024. [DOI] [PubMed] [Google Scholar]
- Gordon G, Berry G, Liang X, Levine B, Herman B. Quantitative fluorescence resonance energy transfer measurements using fluorescence microscopy. Biophys J. 1998;74:2702–2713. doi: 10.1016/S0006-3495(98)77976-7. [DOI] [PMC free article] [PubMed] [Google Scholar]
- Gribble F. RD Lawrence Lecture 2008: targeting GLP-1 release as a potential strategy for the therapy of Type 2 diabetes. Diabet Med. 2008;25:889–894. doi: 10.1111/j.1464-5491.2008.02514.x. [DOI] [PMC free article] [PubMed] [Google Scholar]
- Hanoune J, Pouille Y, Tzavara E, Shen T, Lipskaya L, Miyamoto N, et al. Adenylyl cyclases: structure, regulation and function in an enzyme superfamily. Mol Cell Endocrinol. 1997;128:179–194. doi: 10.1016/s0303-7207(97)04013-6. [DOI] [PubMed] [Google Scholar]
- Holst JJ. The physiology of glucagon-like peptide 1. Physiol Rev. 2007;87:1409–1439. doi: 10.1152/physrev.00034.2006. [DOI] [PubMed] [Google Scholar]
- Houslay MD. Underpinning compartmentalised cAMP signalling through targeted cAMP breakdown. Trends Biochem Sci. 2010;35:91–100. doi: 10.1016/j.tibs.2009.09.007. [DOI] [PubMed] [Google Scholar]
- Islam D, Zhang N, Wang P, Li H, Brubaker PL, Gaisano HY, et al. Epac is involved in cAMP-stimulated proglucagon expression and hormone production but not hormone secretion in pancreatic alpha- and intestinal L-cell lines. Am J Physiol Endocrinol Metab. 2009;296:E174–E181. doi: 10.1152/ajpendo.90419.2008. [DOI] [PubMed] [Google Scholar]
- Jacobowitz O, Iyengar R. Phorbol ester-induced stimulation and phosphorylation of adenylyl cyclase 2. Proc Natl Acad Sci USA. 1994;91:10630–10634. doi: 10.1073/pnas.91.22.10630. [DOI] [PMC free article] [PubMed] [Google Scholar]
- Katsuma S, Hirasawa A, Tsujimoto G. Bile acids promote glucagon-like peptide-1 secretion through TGR5 in a murine enteroendocrine cell line STC-1. Biochem Biophys Res Commun. 2005;329:386–390. doi: 10.1016/j.bbrc.2005.01.139. [DOI] [PubMed] [Google Scholar]
- Lauffer LM, Iakoubov R, Brubaker PL. GPR119 is essential for oleoylethanolamide-induced glucagon-like peptide-1 secretion from the intestinal enteroendocrine L-cell. Diabetes. 2009;58:1058–1066. doi: 10.2337/db08-1237. [DOI] [PMC free article] [PubMed] [Google Scholar]
- Lotfi S, Li Z, Sun J, Zuo Y, Lam PP, Kang Y, et al. Role of the exchange protein directly activated by cyclic adenosine 5′-monophosphate (Epac) pathway in regulating proglucagon gene expression in intestinal endocrine L cells. Endocrinology. 2006;147:3727–3736. doi: 10.1210/en.2006-0056. [DOI] [PubMed] [Google Scholar]
- Mongillo M, Tocchetti C, Terrin A, Lissandron V, Cheung Y, Dostmann W, et al. Compartmentalized phosphodiesterase-2 activity blunts beta-adrenergic cardiac inotropy via an NO/cGMP-dependent pathway. Circ Res. 2006;98:226–234. doi: 10.1161/01.RES.0000200178.34179.93. [DOI] [PubMed] [Google Scholar]
- Morínigo R, Moizé V, Musri M, Lacy A, Navarro S, Marín J, et al. Glucagon-like peptide-1, peptide YY, hunger, and satiety after gastric bypass surgery in morbidly obese subjects. J Clin Endocrinol Metab. 2006;91:1735–1740. doi: 10.1210/jc.2005-0904. [DOI] [PubMed] [Google Scholar]
- Nauck M, Vilsbøll T, Gallwitz B, Garber A, Madsbad S. Incretin-based therapies: viewpoints on the way to consensus. Diabetes Care. 2009;32(Suppl. 2):S223–S231. doi: 10.2337/dc09-S315. [DOI] [PMC free article] [PubMed] [Google Scholar]
- Nikolaev VO, Bunemann M, Hein L, Hannawacker A, Lohse MJ. Novel single chain cAMP sensors for receptor-induced signal propagation. J Biol Chem. 2004;279:37215–37218. doi: 10.1074/jbc.C400302200. [DOI] [PubMed] [Google Scholar]
- Nilsson R, Ahmad F, Swärd K, Andersson U, Weston M, Manganiello V, et al. Plasma membrane cyclic nucleotide phosphodiesterase 3B (PDE3B) is associated with caveolae in primary adipocytes. Cell Signal. 2006;18:1713–1721. doi: 10.1016/j.cellsig.2006.01.010. [DOI] [PubMed] [Google Scholar]
- Ong WK, Gribble FM, Reimann F, Lynch MJ, Houslay MD, Baillie GS, et al. The role of the PDE4D cAMP phosphodiesterase in the regulation of glucagon-like peptide-1 release. Br J Pharmacol. 2009;157:633–644. doi: 10.1111/j.1476-5381.2009.00194.x. [DOI] [PMC free article] [PubMed] [Google Scholar]
- Patel T, Du Z, Pierre S, Cartin L, Scholich K. Molecular biological approaches to unravel adenylyl cyclase signaling and function. Gene. 2001;269:13–25. doi: 10.1016/s0378-1119(01)00448-6. [DOI] [PubMed] [Google Scholar]
- Reimann F, Gribble FM. Glucose-Sensing in Glucagon-Like Peptide-1-Secreting Cells. Diabetes. 2002;51:2757–2763. doi: 10.2337/diabetes.51.9.2757. [DOI] [PubMed] [Google Scholar]
- Reimann F, Williams L, Xavier G, Rutter GA, Gribble FM. Glutamine potently stimulates glucagon-like peptide-1 secretion from GLUTag cells. Diabetologia. 2004;47:1592–1601. doi: 10.1007/s00125-004-1498-0. [DOI] [PubMed] [Google Scholar]
- Reimann F, Maziarz M, Flock G, Habib AM, Drucker DJ, Gribble FM. Characterization and functional role of voltage gated cation conductances in the glucagon-like peptide-1 secreting GLUTag cell line. J Physiol. 2005;563:161–175. doi: 10.1113/jphysiol.2004.076414. [DOI] [PMC free article] [PubMed] [Google Scholar]
- Reimann F, Habib AM, Tolhurst G, Parker HE, Rogers GJ, Gribble FM. Glucose sensing in L cells: a primary cell study. Cell Metab. 2008;8:532–539. doi: 10.1016/j.cmet.2008.11.002. [DOI] [PMC free article] [PubMed] [Google Scholar]
- de Sauvage F, Keshav S, Kuang W, Gillett N, Henzel W, Goeddel D. Precursor structure, expression, and tissue distribution of human guanylin. Proc Natl Acad Sci USA. 1992;89:9089–9093. doi: 10.1073/pnas.89.19.9089. [DOI] [PMC free article] [PubMed] [Google Scholar]
- Shakur Y, Takeda K, Kenan Y, Yu Z, Rena G, Brandt D, et al. Membrane localization of cyclic nucleotide phosphodiesterase 3 (PDE3). Two N-terminal domains are required for the efficient targeting to, and association of, PDE3 with endoplasmic reticulum. J Biol Chem. 2000;275:38749–38761. doi: 10.1074/jbc.M001734200. [DOI] [PubMed] [Google Scholar]
- Simpson A, Ward P, Wong K, Collord G, Habib A, Reimann F, et al. Cyclic AMP triggers glucagon-like peptide-1 secretion from the GLUTag enteroendocrine cell line. Diabetologia. 2007;50:2181–2189. doi: 10.1007/s00125-007-0750-9. [DOI] [PMC free article] [PubMed] [Google Scholar]
- Vidal J, Nicolau J, Romero F, Casamitjana R, Momblan D, Conget I, et al. Long-term effects of Roux-en-Y gastric bypass surgery on plasma glucagon-like peptide-1 and islet function in morbidly obese subjects. J Clin Endocrinol Metab. 2009;94:884–891. doi: 10.1210/jc.2008-1620. [DOI] [PubMed] [Google Scholar]
- Wachten S, Masada N, Ayling L, Ciruela A, Nikolaev V, Lohse M, et al. Distinct pools of cAMP centre on different isoforms of adenylyl cyclase in pituitary-derived GH3B6 cells. J Cell Sci. 2010;123(Pt 1):95–106. doi: 10.1242/jcs.058594. [DOI] [PMC free article] [PubMed] [Google Scholar]
Associated Data
This section collects any data citations, data availability statements, or supplementary materials included in this article.