Abstract
Follicular Lymphoma (FL) is one of the most common types of non-Hodgkin Lymphoma in the United States. Diagnosis of FL is based on tissue biopsy that shows characteristic morphologic and immunohistochemical findings. Our group’s work focuses on development of computer-aided image analysis techniques to improve FL grading. Since centroblast enumeration needs to be performed in malignant follicles, the development of an automated system to accurately identify follicles on digital images of lymphoid tissue is an important step. In this paper we describe an automated system to identify follicles in IHC stained tissue sections. A unique feature of the system described here is the use of texture and color information to mimic the process that a human expert might use to identify follicle regions. Comparison of system-generated results with expert-generated ground truth has shown promising results, with a mean similarity score of 87.11%.
Keywords: Whole Slides, Follicular Lymphoma, Morphology, Watershed, K-Means
I. Introduction
FOLLICULAR Lymphoma (FL) is the second most common non-Hodgkins lymphoma in the United States. It accounts for 35% of all adult B cell lymphomas, and 70% of low grade lymphomas in U.S. clinical trials. A grading system adopted by the World Health Organization (WHO) divides FL into three histological grades based on the average number of centroblasts (CB), in ten random, microscopic standard high power fields (HPF) [1]. Grade 1 has up to 5 CB/HPF, grade 2 has 6-15 CB/HPF and grade 3 has greater than 15 CB/HPF. Grades I and II are considered indolent with long average survival rates and patients with these grades of FL and low clinical stage do not require chemotherapy. In contrast, grade III FL is an aggressive disease that is rapidly fatal if not immediately treated with aggressive chemotherapy. These differences underscore the importance of accurate histological grading of FL to appropriately risk stratify FL patients and to guide crucial clinical decisions of timing and type of chemotherapy. Establishing the diagnosis of FL in the majority of cases is not difficult and is based on characteristic morphologic and immunophenotypic findings using hematoxilin and eosin (H&E) and immunohistochemically (IHC) stained tissue sections. Histological grading of FL using WHO adopted manual method is labor intensive and difficult and shows poor reproducibility. One tool that may greatly aid pathologists in accurate FL grading is computer based image analysis.
Computer-aided diagnosis (CAD) tools are gaining more acceptance with advancements in imaging technologies and the mature image analysis tools available to researchers. Our group has been developing tools for computer-aided prognosis of neuroblastoma [2],[3] and grading of follicular lymphoma [4],[5] with promising results. The work described in [5] develops tools for the detection of follicles using H&E and IHC stained tissue. Using these results, we developed models to describe tissue histology for classification of FL grades [4]. Previous research in this area has focused on morphometric analysis of FL images [6], which compared diagnosis based on three different stains while [7] developed classifiers for subtyping FL. Recently, [8] has developed image analysis tools for counting nuclei in IHC stained FL tissue images using color features and watershed segmentation.
In this paper, we describe a new method for the detection of follicles in IHC slides based on the work done in [5]. The approach in [5] used color and texture features to identify potential follicle regions and attempted to fit an ellipse to the region. However, fitting an ellipse to a follicle is not always optimal since the shape of follicles can vary significantly depending on the tissue. In this paper, we extend the work in [5] by using different color and texture measures for identifying follicles. By using the proposed algorithm, we alleviate the need to fit ellipses to follicles and obtain better follicle boundaries. We also implement an iterative watershed segmentation algorithm for splitting up merged regions. The recursive algorithm adapts to each object and thus reduces over and under-segmentation. Finally, our algorithm uses boundary smoothing based on Fourier descriptors to obtain a smooth follicle boundary.
II. Proposed Method for Follicle Segmentation
FL grading is based on the number of centroblasts in ten random standard microscopic high power fields representing malignant follicles in H&E stained tissue. To build an effective computer-aided system for FL diagnosis and grading, it is important to identify the follicle regions in the tissue. IHC stains help identify follicle regions in tissue which are then registered with the H&E image which is used for the diagnosis. Figures 1(a) and 1(b) show two sample images of tissue stained with CD10 and CD20 stains, respectively. Follicle regions are marked with blue boundaries in both images.
Fig. 1.
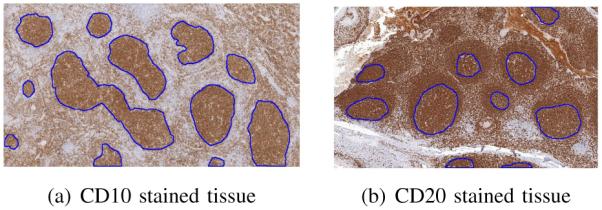
Follicle regions in IHC stained tissue
From Figure 1 it can be seen that under low magnification, the follicular patterns appear similar in both images. Follicles can range in shape from circular to elliptical with a large variation in the size depending on the tissue. The follicle regions are comprised of brown hues with varying amount of blue regions separating the follicles. Based on the characteristics of the stained tissue images, we propose a novel three step process for the segmentation of the individual follicles in the image. The first step performs a rough segmentation of the follicles using a combination of color and texture features, the second step separates overlapping follicle regions into individual follicles and the third step smoothes the estimated follicle boundaries. The flowchart for the algorithm is shown in Figure 2.
Fig. 2.
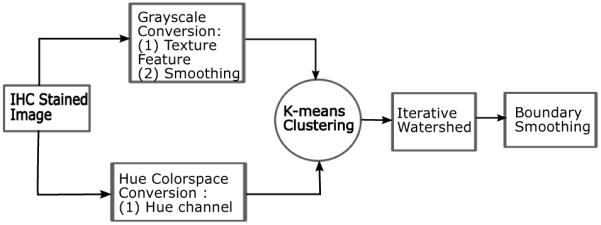
Outline of proposed algorithm
III. Rough Segmentation of Follicles using Clustering
Rough segmentation of follicles is achieved by clustering the image into four classes (background, blue cells, dark brown regions and light brown regions) using a three element feature vector consisting of one color feature and two texture features calculated from the image as described in this section.
A. Color Feature
Color is a very important feature that is used to identify objects of interest in images. Color images are typically represented as linear combinations of the primary colors: Red, Green and Blue (RGB). However, in RGB images, there is significant correlation between the three color channels and may not be a suitable representation for image processing purposes. Several other color-spaces such as the YIQ, HSV, CIE La*b are defined for representing color images. In our work, we have used the HSV (Hue, Saturation, Value) color-space because it decouples color information from the intensity information and is similar human color perception [9]. The Hue channel describes color, (i.e. red, green, blue, etc.) and can be used to identify colors of interest. In CD10 and CD20 stained tissues, the regions of interest consist mainly of brown hues separated by blue and/or background regions. Therefore, we used the pixel values in the Hue channel as one of the features for clustering. Two sample histograms are shown in Figure 7.
Fig. 7.
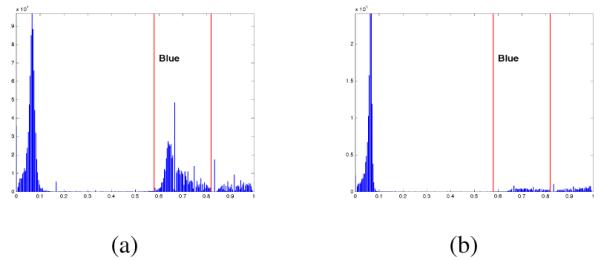
Hue channel histogram for different image content
B. Smoothing
The second feature is obtained through the reduction in texture variations inside the follicle regions by a smoothing operation on a grayscale version of the RGB image. While a low-pass filter may be used, it has the disadvantage of smoothing edges in the image. We use a median filter for smoothing the textural variations inside follicle while preserving the follicle boundaries.
We use a median filter with a large kernel size for smoothing the grayscale image under consideration. For 4x resolution images, a kernel size of 15 × 15 is used. Because the median filtered image demonstrates low contrast, a histogram equalization operation is used to increase the contrast of the image. The equalization operation also helps in better identifying the follicle regions. The pixel values in the histogram-equalized image was then used as the second feature.
C. Texture Energy using Co-Occurrence Matrix
The last feature used for follicle identification is calculated using gray level co-occurrence matrices. Gray level co-occurrence matrices provide a statistical method for characterizing spatial dependencies of gray levels in an image [10]. Co-occurrence matrices measure the frequency of occurrence of pairs of gray values separated by a fixed distance and angle.
Using the co-occurrence matrix, a number of textural attributes to characterize properties such homogeneity, contrast, energy, complexity of image, etc can be calculated [10]. In the detection of follicles it is observed that follicle regions consist of tightly packed cells and thus can be seen as having more textural energy than non-follicle regions in the image. Therefore, the energy metric is used as a feature vector for determining follicle locations.
D. Clustering
The three element feature vector consisting of the Hue channel values, histogram equalized output of the median filter and the energy vector calculated from the co-occurrence matrix were used to cluster the image into follicle and non-follicle regions. We use the K-means clustering algorithm for this purpose. The K-means algorithm is an unsupervised clustering method for partitioning data into K subsets. In CD10 images, we expect to find four clusters comprising of the slide background, cells that have been stained blue, follicle regions corresponding to the darker brown regions, regions that appear light brown due to sparcity of cells in that part of the image.
After K-means clustering, we identify the cluster corresponding to follicle region by using the average of the median filtered pixel value of all pixels assigned to a given cluster. Since the follicles are expected to be the darkest regions in the tissue, the cluster with the lowest average pixel value corresponds to the follicles in the image and a segmented image is obtained by setting the corresponding pixel locations to 1 and all other pixels to 0. This process can produce regions with mis-classified pixels inside follicles, we use morphological filling to enforce a smoothness constraint on the binary image. We apply the watershed transform to the distance transform of this binary image as described in the next section.
IV. Overlapping Follicle Separation
The K-means algorithm described in Section III-D is used to produce a segmented image in which follicle regions are marked as 1 and background regions as 0. However, this process may result in multiple follicles that are merged into one region and must be separated. This is achieved using the watershed transform.
The watershed transform can lead to oversegmentation and several approaches have been proposed for reducing the oversegmentation such as the use of shape priors. However, this typically requires a representative training set. Due to the large variation in follicle shapes, this approach is not suited for our task. Another approach is the use of the H-minima transform [9], [11] which is used to suppress minima in the image that are less than a specified value. To overcome the problem of choosing a value for the H-minima transform that works on all potential objects, we employ an adaptive method similar to [12] in which we apply the watershed transform to the image recursively until the segmentation can no longer proceed. Following the notation in [12], let H(gI, h) be the H-minima transform for threshold h on the inner distance map gI of the image I and Nh be the number of objects in the image. The algorithm proceeds as follows
Set h = 1, hadp = 0
Calculate H(gI, h), Nh and Nhadp
- While Nh > Nhadp do :
- hadp = h, Set h = h + 1
- Calculate H(gI, h) and Nh
Figure 4 shows the progression of this when algorithm applied to connected object. This iterative approach was found to be effective in splitting objects that are merged during segmentation. However, in the case of CD10 images it was observed that a narrowing of objects was not a sufficient condition for splitting objects. For example, even though the watershed process separated multiple objects, they were considered a single follicle by the human expert. On the other hand, in case of CD20 images, this approach was successful in splitting B-cell regions of interest in almost all cases.
Fig. 4.

Application of recursive watershed transform to split objects
V. Follicle Boundary Smoothing
The output of the watershed transform described in Section IV produces disjoint regions that corresponds to the follicle regions. However, the boundaries of the follicles are very noisy and further processing is required to smooth the boundaries. We use Fourier descriptors for smoothing object boundaries. Fourier descriptors are used for representing object boundaries [9] by representing the co-ordinates of each pixel on the boundary of an object as a complex number and calculating the Fourier transform of the complex numbers. Boundary smoothing is achieved by using only a subset of the Fourier coefficients for reconstructing the object boundary. Figure V shows an example of boundary smoothing.
Fig. 5.
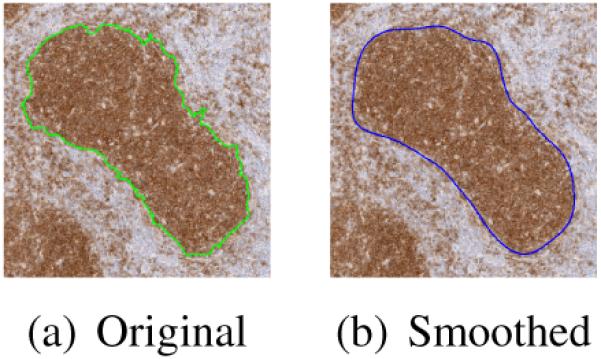
Boundary smoothing using Fourier descriptors
VI. RESULTS
A. Segmentation Results
Images used in this study were acquired using an Aperio ScanScope XT digitizer and scanned at 40x microscope resolution. At 40x resolution, the CD10 image used in this study was 96,899 × 174,600 pixels in size and was scaled down to 4x resolution for analysis. Our proposed algorithm was applied to 8 images of a CD10 stained tissue. Average image size of the test data was 900 × 1400 pixels. Images of different sizes were chosen due to the fact that follicles can have widely varying sizes and shapes and each image used in the paper was large enough to have several follicles. Results of the automated image analysis were compared with ground truth generated with the help of pathologists.
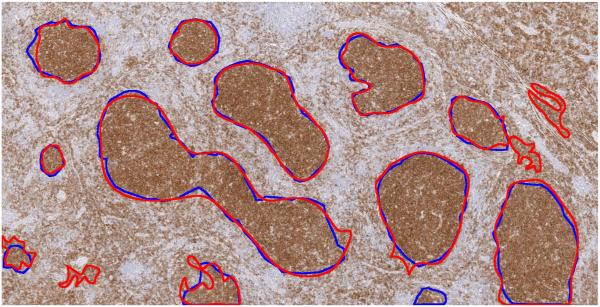
Figure 6 shows the follicle boundaries detected by our algorithm on one of the test images, using immunostaining for CD10. The blue boundaries were marked manually by a trained pathologist and red boundaries are generated by the proposed algorithm.
Fig. 6.
Result of proposed algorithm for images using CD10 immunostaining
B. Measuring Segmentation Accuracy
The goal of this research is to find follicle regions in IHC images. The follicle regions are then registered with an adjacent H&E stained tissue slice. Thus, the shape of the follicles and their location in the tissue are critical to the process. The proposed algorithm is evaluated by comparing the agreement between the manually segmented follicles and the computer segmented follicles by using a similarity index as defined in [13]. This similarity measure is defined as : where, M and A are the objects obtained from manual and automatic segmentation respectively and n{A} is the number of elements in set A.
In some cases, the algorithm splits follicles which are treated as a single follicle by the expert pathologist. In such cases, the similarity score is calculated by considering all the split follicles using the formula , where A1 and A2 are the computer detected objects.
Similarity scores were calculated for each follicle in each image. Table I shows the average similarity scores for 8 test images. The score listed in the table is the average score of all follicles in a given image.
TABLE I. Similarity scores for 8 test images at 4x microscope resolution: Overall average score 87.11%.
| Image | Avg. Score (%) |
|---|---|
| 1 | 91.77 |
| 2 | 89.68 |
| 3 | 93.47 |
| 4 | 93.91 |
| 5 | 92.04 |
| 6 | 91.38 |
| 7 | 84.37 |
| 8 | 60.29 |
The average similarity score for Image 8 is low because classification of the image into four classes as described in Section III-D leads to oversegmentation. By reducing the number of k-means classes to three, a significantly better result is obtained. Additional steps are thus necessary to better identify the number of classes in the image based on the content of the image. One approach to adaptive selection of the number of classes is through the examination of the Hue channel histogram. We have observed that in some cases, the image can be classified into only three classes consisting of dark brown, light brown and background/blue regions. In such cases, the Hue histogram shows that the amount of blue in the image is significantly lower than in other cases. An example of the Hue histogram from two such images is shown in Figure 7.
The proposed algorithm was applied to a whole slide image of CD10 stained tissue of dimension 9,689×17,460 pixels and takes approximately 1 hour 15 minutes to process a single image. Several additional challenges are posed by the large image size and additional work is necessary to parallelize the algorithm and run on multiple CPUs in order to make the processing practical for clinical application.
C. Sensitivity to processing parameters
Our algorithm was found to be most sensitive to the median filter size and the number of classes used for k-means clustering. Using smaller median filter sizes leads to follicles being broken up into smaller objects that need significant processing to merge. On the other hand, larger filter sizes lead to too much merging of regions, especially when applied to analysis of CD20 images. This led to our choice of a 15×15 median filter. As discussed in the previous section, the number of classes in the image can vary depending on the tissue and an adaptive method for selecting the number of classes is necessary.
VII. Conclusion
In this paper we have presented a novel method for detecting follicles in CD10 images. Our algorithm combines color and texture information from the image for identifying follicle regions. We propose and implement an iterative watershed algorithm for splitting merged regions in order to avoid oversegmentation which is a major problem for these kinds of problems. Computer segmentation results were compared with manual segmentation resulting in an average similarity score of 87.11%. Our algorithm was also applied to CD20 images and has been found to be successful in locating all B-cell regions which include the follicle and the mantle zones. Further research is under way to separate the follicles from the mantle zone in CD20 slides.
This algorithm is the first crucial step in a computer-aided diagnosis system for Follicular Lymphoma. By identifying all the follicles in the image, we can use the entire tissue section for diagnosis and grading of the disease, thus providing experts with another tool that can help improve accuracy of the diagnosis.
Fig. 3.
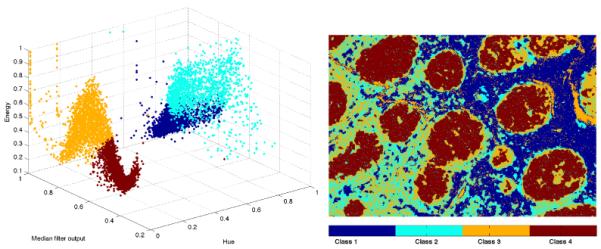
Example scatter plot for test image after clustering
VIII. Acknowledgements
This work was supported in part by award number R01CA134451 from the National Cancer Institute. The content is solely the responsibility of the authors and does not necessarily represent the official views of the National Cancer Institute, or the National Institutes of Health.
Contributor Information
Siddharth Samsi, Ohio Supercomputer Center.
Gerard Lozanski, Ohio State University Medical Center.
Arwa Shana’ah, Ohio State University Medical Center.
Ashok K. Krishanmurthy, Ohio Supercomputer Center
Metin N. Gurcan, Department of Biomedical Informatics at the Ohio State University.
References
- [1].Jaffe ES, Harris NL, Stein H, Vardiman JW. World health organization classification of tumours of haematopoietic and lymphoid tissues. IARC Press; 2001. [Google Scholar]
- [2].Gurcan MN, Kong J, Sertel O, Cambazoglu BB, Saltz J, Catalyurek U. Computerized pathological image analysis for neuroblastoma prognosis; AMIA Annual Symposium; American Medical Informatics Association. 2007; pp. 304–308. [PMC free article] [PubMed] [Google Scholar]
- [3].Sertel O, Kong J, Shimada H, Catalyurek U, Saltz J, Gurcan M. Computer-aided prognosis of neuroblastoma on whole-slide images: Classification of stromal development. Pattern Recognition. 2009;42(6):1093–1103. doi: 10.1016/j.patcog.2008.08.027. [DOI] [PMC free article] [PubMed] [Google Scholar]
- [4].Sertel O, Catalyurek UV, Lozanski G, Saltz JH, Gurcan MN. Histopathological image analysis using model-based intermediate representations and color texture: Follicular lymphoma grading. The Journal of Signal Processing Systems for Signal, Image, and Video Technology. 2009;55(1):169–183. [Google Scholar]
- [5].Sertel OS, Kong J, Lozanski G, Catalyurek U, Saltz JH, Gurcan MN. Computerized microscopic image analysis of follicular lymphoma. Medical Imaging 2008: Computer-Aided Diagnosis. 2008;6915(1):691535. [Google Scholar]
- [6].Swerdlow S, Pelstring R, Collins R. Morphometric analysis of follicular center cell lymphomas. The American journal of pathology. 1990;137(4):953. [PMC free article] [PubMed] [Google Scholar]
- [7].Firestone L, Preston K, et al. Continuous class pattern recognition for pathology, with applications to non-Hodgkin’s follicular lymphomas. Pattern Recognition. 1996;29(12):2061–2078. [Google Scholar]
- [8].Neuman U, Korzynska A, Lopez C, Lejeune M. Segmentation of Stained Lymphoma Tissue Section Images. Information Technologies in Biomedicine. 2010:101–113. [Google Scholar]
- [9].Gonzalez RC, Woods RE. Digital Image Processing. 2nd. ed. Prentice Hall; 2002. [Google Scholar]
- [10].Haralick RM, Shanmugam K, Dinstein I. Textural features for image classification. Systems, Man and Cybernetics, IEEE Transactions on. 1973 Nov.3(6):610–621. [Google Scholar]
- [11].Soille P. Morphological Image Analysis: Principles and Applications. Springer-Verlag New York, Inc.; Secaucus, NJ, USA: 2003. [Google Scholar]
- [12].Cheng J, Rajapakse J. Segmentation of clustered nuclei with shape markers and marking function. Biomedical Engineering, IEEE Transactions on. 2009 March;56(3):741–748. doi: 10.1109/TBME.2008.2008635. [DOI] [PubMed] [Google Scholar]
- [13].Zijdenbos A, Dawant B, Margolin R, Palmer A. Morphometric analysis of white matter lesions in mr images: method and validation. Medical Imaging, IEEE Transactions on. 1994 Dec;13(4):716–724. doi: 10.1109/42.363096. [DOI] [PubMed] [Google Scholar]


