Abstract
Objective
Barrett’s oesophagus is a premalignant disease associated with oesophageal adenocarcinoma. The major goal of this study was to determine the mechanism responsible for bile acid-induced alteration in intracellular pH (pHi) and its effect on DNA damage in cells derived from normal oesophagus (HET1A) or Barrett’s oesophagus (CP-A).
Design
Cells were exposed to bile acid cocktail (BA) and/or acid in the presence/absence of inhibitors of nitric oxide synthase (NOS) or sodium–hydrogen exchanger (NHE). Nitric oxide (NO), pHi and DNA damage were measured by fluorescent imaging and comet assay. Expression of NHE1 and NOS in cultured cells and biopsies from Barrett’s oesophagus or normal squamous epithelium was determined by RT-PCR, immunoblotting or immunohistochemistry.
Results
A dose dependent decrease in pHi was observed in CP-A cells exposed to BA. This effect of BA is the consequence of NOS activation and increased NO production, which leads to NHE inhibition. Exposure of oesophageal cells to acid in combination with BA synergistically decreased pHi. The decrease was more pronounced in CP-A cells and resulted in >2-fold increase in DNA damage compared to acid treatment alone. Examination of biopsies and cell lines revealed robust expression of NHE1 in Barrett’s oesophagus but an absence of NHE1 in normal epithelium.
Conclusions
The results of this study identify a new mechanism of bile acid-induced DNA damage. We found that bile acids present in the refluxate activate immediately all three isoforms of NOS, which leads to an increased NO production and NHE inhibition. This consequently results in increased intracellular acidification and DNA damage, which may lead to mutations and cancer progression. Therefore, we propose that in addition to gastric reflux, bile reflux should be controlled in patients with Barrett’s oesophagus.
INTRODUCTION
Barrett’s oesophagus is a premalignant condition where normal squamous epithelium is replaced by metaplastic columnar epithelium containing goblet cells. Barrett’s oesophagus is associated with an increased risk for the development of oesophageal adenocarcinoma (EAC).1 Although the exact pathogenesis of Barrett’s oesophagus is unclear, this lesion appears to be associated with severe, chronic reflux of gastric acid and bile acids.2 It has been proposed that metaplastic tissue is better adapted to noxious reflux components.3
Gastric acid alone causes intracellular acidification, DNA hydrolysis and loss of purines and pyrimidines.4 These apurinic/apyrimidinic sites cause genomic instability by imperfect base excision repair, which is linked to carcinogenesis.5 One of many protective measures evolved by cells to regulate intracellular pH is the extrusion of protons from the cytoplasm, mediated by the family of Na+/H+ exchangers (NHEs). This transporter is a ubiquitously expressed protein found in multiple isoforms to regulate the intracellular pH (pHi) and other physiological processes in mammalian cells including the gastrointestinal tract.6 Previously, it has been reported that NHE expression in patients with gastro-oesophageal reflux disease (GORD) is higher compared to normal individuals and is likely involved in the ability of Barrett’s oesophagus to tolerate repeated exposure to acid.7
Bile acids elicit carcinogenic effects by inducing proliferation through activation of different receptors and pathways such as epidermal growth factor receptor (EGFR), p38 and MAP kinase pathway.8 9 Several studies showed that repeated exposure to sub-lethal concentrations of hydrophobic bile acids leads to apoptosis resistance.10 In addition, hydrophobic bile acids induce the production of reactive oxygen species (ROS) and nitric oxide (NO), which is associated with DNA damage.11 12 Indeed, nitric oxide synthase (NOS), an enzyme responsible for NO production, is increased as Barrett’s oesophagus tissue progresses from non-dysplastic lesions to EAC.13 All isoforms of this enzyme can be hyper-activated following phosphorylation.14 15 Recently, it was shown that NO can inhibit NHEs.16
In the present study we evaluated the effect of bile acids on pHi. We show for the first time that bile acids can cause a dose dependent decrease in pHi in oesophageal cells. We also found evidence suggesting that the decrease in pHi involves NOS activation and NO-mediated inhibition of NHEs. Furthermore, acid and bile acids together profoundly decreased pHi below the pH of the extracellular medium, and this is associated with marked increase in acid-mediated DNA damage.
MATERIALS AND METHODS
Cell lines and chemicals
HET1A is a normal human oesophageal cell line provided by Dr Harris (National Cancer Institute, Bethesda, Maryland, USA).17 The cells were cultured in serum-free BRFF-EPM2 medium (Athena Environmental Sciences, Baltimore, Maryland, USA) supplemented with 50 μg/ml gentamicin and 0.25 μg/ml amphotericin B. Barrett’s oesophagus derived CP-A cells were kindly provided by Dr Rabinovitch (Fred Hutchinson Cancer Research Center, University of Washington). The cells were maintained in MCDB 153 medium as described previously.18 All experiments were performed in a serum-free, phenol red-free RPMI medium (Sigma, St. Louis, Missouri, USA) on cells passaged fewer than 13 times. The cells were exposed to control medium (pH 7.4) or medium acidified with HCl to pH5.5 and/or 0.5 mM bile acid cocktail (BA) for 10 min. BA contains equimolar concentrations of glycocholic acid, taurocholic acid, glycodeoxycholic acid, glycochenodeoxycholic acid and deoxycholic acid, reflecting the mixture of bile acids to which the distal oesophagus is ordinarily exposed during gastroesophageal reflux.19 The general NOS inhibitor NG-nitro-L-arginine methyl ester (L-NAME) and iNOS-specific inhibitor (N-[[3-(Aminomethyl)phenyl]methyl]-ethanimidamide dihydrochloride (1400W) were from Sigma. The general NHE inhibitor dimethyl amiloride (DMA) and NHE-1 specific inhibitor Zoniporide were from Sigma and Tocris (Ellisville, Missouri, USA), respectively.
Patients
Thirty patients with known Barrett’s oesophagus were included in the present study. All patients gave written informed consent with the approval of the University of Arizona Human Subjects Committee. Endoscopic biopsies of Barrett’s oesophagus and squamous mucosa were taken from patients undergoing regular surveillance procedures. Biopsies for microarray analysis were immediately stored in RNAlater solution (Ambion Inc., Austin, Texas, USA). Adjacent biopsies were stained with haematoxylin and eosin (H&E) and Alcian blue (pH 2.5) for histological evaluation and assessment of intestinal metaplasia. Barrett’s oesophagus was defined as the presence of intestinal-like metaplastic epithelium containing goblet cells (IM) from the sites above the gastro-oesophageal junction.
Measurement of intracellular pH
Intracellular pH was measured in cells by epifluorescence microscopy using the pH-sensitive dye BCECF. Dye loading and calculation of the rate of recovery after acid load were performed as described previously.20 Cells were superfused with medium at pH 7.4 to obtain a stable baseline pHi. The solution was then changed to the medium acidified to pH 5.5 for a treatment period of 10 min with or without BA. When bile acids were combined at a pH<5 the integrity of the cell membrane was compromised by bile acids and the fluorescent probe BCECF, used to measure intracellular pH, leaked out. Following treatment, medium at pH 7.4 was used to measure pHi recovery rate after treatments for an additional 5 min. When utilising inhibitors, L-NAME, 1400W, DMA or zoniporide, cells were pre-incubated with the inhibitors for 30 min before exposure to acid and/or BA, which also contained the indicated amount of inhibitor. Approximately 30 cells were assayed for each pHi experiment (N). Minimal pHi (pHimin) was calculated from the pHi traces as an average of the four lowest pHi values measured during the last ~24 s of treatment, prior to recovery with control medium. Delta;pHi was calculated from the pHi traces as a difference between minimal pHi and pHi values at baseline.
Real-time reverse transcription-PCR and microarray analysis
To evaluate NHE1 mRNA expression in patient samples, total RNA from Barrett’s oesophagus (N=18) and squamous epithelium (N=13) was isolated using the Qiagen RNeasy MiniKit (Valencia, California, USA) according to manufacturer’s instructions. The isolated total RNAs were used to produce labelled target, hybridised to Affymetrix U133A GeneChips, and read using the Agilent/Affymetrix 2500A scanner (Santa Clara, California, USA) according to manufacturer’s protocols as described previously.21 NHE1 expression was confirmed in HET1A and CP-A cells and a subset of the patient samples that were analysed by microarray using real time RT-PCR as described previously.22 Briefly, total RNA (squamous epithelium N=8, Barrett’s oesophagus N=10) was reverse transcribed and the resulting cDNA was amplified using Applied Biosystems SDS 7000 (Foster City, California, USA) and NHE1 and GAPDH-specific Taqman primer/probe (catalogue numbers: GAPDH Hs99999905_M1; NHE1 Hs00384604_M1) and relative NHE1 expression calculated using the delta delta Ct method with GAPDH expression used as the internal reference. Microarray and RT-PCR results were averaged within normal squamous and Barrett’s oesophagus tissues and normalised to the median value of the normal tissues. The normalised data were used to create a boxplot as implemented in the R statistical computing package v2.11.1. A two-tailed, unpaired Student t test was used to compare NHE1 expression between squamous epithelium and Barrett’s oesophagus in the microarray and RT-PCR results.
Immunoblotting and immunoprecipitation
Immunoblotting was employed to detect protein expression of iNOS, eNOS, nNOS, and NHE1 in oesophageal cell lines as described previously.23 Anti-iNOS, eNOS antibodies (Cell Signaling, Boston, Massachusetts, USA) were used at dilution 1:500. Anti-NHE1 (1:250) and β-actin (1:10,000) antibodies were from BD Biosciences (San Jose, California, USA) and Oncogene Research Products (Cambridge, Massachusetts, USA), respectively. Anti-nNOS antibody (1:250) was from Upstate antibodies (Billerica, Massachusetts, USA).
To evaluate NOS phosphorylation, CP-A cells were exposed for 5 min to control medium with or without 0.5 mM BA. Immunoblotting was used to detect phosphorylated eNOS (p-eNOS) and nNOS (p-nNOS) using antibodies against p-eNOSser1177 (1:500; Cell Signaling) and p-nNOSSer1417 (1:350; Stressgen, Ann Arbor, Michigan, USA). iNOS activation was determined by immunoprecipitation. Briefly, lysates were incubated with 5 μg of anti-iNOS antibody overnight (Santa Cruz Biotechnology, Santa Cruz, California, USA). Immunoprecipitation of iNOS employed the Fisher Classic IP kit following manufacturer protocol (Thermo Fisher Scientific, Rockford, Illinois, USA). The eluted samples were analysed by immunoblotting with primary antibodies to phospho-Ser/Thr/Ty (1:150; Anaspec, San Jose, California, USA) or iNOS (1:200).
Nitric oxide detection
DAF-FM, a membrane-permeable NO fluorescent probe, was loaded into cells at 5.0 μM for 20 min.24 The cells were incubated in a phenol-red free RPMI medium for 10 min to allow de-esterification. Using the epifluorescence microscopy method outlined for pHi measurement, we determined the real-time fluorescence of DAF-FM at excitation 488 nm and emission 535 nm in the presence/absence of NOS inhibitors, L-NAME and 1400W. Values were plotted as fluorescence/baseline fluorescence (f/f0). At least 30 cells were measured for each treatment in at least two independent experiments.
In the next experiment, NO production was measured in six-well plates using a fluorescent plate reader (Perkin Elmer, Waltham, Massachusetts, USA). Cells were loaded with DAF-FM as described above, treated with BA in the presence/absence of NOS inhibitors and agitated for 30 s. The fluorescence was then read 1 min after exposure at excitation 490 nm and emission 535 nm and plotted as per cent of control.
Analysis of DNA damage
DNA damage was evaluated by comet assay kit (Trevigen, Gaithersburg, Maryland, USA) as described previously.18 Cells were exposed to control medium at pH 7.4 or medium acidified to pH 5.5, pH 5, pH 4.5 or perfused with medium acidified to pH 5.5 supplemented with 0.5 mM BA for 10 min and evaluated immediately by comet assay.
γ-H2A.X was evaluated by fluorescence microscopy. CP-A cells were grown on slides and treated with control medium or medium acidified to pH 5.5, 5 and 4.5 for 10 min. After treatment, the cells were fixed with 100% ice-cold methanol for 10 min and immunostained with anti-γ-H2A.X antibody (Cell Signaling, Beverly, Massuchesetts, USA) as described previously.25 Nuclei were counterstained with propidium iodide (Molecular Probes).
Immunohistochemical staining
NHE1 expression in formalin-fixed, paraffin-embedded tissues was evaluated in Barrett’s oesophagus (N=9) and squamous epithelium (N=6) by immunohistochemistry according to protocols using the BenchMark XT IHC/ISH staining module (Ventana Medical Systems, Tucson, Arizona, USA). Duodenum was used as a control tissue. NHE1 signal was detected using iVIEW DAB detection kit (Ventana Medical Systems). Haematoxylin was used as a counter-stain. NHE1 monoclonal antibody was used at concentration 1.25 μg/ml (BD Biosciences, San Jose, California, USA). Immunohistochemial staining was independently scored by two histologists using a Nikon Eclipse E400 bright field microscope equipped with digital camera and Image-Pro software (Nikon, Melville, New York, USA).
Statistical analysis
ANOVA was used to identify differences between individual groups and multiple groups. The data are expressed as a mean±SEM. Comet assay data were not normally distributed, therefore the median value from each treatment was calculated to provide an appropriate quantitative measure of the data in preference to the mean. Data were analysed by ANOVA.
RESULTS
Bile acid-induced acidification is mediated by nitric oxide
CP-A cells loaded with BCECF were analysed for changes in pHi (Delta;pHi) during a 10 min exposure to BA at an extracellular pH of 7.4. BA induced a significant dose-dependent decrease in pHi compared to baseline pHi (supplementary figure 1). No change in extracellular pH was detected after addition of BA.
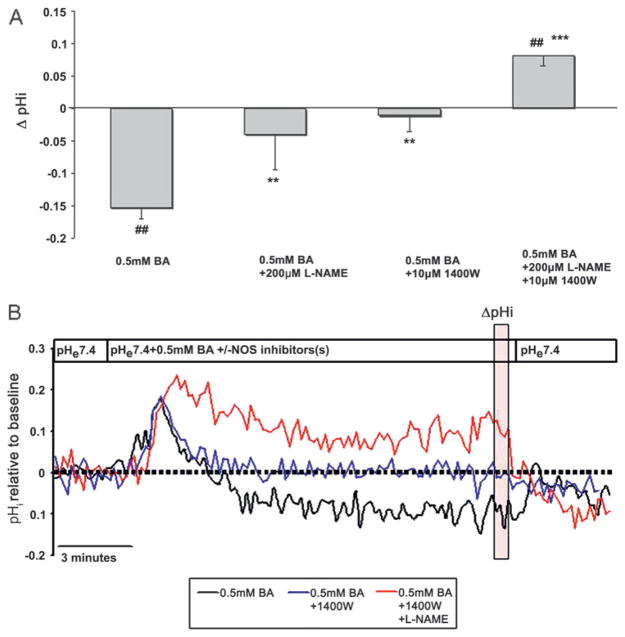
Based on studies in other tissues, indicating that NO causes inhibition of NHE and a decrease in intracellular pH,16 we examined the potential role of NO and NOS in BA-induced intracellular acidification. Cells were exposed to BA in the presence of either L-NAME, a broad spectrum NOS inhibitor with higher potency to block eNOS and nNOS, or 1400W, a specific inhibitor of inducible NOS (iNOS).26 L-NAME or 1400W significantly attenuated the BA-induced intracellular acidification (figure 1A, B). In the presence of L-NAME together with 1400W, BA caused a mild intracellular alkalinisation. Compared to baseline pHi, 200 μM L-NAME with 10 μM 1400W increased pHi by 0.10±0.02 (p<0.05, N=6, figure 1A). Figure 1B shows pH traces that illustrate the difference in pHi in the presence and absence of NOS inhibitors.
Figure 1.
Bile acid cocktail (BA) induces intracellular acidification that is mediated by nitric oxide. (A) The Delta;pHi after exposure to 0.5 mM BA in the absence or presence of the nitric oxide synthase (NOS) inhibitors NG-nitro-L-arginine methyl ester (L-NAME) and 1400W. (##p<0.01 compared with baseline, **p<0.01, ***p<0.001 compared with 0.5 mM BA). (B) Representative pHi traces in CP-A cells measured by BCECF microfluorimetry. The vertical transparent red box indicates values used to quantify Delta;pHi. The results are mean±SEM from at least three independent experiments. BCECF, 2′,7′-bis(carboxyethyl)-5(6)-carboxyfluorescein.
Bile acids induce rapid production of nitric oxide and activation of all three isoforms of nitric oxide synthase
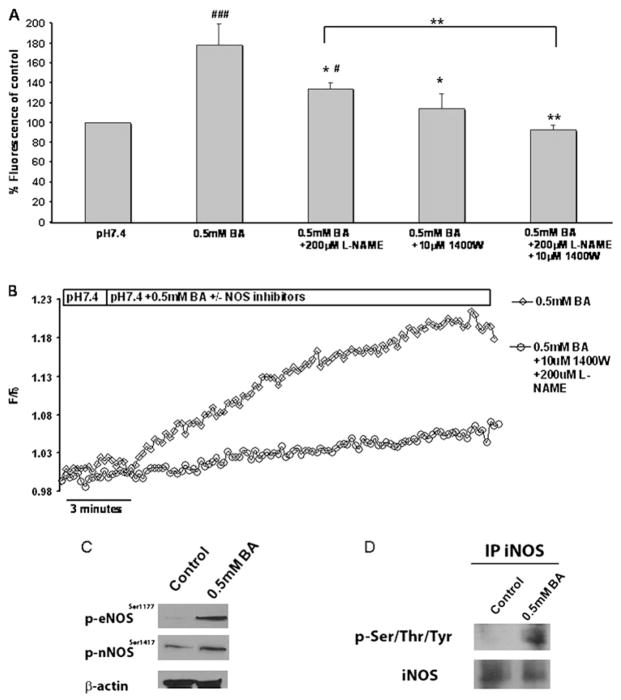
To confirm that NO and NOS play a role in BA-induced acidification, we evaluated nitric oxide production in CP-A cells exposed to BA. CP-A cells were loaded with DAF-FM. Fluorescence was measured within 60 s following treatment with 0.5 mM BA. The results indicate that exposure to BA caused a significant 77±21.5% increase in NO levels compared to untreated cells (p<0.01; N=4; figure 2A). When the cells were pre-incubated for 30 min with 200 μM L-NAME or 10 μM 1400W and exposed to BA, the fluorescence of DAF-FM was significantly decreased compared to the cells exposed to BA alone, suggesting decreased NO production. L-NAME and 1400W in combination decreased the production of NO to control levels (N=3, figure 2A).
Figure 2.
Increased nitric oxide (NO) production and nitric oxide synthase (NOS) activation is induced by bile acid cocktail (BA). CP-A cells were exposed to 0.5 mM BA in the presence or absence of the NOS inhibitors NG-nitro-L-arginine methyl ester (L-NAME) and 1400W. (A) Relative DAF-FM fluorescence after 1 min treatments at excitation/emission wavelengths 490/535 nm. The results represent mean±SEM from at least three independent experiments. (*p<0.05, **p<0.01 compared to pH 5.5 +0.5 mM BA), (#p<0.05 ###p<0.001 compared to pH 7.4). (B) Representative real-time traces of DAF-FM fluorescence. (C) Western blots of phosphorylated eNOS and nNOS and β-actin in CP-A cells +/− 0.5 mM BA for 5 min. (D) The presence of phosphorylated iNOS in CP-A cells treated with 0.5 mM BA detected by immunoprecipitation with iNOS antibody and blotting with iNOS or phospho-Ser/Thr/Tyr antibody.
To examine the effect of BA on NO generation in greater detail, experiments were carried out to measure DAF-FM fluorescence continuously in perfused cells. Exposure to BA resulted in the immediate increase in NO as determined by DAF-FM fluorescence (figure 2B). NO release was markedly reduced when the cells were pre-incubated with L-NAME and 1400W.
Western blot analysis indicated that iNOS and eNOS are abundant in both normal oesophagus and Barrett’s oesophagus-derived cell lines, HET1A and CP-A, respectively, while nNOS was detected only in CP-A cells (supplementary figure 2). To confirm that BA exposure leads to hyper-activation of NOS, we examined the phosphorylation of NOS after a brief exposure to 0.5 mM BA in CP-A cells. Western blot analysis using antibodies against eNOSser1177 and nNOSser1417 show that 0.5 mM BA stimulates an increase in phosphorylated eNOS and nNOS (figure 2C). Furthermore, immunoprecipitation with iNOS followed by western blotting with phospho-Ser/Thr/Tyr antibody showed that iNOS is phosphorylated after exposure to BA, as well (figure 2D).
Intracellular acidification of Barrett’s oesophagus cells is mediated by NHE
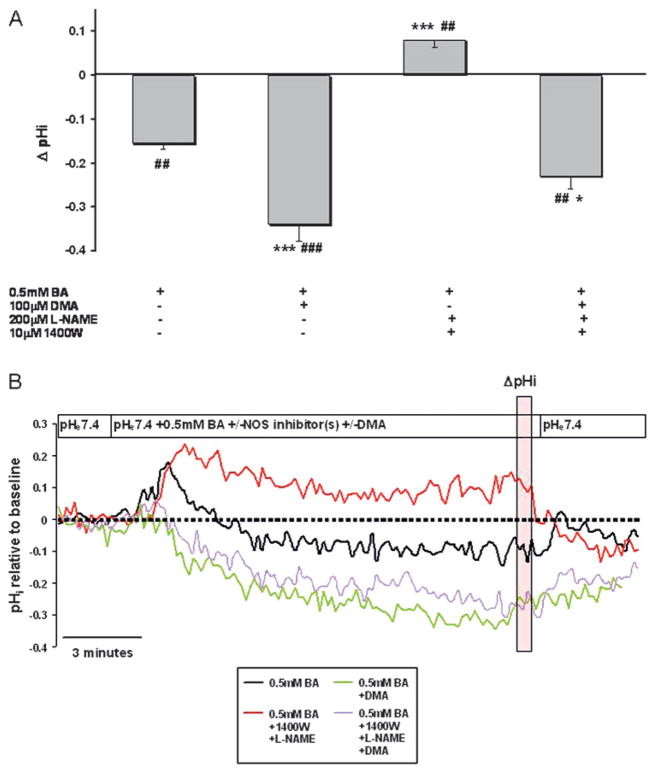
To test whether NHE plays a role in BA-induced acidification, cells were exposed to dimethylamilioride (DMA) a non-specific inhibitor of NHE. DMA at 100 μM inhibits multiple NHE isoforms.27 In the presence of DMA, BA-induced intracellular acidification was more than double that of BA alone (p<0.001, figure 3A). Furthermore, the mild alkalinisation previously observed in the presence of BA and NOS inhibitors (Delta;pH=0.08±.017) was abolished when the cells were pre-incubated with DMA (p<0.001, figure 3A, B). Upon close examination of the pHi traces, we observed a mild and transient alkalinisation approximately 30 s after exposure to BA that lasted approximately 60 s. After this time period we observed acidification that could be inhibited by NOS inhibitors. Pre-treatment with DMA completely reversed transient alkalinisation (figure 3B).
Figure 3.
Bile acids induce acidification that is mediated by inhibition of the sodium–hydrogen exchanger (NHE). (A) BA-induced changes in pHi (Delta;pHi) in CP-A cells at 10 min of treatment. The results show mean±SEM of data from at least three independent experiments. (##p<0.01, ###p<0.001 compared to baseline, *p<0.05, **p<0.01, ***p<0.001 compared to 0.5 mM BA). (B) Representative pHi traces demonstrating the effect of 0.5 mM BA +/− the NHE inhibitor DMA and +/− the NOS inhibitors NG-nitro-L-arginine methyl ester (L-NAME) and 1400W. The vertical transparent red box indicates values used to quantify Delta;pHi. Data are representative of at least three independent experiments. BA, bile acid cocktail; DMA, dimethyl amiloride.
Bile acids in combination with acid synergistically decrease pHi in HET1A and CP-A cells
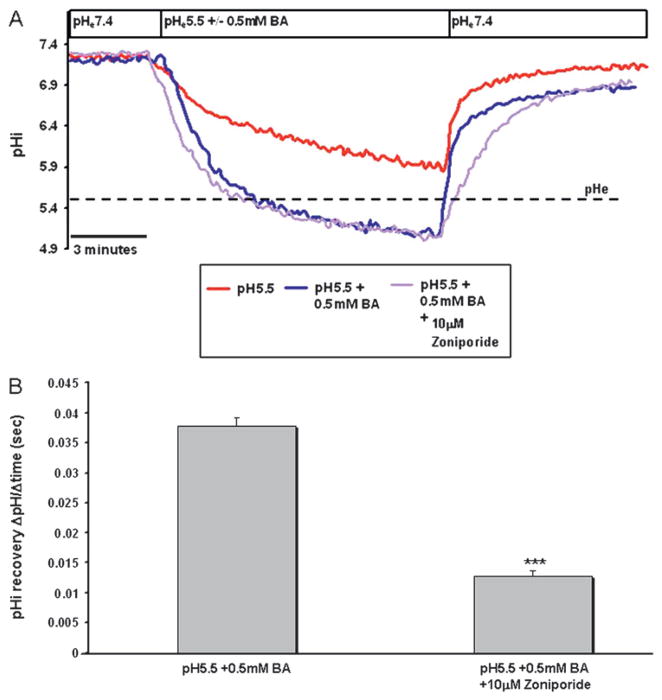
To mimic a reflux episode in vitro, we examined the effect of BA in combination with acid on pHi in CP-A cells. Cells were perfused with medium at pH 5.5 with and without 0.5 mM BA. Bile acids in combination with acid caused significantly greater intracellular acidification than acid alone. The pHi reached below the pH of the bathing medium (figure 4A). This effect was more pronounced in the CP-A cells compared to HET1A (supplementary figure 3A).
Figure 4.
Bile acids in combination with acid induce acidification that is mediated by inhibition of the sodium–hydrogen exchanger (NHE). (A) Representative traces of CP-A cells perfused with medium at pH 5.5 with and without 0.5 mM BA with and without NHE inhibitors; dashed line represents extracellular pH (pHe). (B) Recovery (pHi change over time) in CP-A cells after treatment with acid (pH 5.5) and 0.5 mM BA with and without NHE inhibitors. The data represent mean±SEM from more than three independent experiments (*p<0.05, ***p<0.001, compared to pH 5.5 +0.5 mM BA).
To obtain information on the NHE isoform responsible for [H+] extrusion from CP-A cells following treatment with acid in combination with bile acids, we attempted to selectively inhibit individual NHE isoforms. Zoniporide was used to inhibit NHE-1 and DMA at a low concentration (25 μM) was used to inhibit NHE1–3, while 100 μM DMA inhibits all NHE isoforms.27 DMA at 25 μM affected pHi recovery in HET1A cells (supplementary figure 3A, 3B), whereas zoniporide had no effect in HET1A cells (supplementary figure 3C). In contrast, pHi recovery in CP-A cells was significantly decreased by NHE1 inhibition using the inhibitor, zoniporide (figure 4A, B).
Inhibition of nitric oxide attenuates intracellular acidification induced by acid and bile acids
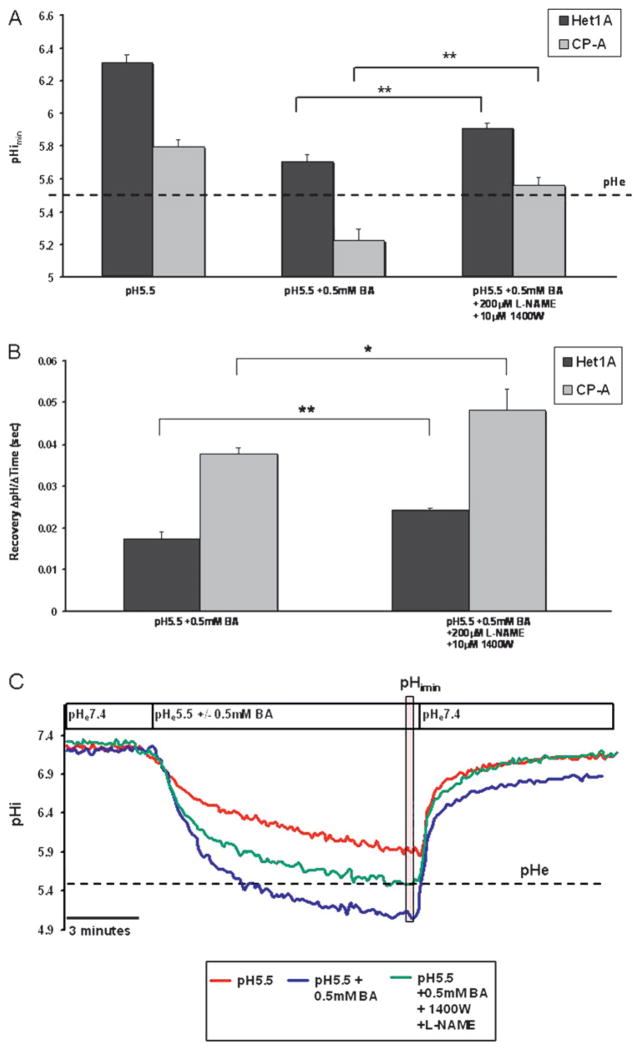
Treatment of cells with medium at pH 5.5 with 0.5 mM BA in the presence of NOS inhibitors, L-NAME and 1400W, suppressed the acidification in HET1A and CP-A cells. In the absence of NOS inhibitors, HET1A and CP-A cells experienced a pHimin of 5.22±0.065 and 5.70±0.044, respectively, while in the presence of NOS inhibitors pHimin was 5.6±0.05 and 5.9±0.02, respectively (figure 5A). Furthermore, NOS inhibitors increased the pHi recovery rate (Delta;pH/time) in CP-A and HET1A by 29% and 39%, respectively (figure 5B). Figure 5C illustrates a representative trace of pHi in CP-A cells at pH 5.5 with and without bile acids in the presence or absence of NOS inhibitors. Supplemental figure 4 shows a representative trace for the same treatments in HET1A cells.
Figure 5.
Inhibition of nitric oxide synthase (NOS) abrogates acidification induced by acid (pH 5.5) and bile acid cocktail (BA). (A) pHimin in HET1A and CP-A cells in the presence of acid (pH 5.5) +/− bile acids in the presence or absence of NOS inhibitors. (B) Recovery rate (pH change/time) following treatment with acid and bile acids in the presence or absence of NOS inhibitors. (C) Representative pHi traces in CP-A cells measured by BCECF microfluorimetry. The vertical transparent red box indicates values used to quantify pHimin. The cells were perfused for 10 min with (1) acid at pH 5.5 (red line), (2) pH 5.5 and 0.5 mM BA (blue line) and (3) pH 5.5 and 0.5 mM BA in the presence of NOS inhibitors NG-nitro-L-arginine methyl ester (L-NAME) and 1400W (green line). Statistical significance is indicated by asterisks (**p<0.01). Data are representative of at least three separate experiments. BCECF, 2′,7′-bis (carboxyethyl)-5(6)-carboxyfluorescein.
Bile acids in combination with acid significantly decrease intracellular pH, which leads to DNA damage
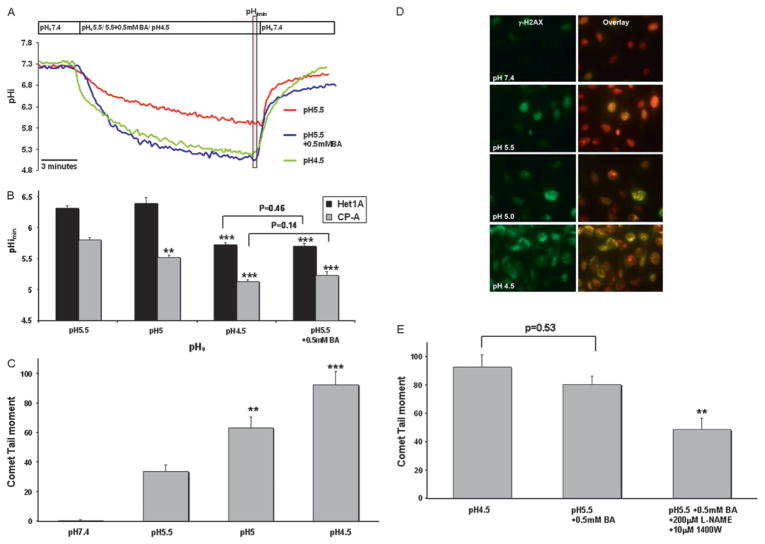
Next, we treated CP-A and HET1A cells with medium acidified to different pH values (pH 5.5, pH 5 and pH 4.5) and then measured the pHi to determine what extracellular pH will induce similar changes to the intracellular pH as acid (pH 5.5) in combination with 0.5 mM BA. In both cell lines, the medium at pH 4.5 produced a similar pHi reduction as medium at pH 5.5 with 0.5 mM BA (figure 6A, B). A representative trace for HET1A can be found in Supplemental figure 5.
Figure 6.
Acidification and DNA damage induced by acid and bile acids. (A) Representative pHi traces (pHe 5.5, 4.5, 5.5+0.5 mM BA) in CP-A cells measured by BCECF microfluorimetry. The vertical transparent red box indicates values used to quantify pHimin. (B) pHimin in HET1A and CP-A cells after treatment with medium at varying pHe and at pH 5.5 +0.5 mM BA. Asterisk indicates statistically significant difference compared to pH 5.5 (**p<0.01, ***p<0.001). (C) Median DNA tail moment in CP-A, measured by the comet assay, after 10 min treatment with medium at varying pH (***p<0.001, **p<0.01 compared to pH 5.5). (D) Representative images of γ-H2AX (green signal) in CP-A cells. Red signal represents nuclear staining. (E) Median DNA tail moment in CP-A cells after treatment with medium at pH 5.5, medium at pH 5.5 +0.5 mM BA and medium at pH 5.5 +0.5 mM BA + NOS inhibitors (**p<0.01 compared to pH 5.5+0.5 mM BA). BCECF, 2′,7′-bis(carboxyethyl)-5(6)-carboxyfluorescein.
Previous publications have shown that acid can induce DNA damage in oesophageal cells.25 28 In order to determine how a 10-fold change in [H+] affects DNA integrity in oesophageal cells, we used the comet assay and γ-H2AX immunostaining to evaluate DNA damage. Median tail moment after exposure to medium at pH 4.5 for 10 min was increased in CP-A by >100% compared to medium at pH 5.5 (p<0.05; figure 6C). The findings were confirmed by immunohistochemical staining with γ-H2A.X antibody, a marker of DNA double-strand breaks. The expression of this DNA damage marker was markedly increased in the cells treated with medium at pH 4.5 compared to pH 5.5 (figure 6D).
In addition, our data show that the median tail moment observed after exposure to medium at pH 4.5 was insignificantly different from that observed after exposure to medium at pH 5.5 with 0.5 mM BA (p=0.53, figure 6E). Importantly, the DNA damage induced by medium at pH 5.5 and 0.5 mM BA was significantly decreased by NOS inhibitors, L-NAME and 1400W (p<0.01, figure 6E).
NHE1 mRNA and protein are increased in Barrett’s oesophagus cell lines and tissues
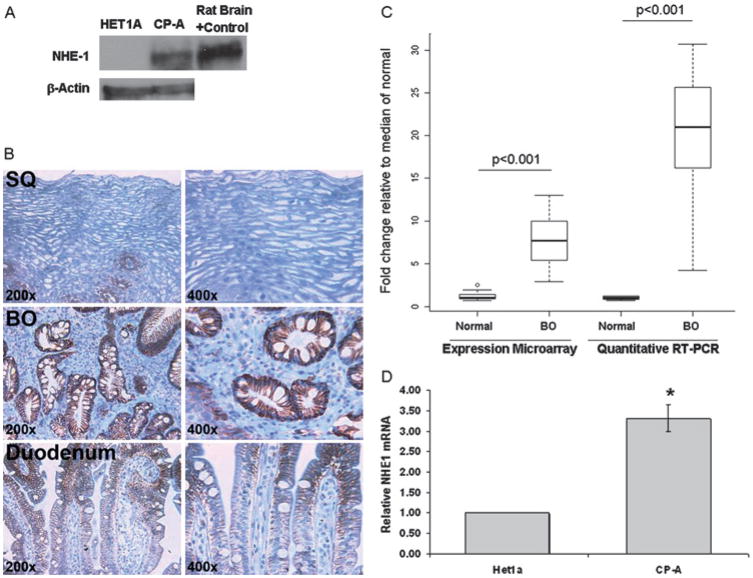
Next, we wanted to know if NHE1 expression differs in normal squamous HET1A cells and CP-A cells, derived from Barrett’s oesophagus, since our data suggests NHE-1 plays a critical role in pHi recovery following acid and bile acid-mediated acidification in CP-A cells. We also evaluated oesophageal biopsies and duodenum for the expression of NHE1. The NHE1 protein level was increased in CP-A cells compared to normal oesophageal HET1A cells, rat brain is used as a positive control (figure 7A). Minimal signal of NHE1 was detected in squamous epithelium, while robust expression was found uniformly in the cell membranes of Barrett’s oesophagus glands (figure 7B). Duodenal tissue expressed lower levels of NHE1. NHE1 signal was mild in the cell membranes on the top of villi and even lower expression was found in the duodenal crypts (figure 7B). Expression microarray and real time RT-PCR data confirmed that NHE1 mRNA is expressed at a significantly higher level in Barrett’s oesophagus compared to squamous epithelial tissue (p<0.001, figure 7C). Furthermore, high levels of NHE1 mRNA were detected in Barrett’s oesophagus-derived CP-A cells compared to squamous-derived HET1A cells (figure 7D).
Figure 7.
Evaluation of NHE1 in oesophageal cell lines and in human tissues. (A) A representative western blot of NHE1 and β-actin in HET1A and CP-A cells with rat brain as positive control. (B) Typical immunohistochemical staining of NHE1 in squamous epithelium (SQ), Barrett’s oesophagus (BE) and duodenum. (C) mRNA levels in normal squamous epithelium (SQ, N=13) and Barrett’s oesophagus tissues (N=18). Panel C shows boxplots of NHE1 expression measured by microarray analysis and RT-PCR in normal squamous epithelium (SQ, N=13) and Barrett’s oesophagus tissue (N=18). Results are shown normalised to the median of the normal squamous population for each technology. The p values for significant differences in NHE1 expression are shown. (D) Relative NHE1 mRNA levels in HET1A and CP-A cells.
DISCUSSION
Although the exact pathogenesis of Barrett’s oesophagus is unclear, it appears to be associated with severe, chronic reflux of gastric acid and bile acids. The mechanism of bile acid-induced carcinogenesis is probably multifactorial. In this study, we identified a potentially new mechanism through which bile acids induce DNA damage in oesophageal cells. Our data indicate that bile acids induce intracellular acidification, which is mediated by NOS activation, release of NO and subsequent inhibition of NHE. Bile acids in combination with acid elicit a synergistic decrease in pHi, which results in DNA damage similar to a 10-fold increase in acidity and may lead to mutations, genomic instability and progression to EAC.
During reflux episodes, oesophageal tissue is exposed to gastric acid. Previous clinical data reported that acid and bile exposure are high in patients with Barrett’s oesophagus. For example Menges et al reported that in the oesophagus of patients with Barrett’s oesophagus, the pH is <4 24.6% of the time and bilirubin levels (representing bile acid exposure) was present 34.7% of the time in a 24 h period 2. In addition, patients with Barrett’s oesophagus have an increased number of long acid/bile acid refluxes lasting more than 5 min.29 Consequently, our experiments were performed to reflect these long exposure times experienced by Barrett’s oesophagus and oesophageal cells by performing our acid and/or bile acid treatments for 10 min. In addition, the bile acid cocktail used in these experiments reflects a physiological combination of conjugated and unconjugated bile acids which display different chemical properties.
Glycine-conjugated bile acids have a pKa ~4. At this pH, glycine conjugated bile acids are non-ionised and can easily penetrate the cell membrane to activate different signalling pathways including NOS. In contrast, unconjugated bile acids such as deoxycholic acid are more active at pH 7 since their pKa is ~6.6.30 At this pH they are non-ionised and can easily penetrate the cell membrane to affect cellular processes.
In response to increased acidification, normal oesophageal cells may over-express proteins that regulate pH to manage the chronic acid overload. In this study we identified NHE1 as an important NHE isoform expressed in Barrett’s oesophagus tissues and Barrett’s oesophagus-derived cells. Biopsies obtained from patients with Barrett’s oesophagus and Barrett’s oesophagus derived CP-A cells show robust expression of NHE1, while normal oesophageal squamous epithelium, duodenum and normal oesophageal cells shows low NHE1 expression. This finding strengthens the notion that metaplastic change of the normal epithelium to Barrett’s oesophagus may be an adaptive process to regulate intracellular pH after exposure to acid.3 Furthermore, Fitzgerald et al suggested that NHE1 activity is important in Barrett’s oesophagus pathogenesis.31 Recent studies have shown that NHE1 may play an important role in cancer; its increased expression is associated with cell migration, tumour growth and invasion.32 In fact, it was suggested that repression of NHE1 expression is a potential new approach for the inhibition of tumour cell growth.33
While Barrett’s oesophagus cells may employ other pH regulatory systems, our data using the specific NHE1 inhibitor zoniporide suggest that more than 60% of pHi recovery in Barrett’s oesophagus cells is mediated through this single member of the NHE family. In contrast, normal oesophageal squamous epithelium probably expresses other members of NHE family proteins since the non-specific NHE inhibitor, DMA, was able to inhibit pHi recovery by ~30% in normal oesophagus-derived HET1A.
Previously, it was shown that NO has the ability to inhibit NHE.16 and that bile acids are capable of increasing NO several hours after exposure to bile acids in oesophageal cells.12 However, we have shown for the first time that bile acids induce the immediate activation of all three isoforms of NOS (iNOS, eNOS and nNOS), in Barrett’s oesophagus cells, through phoshorylation of specific residues. Importantly, NOS expression is increased in tissues as Barrett’s oesophagus progresses from non-dysplastic lesions to EAC.13 34
Our studies indicate that bile acids induce a dose-dependent decrease in intracellular pH. Importantly, this bile acid-induced acidification can be reversed by NOS inhibitors L-NAME and 1400W, and is enhanced by NHE inhibitors. Altogether, these data constitute strong evidence that NO plays a key role in acidification through inhibition of NHE in Barrett’s oesophagus.
A biphasic effect of bile acids on pHi was observed in CP-A cells. Initially, bile acids induced a transient alkalinisation lasting ~60 s, followed by marked acidification. We speculate that the transient alkalinisation is due to bile acids acting as weak acids35 and immediate proton extrusion via NHE. This transient alkalinisation induced by BA was abolished when cells were pre-incubated with the NHE inhibitor DMA. We speculate that following this initial event, bile acid-mediated production of NO inhibits acid extrusion, which leads to inhibition of NHE and intracellular acidification.
The combination of acid and bile acids significantly reduced pHi compared to treatment with acid alone. This effect of acid and BA can also be partially reversed by NOS inhibitors. However, we were unable to completely inhibit acidification with NOS inhibitors. This finding suggests that several mechanisms come into play as bile acids increase intracellular [H+]. Future studies should explore the acid loading mechanism such as the release of calcium stores and activation of the plasma membrane calcium ATPase (PMCA). This active transporter imports protons and thus can affect pHi.36 Bile acids have been shown to increase intracellular calcium via liberation of intra-cellular endoplasmic reticulum stores in several cell types,37 including oesophageal cells.38 It is also possible that bile acid-mediated bicarbonate excretion contributes to the intracellular acidification response.37
Venglovecz et al suggest that bile acids mediate acidification in pancreatic ductal cells through a bicarbonate-dependent mechanism, independent of NHE.37 Interestingly, the evidence of our results from oesophageal cells illustrates that bile acid-induced acidification is mediated almost exclusively through an NHE-dependent mechanism. In fact, we were unable to alter bile acid-induced acidification using bicarbonate-free medium or an inhibitor of bicarbonate transport (DIDS) (data not shown). These findings emphasise the diversity of cellular response to bile acids in different tissue and cell types.
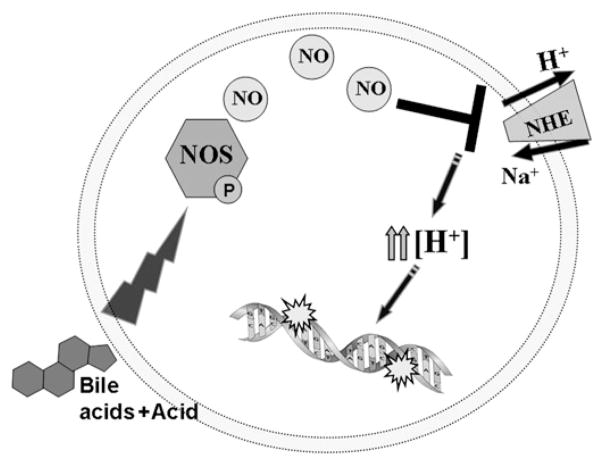
Previous reports indicate that acid causes DNA damage in vitro and in vivo.25 39 In addition, our recent study reported that bile acids in combination with acid induce significantly greater DNA damage than acid alone.18 Since our current data suggest that bile acids cause intracellular acidification, we wanted to focus on the acid-mediated DNA damage. We speculated that increased acidity will increase DNA damage. Therefore, we determined the pH that can induce the same changes to the intracellular pH as did pH 5.5 with 0.5 mM BA. This approach allowed us to eliminate other factors such as reactive oxygen or nitrogen species, previously shown to be responsible for bile acid-mediated DNA damage.12 18 40 Medium acidified to pH 4.5 was necessary to reduce pHi to the same extent as did medium at pH 5.5 in combination with bile acids. Exposure to pH 4.5 produced significantly increased DNA damage compared to pH 5.5. Immunohistochemical staining of γ-H2AX, a marker of DNA double-strand breaks confirmed these results. Importantly, DNA tail moment after exposure of CP-A cells to medium at pH4.5 was insignificantly different compared to DNA tail moment after exposure to medium at pH 5.5 with 0.5 mM BA and it was reduced by NOS inhibitors. These data suggest that the bile acids and acid-induced DNA damage is due, in part, to nitric oxide inhibition of NHE and subsequent intracellular acidification. Figure 8 summarises our proposed mechanism of DNA damage mediated by bile-acid and acid-induced acidification.
Figure 8.
Scheme of proposed mechanism of bile acid-induced acidification.
At this point we do not have direct evidence that the inhibition of NHE resulting from exposure to bile acids and acid is associated with increased DNA damage in vivo. However, indirect evidence suggests that this process could occur in vivo. First, activity of NHE1 under acid stress is associated with increased intracellular acidification in a rat model of oesophagitis.41 Second, inhibition of NHE by NO is associated with increased acidification in ciliary epithelium from porcine tissue.20 In addition, high expression of iNOS and the tissue accumulation of nitro-tyrosine, a marker of NO production, is common in human Barrett’s oesophagus as well as in a rat model of Barrett’s oesophagus.13 34 Third, acid induces DNA strand breaks in the human oesophagus, in vivo.25 Altogether, these conclusions constitute strong evidence that bile acid-mediated inhibition of NHE (our proposed mechanism) would result in DNA damage in vivo.
In summary, we have identified a new mechanism of bile acid induced damage. We found that bile acid-induced cellular acidification involves NO-mediated NHE inhibition. This inhibition leads to profound cellular acidification and DNA damage. Our data also suggest that Barrett’s oesophagus tissue adapts to acid exposure by upregulating NHE1. Therefore, in addition to acid reflux, bile reflux should to be controlled in patients with Barrett’s oesophagus.
Acknowledgments
Funding This work was supported by the GI SPORE grant CA95060 from NCI and NIH grant EY06951. Microarray data were generated by the Arizona Cancer Center Genomics Shared Service, supported by NCI grant CA023074-26.
Footnotes
Competing interests None.
Patient consent All tissue samples obtained for this study originate from the GI SPORE, HSC: #02-0785-01. Patient consent forms as required by the SPORE have been obtained and are housed at the VA hospital in Tucson, Arizona.
Provenance and peer review Not commissioned; externally peer reviewed.
References
- 1.Rastogi A, Puli S, El-Serag HB, et al. Incidence of esophageal adenocarcinoma in patients with Barrett’s oesophagus and high-grade dysplasia: a meta-analysis. Gastrointest Endosc. 2008;67:394–8. doi: 10.1016/j.gie.2007.07.019. [DOI] [PubMed] [Google Scholar]
- 2.Menges M, Muller M, Zeitz M. Increased acid and bile reflux in Barrett’s oesophagus compared to reflux esophagitis, and effect of proton pump inhibitor therapy. Am J Gastroenterol. 2001;96:331–7. doi: 10.1111/j.1572-0241.2001.03515.x. [DOI] [PubMed] [Google Scholar]
- 3.Ostrowski J, Mikula M, Karczmarski J, et al. Molecular defense mechanisms of Barrett’s metaplasia estimated by an integrative genomics. J Mol Med. 2007;85:733–43. doi: 10.1007/s00109-007-0176-3. [DOI] [PubMed] [Google Scholar]
- 4.Lindahl T, Nyberg B. Rate of depurination of native deoxyribonucleic acid. Biochemistry. 1972;11:3610–18. doi: 10.1021/bi00769a018. [DOI] [PubMed] [Google Scholar]
- 5.LeBoeuf RA, Kerckaert GA. The induction of transformed-like morphology and enhanced growth in Syrian hamster embryo cells grown at acidic pH. Carcinogenesis. 1986;7:1431–40. doi: 10.1093/carcin/7.9.1431. [DOI] [PubMed] [Google Scholar]
- 6.Zachos NC, Tse M, Donowitz M. Molecular physiology of intestinal Na+/H+ exchange. Annu Rev Physiol. 2005;67:411–43. doi: 10.1146/annurev.physiol.67.031103.153004. [DOI] [PubMed] [Google Scholar]
- 7.Siddique I, Khan I. Regulation of Na/H exchanger-1 in gastroesophageal reflux disease: possible interaction of histamine receptor. Dig Dis Sci. 2003;48:1832–8. doi: 10.1023/a:1025503318409. [DOI] [PubMed] [Google Scholar]
- 8.Rhodus NL, Cheng B, Myers S, et al. The feasibility of monitoring NF-kappaB associated cytokines: TNF-alpha, IL-1alpha, IL-6, and IL-8 in whole saliva for the malignant transformation of oral lichen planus. Mol Carcinog. 2005;44:77–82. doi: 10.1002/mc.20113. [DOI] [PubMed] [Google Scholar]
- 9.Jaiswal K, Lopez-Guzman C, Souza RF, et al. Bile salt exposure increases proliferation through p38 and ERK MAPK pathways in a non-neoplastic Barrett’s cell line. Am J Physiol Gastrointest Liver Physiol. 2006;290:G335–42. doi: 10.1152/ajpgi.00167.2005. [DOI] [PubMed] [Google Scholar]
- 10.Yui S, Kanamoto R, Saeki T. Biphasic regulation of cell death and survival by hydrophobic bile acids in HCT116 cells. Nutr Cancer. 2009;61:374–80. doi: 10.1080/01635580802582744. [DOI] [PubMed] [Google Scholar]
- 11.Dvorak K, Ramsey L, Payne CM, et al. Abnormal expression of biomarkers in incompletely ablated Barrett’s esophagus. Ann Surg. 2006;244:1031–6. doi: 10.1097/01.sla.0000224913.19922.7e. [DOI] [PMC free article] [PubMed] [Google Scholar]
- 12.Jolly AJ, Wild CP, Hardie LJ. Sodium deoxycholate causes nitric oxide mediated DNA damage in oesophageal cells. Free Radic Res. 2009;43:234–40. doi: 10.1080/10715760802684211. [DOI] [PubMed] [Google Scholar]
- 13.Vaninetti NM, Geldenhuys L, Porter GA, et al. Inducible nitric oxide synthase, nitrotyrosine and p53 mutations in the molecular pathogenesis of Barrett’s esophagus and esophageal adenocarcinoma. Mol Carcinog. 2008;47:275–85. doi: 10.1002/mc.20382. [DOI] [PubMed] [Google Scholar]
- 14.Papapetropoulos A, Rudic RD, Sessa WC. Molecular control of nitric oxide synthases in the cardiovascular system. Cardiovasc Res. 1999;43:509–20. doi: 10.1016/s0008-6363(99)00161-3. [DOI] [PubMed] [Google Scholar]
- 15.Zhang Y, Brovkovych V, Brovkovych S, et al. Dynamic receptor-dependent activation of inducible nitric-oxide synthase by ERK-mediated phosphorylation of Ser745. J Biol Chem. 2007;282:32453–61. doi: 10.1074/jbc.M706242200. [DOI] [PubMed] [Google Scholar]
- 16.Coon S, Kekuda R, Saha P, et al. Constitutive nitric oxide differentially regulates Na-H and Na-glucose cotransport in intestinal epithelial cells. Am J Physiol Gastrointest Liver Physiol. 2008;294:G1369–75. doi: 10.1152/ajpgi.00063.2008. [DOI] [PubMed] [Google Scholar]
- 17.Stoner GD, Kaighn ME, Reddel RR, et al. Establishment and characterization of SV40 T-antigen immortalized human esophageal epithelial cells. Cancer Res. 1991;51:365–71. [PubMed] [Google Scholar]
- 18.Goldman A, Condon A, Adler E, et al. Protective effects of glycoursodeoxycholic acid in Barrett’s esophagus cells. Dis Esophagus. 2009 doi: 10.1111/j.1442-2050.2009.00993.x. [DOI] [PubMed] [Google Scholar]
- 19.Nehra D, Howell P, Williams CP, et al. Toxic bile acids in gastro-oesophageal reflux disease: influence of gastric acidity. Gut. 1999;44:598–602. doi: 10.1136/gut.44.5.598. [DOI] [PMC free article] [PubMed] [Google Scholar]
- 20.Shahidullah M, Mandal A, Delamere NA. Responses of sodium-hydrogen exchange to nitric oxide in porcine cultured nonpigmented ciliary epithelium. Invest Ophthalmol Vis Sci. 2009;50:5851–8. doi: 10.1167/iovs.09-3453. [DOI] [PMC free article] [PubMed] [Google Scholar]
- 21.Watts GS, Tran NL, Berens ME, et al. Identification of Fn14/TWEAK receptor as a potential therapeutic target in esophageal adenocarcinoma. Int J Cancer. 2007;121:2132–9. doi: 10.1002/ijc.22898. [DOI] [PubMed] [Google Scholar]
- 22.Dvorakova K, Payne CM, Ramsey L, et al. Increased expression and secretion of interleukin-6 in patients with Barrett’s esophagus. Clin Cancer Res. 2004;10:2020–8. doi: 10.1158/1078-0432.ccr-0437-03. [DOI] [PubMed] [Google Scholar]
- 23.Gupta A, Butts B, Kwei KA, et al. Attenuation of catalase activity in the malignant phenotype plays a functional role in an in vitro model for tumor progression. Cancer Lett. 2001;173:115–25. doi: 10.1016/s0304-3835(01)00656-5. [DOI] [PubMed] [Google Scholar]
- 24.Kojima H, Urano Y, Kikuchi K, et al. Fluorescent indicators for imaging nitric oxide production. Angew Chem Int Ed Engl. 1999;38:3209–12. doi: 10.1002/(sici)1521-3773(19991102)38:21<3209::aid-anie3209>3.0.co;2-6. [DOI] [PubMed] [Google Scholar]
- 25.Zhang HY, Hormi-Carver K, Zhang X, et al. In benign Barrett’s epithelial cells, acid exposure generates reactive oxygen species that cause DNA double-strand breaks. Cancer Res. 2009;69:9083–9. doi: 10.1158/0008-5472.CAN-09-2518. [DOI] [PMC free article] [PubMed] [Google Scholar]
- 26.Garvey EP, Oplinger JA, Furfine ES, et al. 1400W is a slow, tight binding, and highly selective inhibitor of inducible nitric-oxide synthase in vitro and in vivo. J Biol Chem. 1997;272:4959–63. doi: 10.1074/jbc.272.8.4959. [DOI] [PubMed] [Google Scholar]
- 27.Masereel B, Pochet L, Laeckmann D. An overview of inhibitors of Na(+)/H(+) exchanger. Eur J Med Chem. 2003;38:547–54. doi: 10.1016/s0223-5234(03)00100-4. [DOI] [PubMed] [Google Scholar]
- 28.Clemons NJ, McColl KE, Fitzgerald RC. Nitric oxide and acid induce double-strand DNA breaks in Barrett’s esophagus carcinogenesis via distinct mechanisms. Gastroenterology. 2007;133:1198–209. doi: 10.1053/j.gastro.2007.06.061. [DOI] [PubMed] [Google Scholar]
- 29.Niemantsverdriet EC, Timmer R, Breumelhof R, et al. The roles of excessive gastro-oesophageal reflux, disordered oesophageal motility and decreased mucosal sensitivity in the pathogenesis of Barrett’s oesophagus. Eur J Gastroenterol Hepatol. 1997;9:515–19. doi: 10.1097/00042737-199705000-00019. [DOI] [PubMed] [Google Scholar]
- 30.Kauer WK, Stein HJ. Bile reflux in the constellation of gastroesophageal reflux disease. Thorac Surg Clin. 2005;15:335–40. doi: 10.1016/j.thorsurg.2005.03.004. [DOI] [PubMed] [Google Scholar]
- 31.Fitzgerald RC, Omary MB, Triadafilopoulos G. Altered sodium-hydrogen exchange activity is a mechanism for acid-induced hyperproliferation in Barrett’s esophagus. Am J Physiol. 1998;275:G47–55. doi: 10.1152/ajpgi.1998.275.1.G47. [DOI] [PubMed] [Google Scholar]
- 32.Fliegel L. The Na+/H+ exchanger isoform 1. Int J Biochem Cell Biol. 2005;37:33–7. doi: 10.1016/j.biocel.2004.02.006. [DOI] [PubMed] [Google Scholar]
- 33.Kumar AP, Quake AL, Chang MK, et al. Repression of NHE1 expression by PPARgamma activation is a potential new approach for specific inhibition of the growth of tumor cells in vitro and in vivo. Cancer Res. 2009;69:8636–44. doi: 10.1158/0008-5472.CAN-09-0219. [DOI] [PubMed] [Google Scholar]
- 34.Bae JD, Jung KH, Ahn WS, et al. Expression of inducible nitric oxide synthase is increased in rat Barrett’s esophagus induced by duodenal contents reflux. J Korean Med Sci. 2005;20:56–60. doi: 10.3346/jkms.2005.20.1.56. [DOI] [PMC free article] [PubMed] [Google Scholar]
- 35.Strazzabosco M, Sakisaka S, Hayakawa T, et al. Effect of UDCA on intracellular and biliary pH in isolated rat hepatocyte couplets and perfused livers. Am J Physiol. 1991;260:G58–69. doi: 10.1152/ajpgi.1991.260.1.G58. [DOI] [PubMed] [Google Scholar]
- 36.Daugirdas JT, Arrieta J, Ye M, et al. Intracellular acidification associated with changes in free cytosolic calcium. Evidence for Ca2+/H+ exchange via a plasma membrane Ca(2+)-ATPase in vascular smooth muscle cells. J Clin Invest. 1995;95:1480–9. doi: 10.1172/JCI117819. [DOI] [PMC free article] [PubMed] [Google Scholar]
- 37.Venglovecz V, Rakonczay Z, Jr, Ozsvari B, et al. Effects of bile acids on pancreatic ductal bicarbonate secretion in guinea pig. Gut. 2008;57:1102–12. doi: 10.1136/gut.2007.134361. [DOI] [PubMed] [Google Scholar]
- 38.Feagins LA, Zhang HY, Hormi-Carver K, et al. Acid has antiproliferative effects in nonneoplastic Barrett’s epithelial cells. Am J Gastroenterol. 2007;102:10–20. doi: 10.1111/j.1572-0241.2006.01005.x. [DOI] [PubMed] [Google Scholar]
- 39.Jolly AJ, Wild CP, Hardie LJ. Acid and bile salts induce DNA damage in human oesophageal cell lines. Mutagenesis. 2004;19:319–24. doi: 10.1093/mutage/geh035. [DOI] [PubMed] [Google Scholar]
- 40.Jenkins GJ, D’Souza FR, Suzen SH, et al. Deoxycholic acid at neutral and acid pH, is genotoxic to oesophageal cells through the induction of ROS: the potential role of anti-oxidants in Barrett’s oesophagus. Carcinogenesis. 2007;28:136–42. doi: 10.1093/carcin/bgl147. [DOI] [PubMed] [Google Scholar]
- 41.Fujiwara Y, Higuchi K, Takashima T, et al. Roles of epidermal growth factor and Na+/H+ exchanger-1 in esophageal epithelial defense against acid-induced injury. Am J Physiol Gastrointest Liver Physiol. 2006;290:G665–73. doi: 10.1152/ajpgi.00238.2005. [DOI] [PubMed] [Google Scholar]


