Abstract
The integration of a high resolution PET insert into a conventional PET system can significantly improve the resolution and the contrast of its images within a reduced imaging field of view. For the rest of the scanner imaging field of view, the insert is a highly attenuating and scattering media. In order to use all available coincidence events (including coincidences between 2 detectors in the original scanner, namely the scanner-scanner coincidences), appropriate scatter and attenuation corrections have to be implemented. In this work, we conducted a series of Monte Carlo simulations to estimate the composition of the scattering background and the importance of the scatter correction. We implemented and tested the Single Scatter Simulation (SSS) algorithm for a hypothetical system and show good agreement between the estimated scatter using SSS and Monte Carlo simulated scatter contribution. We further applied the SSS to estimate scatter contribution from an existing prototype PET insert for a clinical PET/CT scanner. The results demonstrated the applicability of SSS to estimate the scatter contribution within a clinical PET/CT system even when there is a high resolution half ring PET insert device in its imaging field of view.
Keywords: Compton scattering, image resolution, positron emission tomography, Single Scatter Simulation
I. Introduction
It is well known that the image resolution of positron emission tomography (PET) is limited by several physical factors such as positron range, acolinearity of annihilation photons, and detector intrinsic spatial resolution. For most of the current scintillator-based PET systems, the physical dimension of the scintillation crystals remains the key factor that determines the spatial resolution of the system. The attempt to improve resolution by using small crystals results in significant increase in the cost of a PET system while the reduced packing fraction of the crystal array may decrease the overall sensitivity of the system. We have previously demonstrated that a PET insert device [1]-[3] can significantly improve the resolution of a standard PET scanner via use of higher resolution PET detectors and virtual pinhole PET geometry. On the other hand, the insert device itself is a highly attenuating object inside the imaging field of view (FOV) of the original PET scanner. Attenuation of the gamma rays by the insert device must be properly addressed before the images can be correctly reconstructed. The simple geometry-based correction for the attenuation by the insert media can be problematic due to the significant scattering component that is not equally attenuated by the insert.
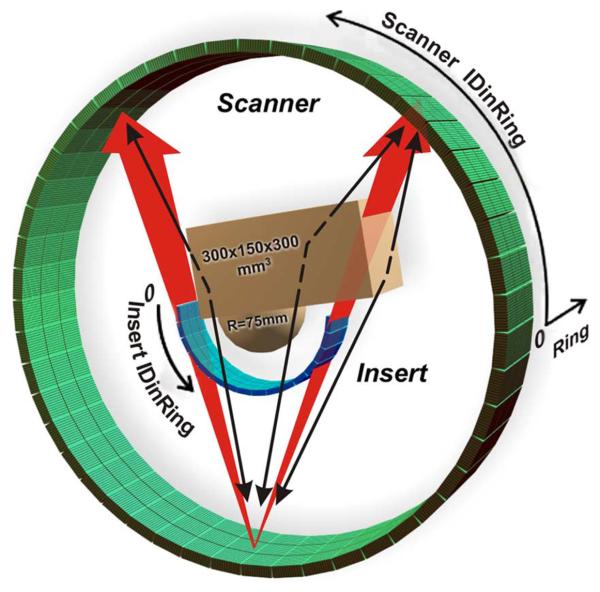
An example of the problem associated with direct attenuation correction is presented in Fig. 1 and Fig. 2. Monte Carlo simulation was used to model an object imaged by a PET scanner with and without an insert device in the FOV (see Fig. 1). The object was modeled as a box and hemisphere with uniform activity concentration. The projection profiles viewed from the vertex of the fan (shown as the intercept of the two red arrows in the drawing) were summed across the axial direction to obtain a 1D histogram (plotted in Fig. 2). The blue line (2) is the projection simulated with the insert in the FOV; the black line (1) is the result of simulation without an insert in the FOV; and the dotted red line (3) is the result of the blue line (2) corrected by a simple attenuation correction based on the known geometry and density of the insert. Ideally, the dotted red line (3) should overlap with the black one (1). However, as can be seen here, some of the scanner-scanner lines-of-response (LORs) were dramatically overcorrected. This error results from the fact that the true coincidences for some LORs (red arrows in Fig. 1) are subjected to very strong attenuation by the insert, while some scattered gammas may bypass the insert (black thin arrows in Fig. 1) and still reach the detectors. As a result, Compton scattering needs to be accurately modeled before the attenuation correction is applied in order to minimize artifacts in reconstructed images.
Fig. 1.
The model of the scanner (RScanner = 422 mm: 39 rings of 624 crystals each) with the high resolution insert (RInsert = 135 mm: 48 half rings of 256 crystals each) and the chest-breast water phantom (combination of the 300 × 150 × 300 mm3 box and hemisphere R = 75 mm) used in MC simulations. Crystal sizes are 4 × 4 × 20 mm3 for the scanner and 1.6 × 1.6 × 10 mm3 for the insert.
Fig. 2.
Profiles obtained from the sum of the scanner to scanner (SS) projections (sum over all scanner rings). The position of the projector scanner crystals are shown in Fig. 1. Black solid line (1) is for the scanner without the insert (no attenuation). Blue solid line (2) is for the scanner with the insert (attenuated). Dotted red line (3) is the result of the attenuation correction applied to the blue line (2). In an ideal case the dotted red line (3) should follow the black one (1).
In this work we investigated the applicability of the Single Scatter Simulation (SSS) correction technique developed by C. C. Watson [4], [5] for a clinical PET/CT scanner with a high-resolution PET insert device in its FOV. The SSS assumes that for the majority of the detected scatter events, only one of two 511 keV gammas was scattered before detection. According to C.C. Watson formulation, the scattering contribution to the LOR formed by the detector pair A and B is given by the volume integral over the scattering media VS
| (1) |
where the line integrals I(A) and I(B) are given by
| (2) |
and
| (3) |
Here S is a scattering point in a volume dVS. RA,BS are the distances from S to the detectors A and B. σA,BSand εA,BS are the geometrical cross sections and detection efficiencies of the detectors A and B. μ is a linear attenuation coefficient.σC and dσC/dΩ are the total and differential Compton cross sections. λ is an emitter density in the object. The energy of scattered gamma E′ is determined by the scattering angle for the scattering detection path ASB.
The applicability of SSS for our system depends on the answers to the following questions. Are the single scatter events dominant? How important is the scattering by detectors in the PET insert device? Or more specifically, should we include the scattering by the insert in SSS?
According to (1), we can expect that the scattering background will be proportional to the object volume. We hypothesize that objects that are small and dense (such as LSO crystals) will act more like attenuators than scattering media. If proven true, the scattering events will be mostly contributed by the large phantom body rather than the high-density LSO detectors in the PET insert device.
The first part of the article deals with Monte Carlo (MC) simulations of a hypothetical PET insert system shown in Fig. 1. The simulated scatter contribution was compared with the SSS results for this system. In the second part, the SSS was applied to estimate scatter contribution in a clinical PET/CT scanner with a prototype high resolution PET insert device in the scanner FOV. The results of simulations are compared to experimentally acquired data.
II. Monte Carlo Simulations
We have developed our own fast Monte Carlo simulation code that allows us to study the composition of scattering events detected by a hypothetical PET insert system. This code tracks the photons and accounts for the photoelectric and Compton interactions only. The simulated system geometry is presented in Fig. 1.
The scanner consists of 144 detector modules arranged into 3 rings (RScanner = 422 mm). Each module consists of 13 × 13 LSO crystals (4 × 4 × 20 mm3 each). The insert are built from 48 detector modules arranged into 3 half rings (RInsert = 135 mm). Each insert module consists of 16 × 16 LSO crystals (1.6 × 1.6 × mm3 each). For convenience, we consider the scanner as a system of 39 rings of 624 crystals each and the insert as a system of 48 half rings of 256 crystals each. Lower level discriminator (LLD) was set to 450 keV for both the scanner and insert detectors as this is the typical value used in our clinical imaging protocol.
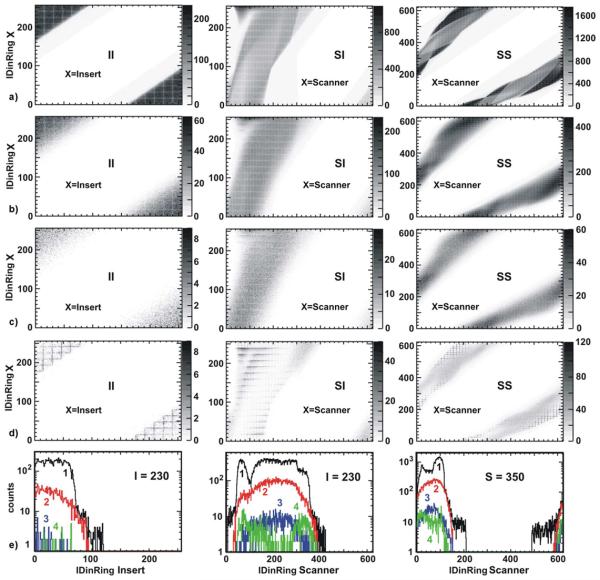
The output of the simulation was sorted into 4 overlapping types of coincidences matrices—prompt coincidences (true + random + scatter), scatter coincidences (at least one gamma was scattered before detection), multiple scatter coincidences (more than one scattering event for one gamma or both gammas were scattered) and LSO scattered coincidences (at least one of the detected gammas was scattered by another detector module before detection). Multiple scattering inside the same detector module was not considered as a scatter event as long as this gamma was not scattered before reaching the detector module. The corresponding 2D pseudo-sinograms (or coincidence histograms summed across the axial direction) for insert-insert (II), scanner-insert (SI) and scanner-scanner (SS) are shown in Fig. 3. The cross section of these histograms at some fixed value IDinRing (these crystals can be considered as the projectors) gives the 1D sum projection of the phantom to the corresponding detector plane. The color maps of all 2D histograms presented in this article are normalized to the maximum histogram value.
Fig. 3.
Chest-breast water phantom MC simulation. II, SI and SS detector coincidences 2D matrices (pseudo-sinograms) for: a) prompt; b) all scatter coincidences; c) multiple scatter coincidences; d) scattered by LSO. Multiple interactions in the same module are not considered as a scattering if the gamma was not scattered before. The examples of the corresponding 1D projection are presented in (e). The projector crystals IDinRing are specified in the plots. Black line (1) is the prompt (see a), red line (2) is all scatter detections (see b), blue line (3) is the multiple scattering (see c), green line (4) is the LSO scattering (see d). The LLD was set to 450 keV.
As can be seen from these histograms, the number of LSO scatter and multiple scatter events are less than 10% of the total scatter events for all LORs. This suggests that we can exclude the integration over the insert module volumes from the integral (1) when applying SSS to estimate the total scatter contribution. Instead, the insert will be considered in the line integrals (2) and (3) as an attenuation media with known geometry. This fact significantly simplifies the implementation of the SSS for our system.
III. SSS and MC Simulations
Following the MC simulation, the numerical calculation of the (1) can be simplified by integrating over the phantom volume only. The LSO crystals in the PET insert detector modules were considered as attenuating and non-scattering objects with known geometry. The phantom was voxelized by the rectangular 3D grid with 25 mm step (dVS = 253 mm3). The voxel density and activity were taken as a mean density and activity of the phantom in this voxel. The integration was done only over voxels with mean density greater than 10% of the original phantom density.
The scattering points S were randomly generated inside every phantom voxel. The line integrals (2) and (3) were calculated along the lines connecting the scattering point S with the centers of the pair of crystals under consideration. The path-length of these lines inside the phantom was calculated on the basis of voxel representation rather than on the real geometry of the phantom. However, the path-length inside the detector modules was calculated using the known geometry of the insert and scanner.
The simulation was done for a phantom with uniform background activity. The final result of SSS was scaled to fit to the MC simulated data.
The SSS was performed in two steps. First, we calculated and stored in memory all required information related to the scattering paths of “scatter point S—detector crystal” for 450 keV and 511 keV. Then we calculated the scatter contribution to every detector pair AB from every scattering point S. To obtain the data corresponding to the gamma energy E′ (the gamma energy after the scattering into the angle corresponding to the ASB path), we use the linear interpolation from the stored data for 511 keV and 450 keV. Only the paths ASB with scattered gamma energy E′ higher than LLD were taken into account.
The projections (II, SI and SS) calculated by SSS were fitted to the corresponding projections from MC simulation using the tails of the projection profiles—the regions outside the phantoms activity. Random events were subtracted from prompt events in the MC data before fitting. It is important to point out that the SSS data was fitted to the “prompt minus random” of the MC data instead of the scatter data because in a real imaging situation “prompt minus random” is what is available for data fitting.
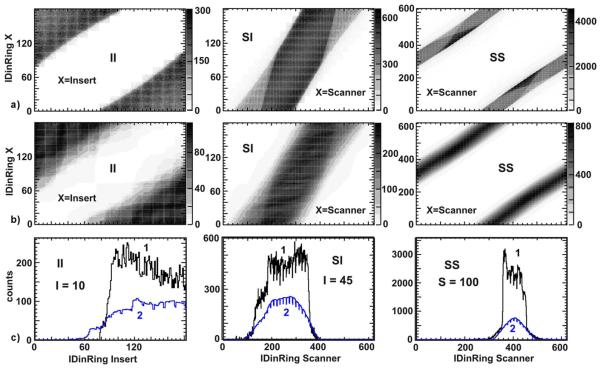
Comparison of the fitted SSS data with directly simulated scatter data shows a good agreement between SSS and MC simulated scatter component for most LORs. The SSS calculated scattering distributions in pseudo-sinograms are shown in Fig. 4(a). Fig. 4(b) and 4(c) show profiles extracted from the SSS simulated data (shown in blue (2)) and the MC simulated data (shown in black (1)). The crystal ID shown in the plots corresponds to the crystal located at the vertex of a fan that was used to extract the projection profiles.
Fig. 4.
The comparison of MC simulated scatter contribution with that estimated by SSS (Single Scatter Simulation): a) II, SI and SS detector coincidences 2D matrixes (pseudo-sinograms) for scatter events estimated by SSS; b) and c) the profiles extracted from detector coincidences matrix of scatter events. Blue lines (2) are profiles extracted from (a) above. Black lines (1) are the profiles extracted from the MC simulations. The IDinRing of the crystals used to extract the profiles are specified in the plots.
IV. Implementation of SSS for Existing Insert Prototype
We have used SSS to estimate the contribution from the scattering events to the data obtained from the experimental scan of Flanged Jaszczak ECT phantom (ACR phantom). The experimental setup is shown in Fig. 5. The scanner has 3 rings of 48 detector modules with 13 × 13 LSO crystals per (4×4×20 mm3) per block. The insert has 2 half rings of 14 detector modules with 13 × 13 LSO crystals (2×2×5 mm3) per block. The scanner and insert radii were RScanner = 438 mm and RInsert = 124 mm, respectively. The phantom outer dimensions are 222 mm in diameter and 211mm in length. The inner dimensions are 211mm in diameter and 195 mm in length.
Fig. 5.
The Flanged Jaszczak ECT Phantom in the PET system with the high resolution insert (RScanner = 438 mm, RInsert = 124 mm, DACR = = 211 mm, LACR 222 mm, LFOV = 164 mm).
The LSO modules are the densest media inside the scanner's field of view. Thus we restricted our simulations to only model the phantom and LSO crystals to reduce computation time. The phantom in simulation was represented by the 28×19×11 voxel structure. Voxel sizes were 22 × 22 × 22 mm3. To generate this voxel structure we down-sampled the available high resolution 3D attenuation coefficient map obtained from the CT scan. The attenuation coefficient map was converted into equivalent water density map. To minimize the simulation time, only those voxels with density higher than 1% of the maximum density of the phantom were used in the calculation. Activity concentration within the phantom was based on the emission images reconstructed without scatter correction, a common implementation for the SSS method in clinical PET scanners. The emission images were down-sampled to match the grid structure used in simulation. All voxels with zero density were set to zero activity.
As can be seen in Fig. 5, part of the phantom was outside the scanner volume. For this reason we extended the activity and density distribution in the axial direction by replicating the last slice of the corresponding images along the axial direction several times. The rest of the simulation was similar to the SSS described in the previous section. The LSO crystals were considered as an attenuation media with known geometry, exactly as before.
The experimentally measured “prompt minus random” events are shown in Fig. 6(a) for II, SI and SS types of coincidences. Scatter distribution estimated by SSS are presented in Fig. 6(b) for the 3 types of coincidence events. Profiles extracted from Fig. 6(a) and 6(b) are shown in Fig. 6(c). It can be seen that the estimated scatter profiles by the SSS match the tails of the measured profiles (outside of the object) very well for SI and SS data. For the II data, since the edge of the phantom was very close to the edge of the FOV imposed by coincidence processor, the Compton tail of the experimental data falls outside of the FOV and appears to be truncated. Therefore, the mismatch shown in Fig. 6(c)-II is not due to error in the SSS calculation, but rather a mismatch between the theoretical calculation and the experimental data being stripped off by hardware-imposed FOV. Before the estimated scatter is incorporated into the image reconstruction process, the SSS estimated Compton tails also needs to be truncated to match the system's imaging FOV. Therefore, this mismatch should not affect the final reconstructed image.
Fig. 6.
Flanged Jaszczak ECT Phantom scan: a) II, SI and SS detector coincidences 2D matrices (pseudo-sinograms) obtained in an experiment (prompt minus random); b) II, SI and SS detector coincidences 2D matrices for scatter events simulated by SSS; c) the cross sections (or projections) of scatter detector coincidences matrix. Blue lines (2) are for the cross sections of scatter histogram presented above. Black lines (1) are the projections of histograms obtained in an experiment. The IDinRing of the crystals used as projectors are shown in the plots.
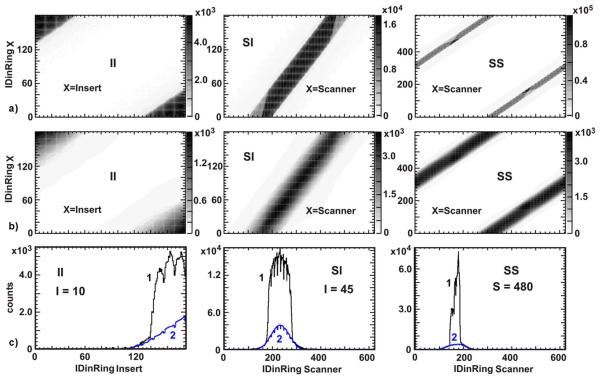
In another example, we used the same prototype PET insert device to image a small tumor phantom that is 11 cm in diameter and 11 cm long. This phantom was located completely inside the scanner and there was no need to extend the available attenuation map and pre-estimated emission image. The measured “prompt minus random” events are shown in Fig. 7(a). The scatter contribution estimated by SSS is shown in Fig. 7(b), and the profiles extracted from 7a and 7b are shown in Fig. 7(c). Due to the smaller size of the tumor phantom when compared with ACR phantom, the Compton scatter tail can be clearly seen in the experimentally measured II, SI and SS data. In this case, the SSS estimated profiles match the tails of the measured profiles very well for all detector coincidence types—II, SS and SI.
Fig. 7.
Small tumor phantom scan: a) II, SI and SS detector coincidences 2D matrices (pseudo-sinograms) obtained in an experiment (prompt minus random); b) II, IS and SS detector coincidences 2D matrixes for scatter events simulated by SSS; c) the cross sections (or projections) of scatter detector coincidences matrix. Blue lines (2) are the cross sections of scatter histogram presented above. Black lines (1) are the projections of histograms obtained in an experiment. The IDinRing of the crystals used as projectors are shown in the plots.
V. Discussions
The SSS correction requires a trade-off between precision and simulation time. To simplify implementation of SSS for the PET insert system, we did not model the gantry of the insert device, the photomultiplier tubes and the readout boards. As a result, there is a small deviation between the SSS simulations and the experimental result for the scanner-scanner type of LORs that pass through the insert device (and hence through all the objects listed above). This can be fixed by modeling all the components in the insert device, but at the cost of a significant increase in simulation time.
In the current implementation of the SSS, we simulated the scatter contribution for every detector pair and it took a few hours to complete. Because the edge of the phantom was very close to the insert detectors, we could not increase the voxel size significantly to further reduce the number of scatter points used in simulations. A potential way to reduce the computation time further is to calculate the scatter contribution for a subset of detector pairs only. Since the scatter distribution is generally a smooth function, scatter contribution to other detector pairs can be interpolated from the simulated neighboring detector pairs. Since the number of the detector pairs is roughly proportional to the square of the number of crystals in a system, the saving in computation time can be significant.
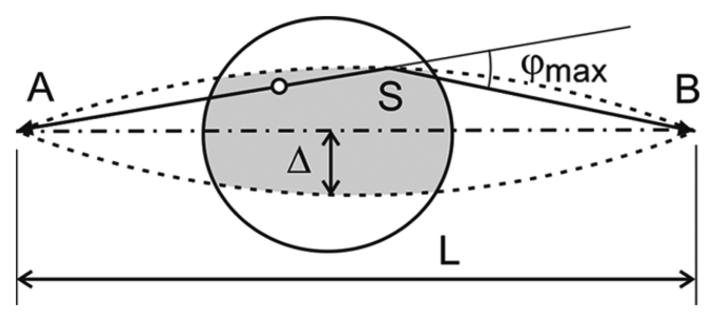
To model the scattering contribution from a patient body under a realistic imaging condition, we have to take into account the activity distribution and object density outside of the scanner's axial FOV. To estimate which part of the object should be included in the SSS calculation, we can consider a pair of detectors and shown in Fig. 8. The distance between A and B is L. A “single scattered” event can be detected by this detector pair only if the decay and scattering happen inside the region that is defined by rotating the arc ASB with a radius R = L/(2 sin φmax), where φmax is the maximum possible scattered angle for a given LLD. From this illustration, it is clear that we do not need to include in the SSS calculation the part of the object that is outside of the shaded region defined by Δ = L(1−cos φmax)/(2 sin φmax). This estimation applies not only to the part of the object that is in the imaging plane, but also to the parts that are outside the scanner FOV along the axial direction. In the case of the small tumor phantom, the entire phantom was inside the imaging FOV. There was no need to estimate the activity outside of the axial FOV. In the case of the ACR phantom, we simply replicate the edge slices to estimate the attenuation and emission maps of the object outside the axial FOV by a distance Δ that is defined by a LLD = 450keV, but not further than the axial extend of the ACR phantom. This is possible because the phantom is cylindrical and has a fairly uniform activity and density distribution. In the case of patient imaging, we envision that the PET insert device will be utilized after a regular whole body PET/CT imaging session in order to zoom-in the region of interest (such as the head-and-neck region or brain) and to provide higher resolution PET images. In this case, the whole body PET and CT images can be used to define the emission and attenuation maps outside of the axial FOV of the PET insert device in order to accurately compute the scatter contribution using the SSS method.
Fig. 8.
The horizon for single scatter events. Only the activity inside the region formed by the rotation of the arc ASB with radius R = L/(2 sin φmax) is a maximum can contribute to the signal detected by detector pair AB. φmax is a maximum possible scattered angle for given LLD.
VI. Conclusion
We investigated scatter distribution within a clinical PET/CT scanner when a hypothetical PET insert device is integrated into its imaging FOV via Monte Carlo simulations. We also implemented single scatter simulation technique for a prototype PET insert device and compared the experimentally measured profiles with the SSS simulated profiles. By comparing the projection profiles in the regions outside of the phantom, we find that the SSS produces reasonable estimate of scatter distribution that is in a good agreement with the experimental data. As a result, we conclude that SSS can be used to model scatter distribution when a high resolution PET insert device is in the imaging FOV of a clinical PET/CT scanner. This approach has been incorporated into the image reconstruction framework for the PET insert system. Quantitative accuracy of the reconstructed images using scatter estimation from SSS will be evaluated in the future.
Acknowledgments
This work was supported in part under Grants by the National Cancer Institute of the National Institutes of Health (R33-CA110011, R24-CA83060, and P30-CA91842) and by Susan G. Komen for the Cure (BCTR0601279).
REFERENCES
- 1.Wu H, Pal D, Song TY, O'Sullivan JA, Tai Y-C. Micro insert: A prototype full-ring PET device for improving the image resolution of an animal PET scanner. J. Nucl. Med. 2008 Oct.49(no. 10):1668–1676. doi: 10.2967/jnumed.107.050070. [DOI] [PMC free article] [PubMed] [Google Scholar]
- 2.Tai Y-C, Wu H, Pal D, O'Sullivan JA. Virtual-pinhole PET. J. Nucl. Med. 2008;49(no. 3):471–479. doi: 10.2967/jnumed.107.043034. [DOI] [PMC free article] [PubMed] [Google Scholar]
- 3.Wu H, Pal D, O'Sullivan JA, Tai Y-C. A feasibility study of a prototype PET insert device to convert a general purpose animal PET scanner to higher resolution. J. Nucl. Med. 2008;49(no. 1):79–87. doi: 10.2967/jnumed.107.044149. [DOI] [PubMed] [Google Scholar]
- 4.Watson CC, et al. A single scatter simulation technique for scatter correction in 3D PET. In: Grangeat P, Amans J-L, editors. Three-Dimensional Image Reconstruction in Radiology and Nuclear Medicine. Kluwer; Norwell, MA: 1996. pp. 255–268. [Google Scholar]
- 5.Watson CC. Extension of single scatter simulation to scanner correction of time-of-flight PET. IEEE Trans. Nucl. Sci. 2007 Oct.54(no. 5):1679–1686. [Google Scholar]


