Abstract
Accurate characterization of tissue pathologies using ultrasonic attenuation is strongly dependent on the accuracy of the algorithm that is used to obtain the attenuation coefficient estimates. In this paper, computer simulations were used to compare the accuracy and the precision of the three methods that are commonly used to estimate the local ultrasonic attenuation within a region of interest (ROI) in tissue; namely, the spectral log difference method, the spectral difference method, and the hybrid method. The effects of the inhomgeneities within the ROI on the accuracy of the three algorithms were studied, and the optimal ROI size (the number of independent echoes laterally and the number of pulse lengths axially) was quantified for each method. The three algorithms were tested for when the ROI was homogeneous, the ROI had variations in scatterer number density, and the ROI had variations in effective scatterer size. The results showed that when the ROI was homogeneous, the spectral difference method had the highest accuracy and precision followed by the spectral log difference method and the hybrid method, respectively. Also, when the scatterer number density varied, the spectral difference method completely failed, while the log difference method and hybrid method still gave good results. Lastly, when the scatterer size varied, all of the methods failed.
INTRODUCTION
The ultrasonic attenuation coefficient is an important parameter in the characterization of tissue pathologies. In liver disease, inflamed livers were shown to have lower than normal attenuation coefficients while cirrhotic livers have higher than normal attenuation coefficients (Kuc and Schwartz, 1979). In breast tissue, the attenuation coefficient is low for fatty tissue and medullary carcinoma and high for infiltrating ductal carcinoma and fibrosis (Landini et al., 1985; Landini and Sarnelli, 1986). Accurate characterization of tissue pathologies using ultrasonic attenuation is strongly dependent on the accuracy of the algorithm that is used to obtain the attenuation coefficient estimates.
One method for estimating the ultrasonic attenuation coefficient is the spectral shift technique (Flax et al., 1983; Parker and Waag, 1983; Leeman et al., 1984; Narayana and Ophir, 1984; Bigelow and O’Brien, 2006). This method is a parametric approach that assumes a Gaussian spectral shape of the propagating pulse and echo and estimates the attenuation coefficient slope by measuring the downshift in the center frequency with respect to depth. The downshift in the center frequency is caused by the higher attenuation of the high frequencies compared to the low frequencies. A number of time domain and frequency domain techniques were used to estimate the change in the center frequency with respect to depth. In the time domain, the number of sign changes per unit interval gives an estimate of the center frequency under the assumption of a narrow band signal (Flax et al., 1983; Leeman et al., 1984; Narayana and Ophir, 1984). In the frequency domain, the center frequency can be estimated by calculating the first moment of the power spectrum (Parker et al., 1988) or by fitting a Gaussian function to the spectrum and finding the mean frequency (Bigelow and O’Brien, 2006). One disadvantage of the spectral shift method is that it does not normally correct for the effects of diffraction which leads to inaccurate estimates of the attenuation coefficient. While some corrections have been developed for spherically focused sources when the ROI is within the focal zone, these methods are challenging to implement in a clinical setting where array sources are used (Bigelow and O’Brien, 2006).
In order to correct for the diffraction effects, other methods for estimating the ultrasound attenuation coefficient have been developed. These methods use a tissue mimicking phantom (TMP) to obtain a reference power spectrum. The most common is the spectral difference method which measures the decay of the power spectrum frequency components with respect to depth to estimate the attenuation coefficient as a function of frequency (Parker and Waag, 1983; Parker et al., 1988; Yao et al., 1990). Another reference phantom technique is the spectral log difference method which assumes that the attenuation has a linear frequency dependence and obtains an estimate of the attenuation coefficient slope by calculating the slope of the straight line that fits the log ratio (difference between log spectra) of the two power spectra from the proximal and the distal segments of the region of interest (ROI) (Kuc and Schwartz, 1979; Kuc, 1980; Insana et al., 1983et al.,; Kuc, 1984). The hybrid method is a recently developed technique that estimates the attenuation coefficient slope by measuring the downshift in the center frequency of the spectra that result from multiplying the power spectra, of windowed segments at various depths of the ROI, by a Gaussian filter (Kim and Varghese, 2008). The hybrid method and the spectral log difference method are theoretically not affected by some of the variations in the backscatter that occur at boundaries.
The spectral difference method, the spectral log difference method, and the hybrid method have all been used for estimating the attenuation in liver, kidney, cervix, rat tumors, etc. (Kuc and Schwartz, 1979; Kuc, 1980; Hall et al., 1996; Oelze et al., 2002; McFarlin et al., 2006; Bigelow et al., 2008). The accuracy and the precision of these methods are strongly dependent on the ROI size (the number of independent echoes laterally and the number of pulse lengths axially) and on the level of homogeneity within the ROI. However, there has been no quantitative comparison of the minimum ROI size that is required for each method to obtain certain accuracy and precision in the attenuation coefficient estimates. Furthermore, the limitations of each technique have not been completely studied. Specifically, errors that result from in-homogeneities due to differences in scatterer size have not been considered. This is especially true for the hybrid method since the original paper on this work (Kim and Varghese, 2008) implies that the method will yield reliable attenuation estimates when the backscatter changes within the ROI without distinguishing between backscatter changes due to number density variations and backscatter changes due to scatter size variations. In this study, we use computer simulations to generate ROIs that are homogeneous, ROIs that have the same scatterer size but different scatterer number densities, and ROIs that have the same scatterer number density but different scatterer sizes. The accuracy and precision of the three attenuation estimation techniques are then compared as a function of ROI size in all the simulation cases. The spectral difference method and the spectral log difference method make no prior assumption about the frequency dependence of the attenuation. The hybrid method, however, assumes that the attenuation increases linearly with frequency. In order to evaluate how variations in backscatter affect each method, we have chosen a linear frequency dependence of the attenuation in the sample. In reality, many tissues have a power law frequency dependence. However, because of the relatively small bandwidths of the current diagnostic transducers, the attenuation can be assumed to have a linear frequency dependence over the usable frequency range of most transducers.
SUMMARY OF THE ALGORITHMS
The spectral difference method
In order to estimate the ultrasonic attenuation in an ROI of a sample (material of interest), the same transducer and the same power settings are used to obtain backscattered signals from the tissue sample and from a homogeneous TMP. The TMP has a known attenuation coefficient and a sound speed that closely matches the sound speed in soft tissue. Each radio frequency (RF) echo line of the ROI is partitioned into several overlapping time-gated windows. The Fourier transform is applied to every window, and the power spectra of the windows that correspond to the same depth are averaged. The same procedure is performed on the region of the reference phantom that has the same compared depth as the ROI of the sample. In standard pulse echo imaging, the measured power spectrum of a windowed region in a statistically homogeneous tissue is given by (Hyungsuk and Varghese, 2007)
| (1) |
This equation assumes that the windows that are used to gate the echoes are small compared to the depth of focus of the transducer so that the variations of the field within each gated region could be ignored (Bigelow and O’Brien, 2004; Kim and Varghese, 2008). The subscripts represent the sample. The distance from the surface of the transducer to the center of a particular time-gated window within the ROI is denoted by z. The frequency is denoted by f. P(f) represents the combined effect of the transmit pulse and the transducer sensitivity (electro-acoustic and acousto-electric transfer functions). Ds(f, z) denotes the effects of diffraction that are related to the transducer geometry. As(f, z0) is the cumulative attenuation along the propagation path from the surface of the transducer to the depth z0 which corresponds to the start of the ROI. αs(f) is the attenuation coefficient within the ROI. Bs(f, z) is a result of the scattering properties of the tissue within the gated window, namely the effective scatter size, the scatterer number density, and the mean square variation in acoustic impedance between the scatterers and the background. Similarly, the power spectrum of the backscattered signal from the reference phantom is
| (2) |
The subscript r represents the reference phantom. If the average sound speed in TMP and in the tissue sample is assumed equal, the diffraction terms Ds(f, z) and Dr(f, z) are the same, i.e.,
| (3) |
The spectral difference method makes a prior assumption that the tissue within the ROI is homogeneous and isotropic, i.e., the scattering term B(f, z) does not vary with depth within the ROI, therefore
| (4) |
Dividing the power spectra of the sample by the power spectra of the reference phantom yields
| (5) |
where
| (6) |
Computing the natural logarithm yields
| (7) |
The attenuation coefficient of the sample (Np∕cm) can be estimated at each frequency component by calculating γ, the slope of the straight line that fits the log ratio of the two spectra, i.e., the slope of the straight line that fits Eq. 7 versus depth. The estimated attenuation coefficient can be written as
| (8) |
If the attenuation is assumed to increase linearly with frequency, then the attenuation coefficient slope (Np∕cm-MHz) is used as a measure for the attenuation in the tissue of interest. The attenuation coefficient can be written as
| (9) |
where the single parameter β is the attenuation coefficient slope (Np∕cm-MHz). β can be estimated by finding the slope of the straight line that fits Eq. 9, or by dividing the attenuation coefficient αs(f) by the frequency at each Fourier component and computing the average. Dividing by f and computing the average was the approach taken in our study.
The spectral log difference method
Unlike the spectral difference method which uses all the time-gated windows within the ROI, the spectral log difference method uses the power spectra from only the proximal and the distal window of the ROI. As in Eq. 5, dividing the power spectrum of the proximal window of the sample by the power spectrum of the proximal window of the TMP and computing the natural logarithm yields
| (10) |
The subscript p stands for proximal. zp is the distance from the surface of the transducer to center of the proximal window of the ROI. Similarly, dividing the power spectrum of the distal window of the sample by the power spectrum of the distal window of the TMP and computing the natural logarithm yields
| (11) |
The subscript d stands for distal. zd is the distance from the surface of the transducer to center of the distal window of the ROI. Computing the difference between the spectra from Eqs. 10, 11 yields
| (12) |
The TMP is homogeneous and isotropic, hence Br(f, zp) = Br(f, zd). If the material within the proximal window has the same effective scatterer size as the material within distal window of the sample, we can write
| (13) |
where cs is a multiplicative constant. Equation 13 is valid even if the material within the proximal window of the sample and the material within the distal window of the sample have different scatterer number densities and or different mean square variation in acoustic impedance between the scatterers and the background. Equation 12 becomes
| (14) |
where const is a constant. The common parameterization of the attenuation coefficient is given by (Leeman et al., 1984)
| (15) |
Equation 14 becomes
| (16) |
The unknowns β, n, and const can be estimated by fitting a power function versus frequency to Eq. 16. If the attenuation is assumed to increase linearly with frequency as in Eq. 9, the attenuation coefficient slope can be estimated by fitting a straight line frequency to Eq. 16 which is the approach taken in this study.
The hybrid method
As in the spectral difference method, the hybrid method uses all of the time-gated widows within the ROI. The hybrid method, as originally derived, makes a prior assumption that the local attenuation within the ROI and the cumulative attenuation from the surface of the transducer to the depth that corresponds to the beginning of the ROI increase linearly with frequency. Equations 1, 2 become
| (17) |
| (18) |
where βs−tot and βr−tot are the cumulative attenuation coefficient slopes of the sample and the reference, respectively. βs and βr are the local attenuation coefficient slopes within the ROIs of the sample and the reference, respectively. Dividing the power spectrum of the sample by the power spectrum of the reference yields
| (19) |
where
| (20) |
The scattering term B(f, z) is modeled as a power function of frequency and is expressed as an exponential form of the first two terms of the Taylor series expansion (Treece et al., 2005; Kim and Varghese, 2008)
| (21) |
where c is a constant and fc is the center frequency of the transmit pulse. Equation 19 becomes
| (22) |
The subscripts s and r represent the sample and the reference, respectively. A Gaussian filter G(f) with a center frequency fc and a variance σ2 is then applied to RS(f, z). The Gaussian filtered intensity ratio is given by
| (23) |
In the original implementation of the hybrid method, fc was selected to be the center frequency of the transmit pulse, and σ2 was given by the bandwidth of the transmit pulse. However, we found a slight improvement in the accuracy of the algorithm when fc was selected such that the frequency corresponding to the spectral peak of GRS(f, z) was in the middle of the usable frequency band. We also used the bandwidth of the received echoes from the unknown sample to set σ2 as this only required processing the backscattered echo data. After manipulating Eq. 23, the center frequency of GRS(f) at the depth z is given by
| (24) |
The approximation was made because the transmit center frequency is generally greater than the square root of the variance, and the parameter ns for human tissue is approximately equal to the parameter nr for the reference phantom. The attenuation coefficient slope of the sample is estimated by calculating the slope γ of the straight line that fits Eq. 24 versus depth. The estimated attenuation coefficient slope is given by
| (25) |
PROCEDURE
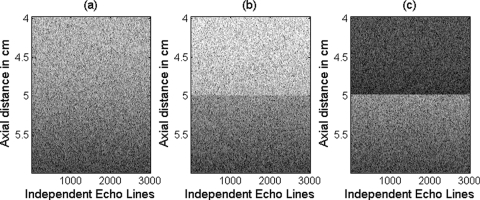
Computer simulations were used to obtain four different data sets of RF backscattered signals using a Gaussian focused beam (5 cm focal length, 10 MHz center frequency, 0.385 mm spatial pulse length, and a 50% −3 dB bandwidth). The first data set is obtained from a homogeneous region that has randomly distributed 10 μm radius spherical shell scatterers (i.e., glass beads) and a scattering number density of 100 mm−3. This data set was used to obtain the reference power spectrum. The second data set is obtained from a homogeneous region which has randomly distributed 20 μm effective radius scatterers that have a Gaussian form factor and a scattering density of 100 mm−3. The third data set is obtained from an in-homogeneous region which has randomly distributed 20 μm effective radius scatterers that have a Gaussian form factor and a 100 mm−3 scattering number density after the focal plane and a 200 mm−3 scattering number density before the focal plane axially (i.e., two distinct regions separated by the focal plane). These values of number density were selected to correspond to a 3 dB change in the backscatter within the ROI. The fourth data set is obtained from an in-homogeneous sample which has a scattering number density of 100 mm−3 and randomly distributed scatterers that have a Gaussian form factor with a 20 μm effective radius after the focal plane and a 10 μm effective radius before the focal plane axially (i.e., two distinct regions separated by the focal plane). These values were selected to correspond to a doubling of the scatterer size within the ROI. For the data sets, 3000 independent scatterer distributions resulting in 3000 independent echo lines were generated for each of the sample data sets and 100 independent scatterer distributions resulting in 100 independent echo lines were generated for the reference data set. The equivalent of a B-mode image is shown in Fig. 1 to illustrate each of the simulated data sets. The y-axis in these images corresponds to depth in centimeters while x-axis corresponds to the different independent echo lines. Each echo line was generated from its own distribution of scatterers so there is no correlation between the columns in the images.
Figure 1.
The equivalent of a B-mode image for the three different sample data sets corresponding to (a) a homogenous ROI, (b) an ROI with varying number density, and (c) an ROI with varying effective scatterer size. The x-axis corresponds to independent echo lines with each line corresponding to its own randomly generated arrangement of scatterers.
The attenuation coefficients of the sample and the reference are 0.7 dB cm−1 MHz−1 and 0.5 dB cm−1 MHz−1, respectively. The form factor is proportional to the Fourier transform of the spatial correlation coefficient of the scattering medium (Insana et al., 1990). A correlation coefficient bγ(Δr) that has a Gaussian form yields a Gaussian form factor F(2k) such that
| (26) |
where d is the characteristic dimension, Δr is the distance between two point in space, k is the wave number, and aeff is the effective scatterer size. For our simulations, the Gaussian correlation coefficient was generated by giving each scatterer a Gaussian impedance distribution with the set to one where (Insana et al., 1990)
| (27) |
In this equation, is the compressibility of the scatterer, κ is the compressibility of the background, is the density of the scatterer, ρ is the density of the background, and corresponds to the local spatial coordinates of the scatterer. The maximum value of γ will not impact the results of our study.
In the simulations, the focal plane is used as the center of the ROI. Each echo line within the ROI is gated using rectangular windows with 50% overlapping, each window containing seven pulse lengths. The spatial pulse length is the length of space over which a pulse occurs. We chose seven pulse lengths in each time-gated window because the full width at half-maximum (FWHM) bandwidth of the backscatter power spectrum doesn’t change significantly for windows that contain more than seven pulse lengths. The power spectrum of each time-gated window is approximated by taking the Fourier transform of the RF data and squaring the magnitude of the result. The power spectra of the rectangular windows that correspond to the same depth are averaged. In order to operate above the noise floor, the usable frequency range was selected to be the frequencies common to the −20 dB bandwidths of the sample and the reference spectra. The noise floor is the magnitude of the power spectrum that is nearly constant over the frequencies that are outside the usable bandwidth of the transducer. In the simulations, the noise floor was always less than −20 dB.
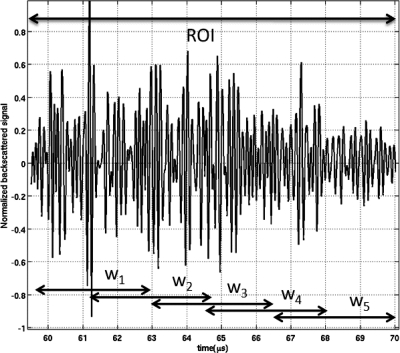
To find how the error in the attenuation coefficient slope estimates (ACE) changes with respect to the ROI length axially for the three sample cases that were simulated, we varied the length of the ROI from two to nine overlapping rectangular windows (10.5 to 35 pulse lengths). Figure 2 shows an example of a backscattered RF signal from a ROI. This example signal is gated by five overlapping windows (50% overlapping) denoted by w1, w2, w3, w4, and w5. As was described previously, each window, w5 through w5, was seven pulse lengths long. Likewise, to find how the errors in the ACE changed with ROI width laterally for the three sample cases, we varied the number of independent echoes per ROI from 5 to 100 with increments of four echo lines. We obtained 30 estimates for each combination using the three techniques (30 × 100 independent echoes gives the 3000 independent echoes generated in the simulations). We varied the length of the ROI in terms of the number of pulse lengths instead of the number wavelengths because it was shown than the optimal ROI length depends on the number of pulse lengths per ROI and not on the center frequency of the transducer (Bigelow, 2010).
Figure 2.
Example of a backscattered RF signal from a ROI. This signal is gated by five overlapping windows (50% overlapping) denoted by w1, w2, w3, w4, and w5.
RESULTS
Homogeneous ROI
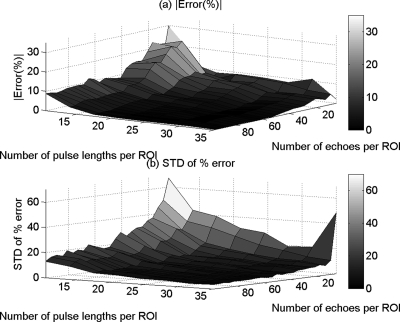
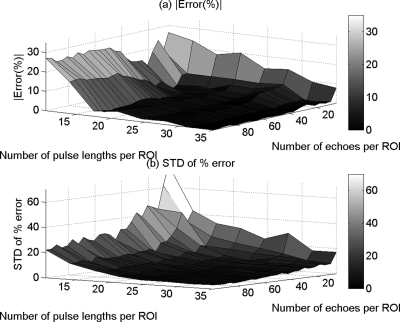
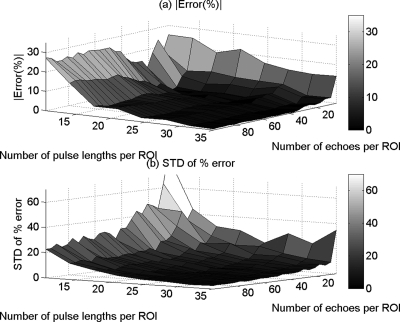
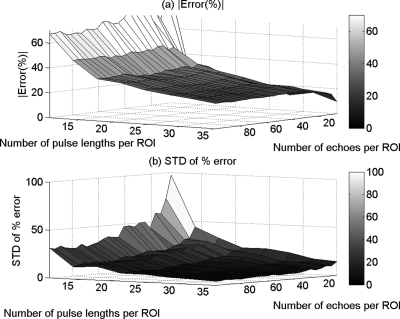
Figures 3a, 4a, and 5a show the mean in the percent error of the ACEs that were obtained using the spectral difference method, the spectral log difference method, and the hybrid method, respectively, versus the number of pulse lengths and the number of echoes per ROI. Figures 3b, 4b, and 5b show the standard deviation of the percent error in the ACEs that were obtained using the spectral difference method, the spectral log difference method, and the hybrid method, respectively, versus the number of pulse lengths and the number of echoes per ROI. Based on these plots, we observed that the mean and the standard deviation of the percent error decrease with increasing ROI length axially and increasing number of echoes laterally for all the attenuation measurement techniques. The accuracy and the precision are better for smaller ROI sizes in the case of the spectral difference method compared with the spectral log difference and the hybrid methods.
Figure 3.
The mean (a) and (b) the standard deviation (SD) in the percent error of the attenuation coefficient estimates that were obtained using the spectral difference method from the homogeneous sample versus the number of pulse lengths and the number of echoes per ROI.
Figure 4.
The mean (a) and (b) the standard deviation (SD) in the percent error of the attenuation coefficient estimates that were obtained using the spectral log difference method from the homogeneous sample versus the number of pulse lengths and the number of echoes per ROI.
Figure 5.
The mean (a) and (b) the standard deviation (SD) in the percent error of the attenuation coefficient estimates that were obtained using the hybrid method from the homogeneous sample versus the number of pulse lengths and the number of echoes per ROI.
In-homogeneous ROI with varying scatterer number density
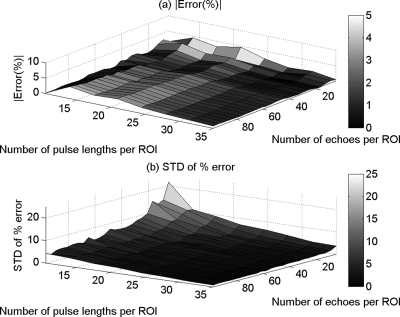
Figures 6a, 7a show the mean in the percent error of the ACEs that were obtained using the spectral log difference method and the hybrid method, respectively, versus the number of pulse lengths and the number of echoes per ROI. Figures 6b, 7b show the standard deviation of the percent error in the ACEs that were obtained using the spectral log difference method and the hybrid method, respectively, versus the number of pulse lengths and the number of echoes per ROI. The spectral difference method gave errors larger than a 100%, a result that was expected based on the assumptions that were taken when the algorithm was derived. Specifically, in the spectral difference method, any changes in the scattering term B(f, z) with depth are interpreted as attenuation by the algorithm. For this reason, the mean and the standard deviation of the percent error in the ACEs was not plotted for the spectral difference method. Based on Figs. 67, we observed that the spectral log difference method and the hybrid method have comparable accuracy and precision. In both methods, the accuracy and the precision increase with increasing ROI length and increasing ROI width (number of independent echoes per ROI).
Figure 6.
The mean (a) and (b) the standard deviation (SD) in the percent error of the attenuation coefficient estimates that were obtained using the spectral log difference method from the in-homogeneous sample that has the same effective scatterer size but different scatterer number densities versus the number of pulse lengths and the number of echoes per ROI.
Figure 7.
The mean (a) and (b) the standard deviation (SD) in the percent error of the attenuation coefficient estimates that were obtained using the hybrid method from the in-homogeneous sample that has the same effective scatterer size but different scatterer number densities versus the number of pulse lengths and the number of echoes per ROI.
In-homogeneous ROI with varying scatterer size
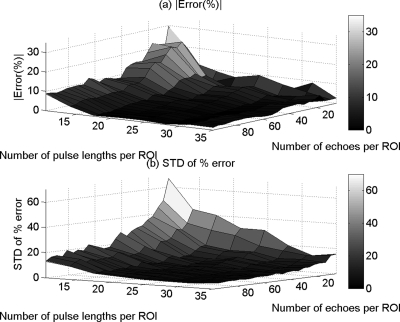
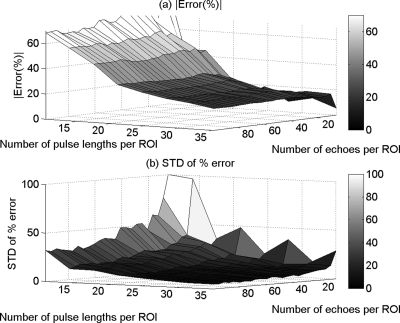
Figures 8a, 9a show the mean in the percent error of the ACEs that were obtained using the spectral log difference method and the hybrid method, respectively, versus the number of pulse lengths and the number of echoes per ROI. Figures 8b, 9b show the standard deviation of the percent error in the ACEs that were obtained using the spectral log difference method and the hybrid method, respectively, versus the number of pulse lengths and the number of echoes per ROI. The spectral difference method once again gave errors larger than a 100% as was expected based on the assumptions that were taken when the algorithm was derived. For this reason, the mean and the standard deviation of the percent error in the ACEs once again were not plotted for the spectral difference method. Based on Figs. 89, we observed that the spectral log difference method and the hybrid method did not completely fail in estimating the attenuation; however, the accuracy and the precision are poor. The accuracy is within 25% for large ROI sizes in both methods. The precision in the ACEs increases with increasing number of echoes and increasing ROI length.
Figure 8.
The mean (a) and (b) the standard deviation (SD) in the percent error of the attenuation coefficient estimates that were obtained using the spectral log difference method from the in-homogeneous sample that has the same scatterer number density but different effective scatterer size versus the number of pulse lengths and the number of echoes per ROI.
Figure 9.
The mean (a) and (b) the standard deviation (SD) in the percent error of the attenuation coefficient estimates that were obtained using the hybrid method from the in-homogeneous sample that has the same scatterer number density but different effective scatterer size versus the number of pulse lengths and the number of echoes per ROI.
DISCUSSION AND CONCLUSION
Based on the above results, the spectral difference method gave accurate attenuation coefficient estimates when the tissue was homogeneous; however it failed completely when the scatterer number densities and or the effective scatterer radii are different within the ROI. These results were expected from the derivation of the algorithm. The spectral log difference method and the hybrid method gave accurate attenuation estimates when the ROI was homogeneous, and when the ROI had the same scatterer size but different scatter number densities, with both methods having a comparable accuracy and precision. However, because there was no correction for variation in the scatterer size during the derivation of the two algorithms, it was surprising that these two methods gave only a 25% error when the ROI had the same scatterer number densities but different effective scatterer size. In order to quantify how the error in the ACEs depends on the variations in the scatterer size within the ROI, we modeled the backscatter coefficient B(f, z) with a Gaussian scattering model (Insana et al., 1990) and re-derived the spectral log difference method and the hybrid method. The term Bs(f, z) in Eqs. 12, 17 can be written as
| (28) |
where M(z) is a function of the scatterer number density and mean square variation in acoustic impedance, aeff is the effective scatter radius, and c is the average sound speed.
In the spectral log difference method, Eq. 12 becomes
| (29) |
where Δβ = (βr − βs), Δz = (zp − zd), and , the subscripts s and r denote the sample and the reference, respectively, p and d stand for proximal and distal, respectively. Taking the derivative of S(f) with respect to frequency, we obtain:
| (30) |
If we approximate the frequency f by the middle frequency of the usable frequency range fmid, we find that the estimated attenuation coefficient slope of the sample is given by
| (31) |
Equation 31 shows that the error in the attenuation coefficient slope of the sample increases with increasing scatterer size difference between the proximal and distal windows of the ROI and decreases with increasing range between the proximal and distal windows of the ROI.
Similarly, in the hybrid method, Eq. 23 becomes
| (32) |
After manipulating Eq. 32, it was shown that center frequency of GRS(f) at the depth z can be expressed as (Bigelow, 2010):
| (33) |
where
| (34) |
In the hybrid method, Δβ is estimated by dividing the slope the straight line that fits Eq. 33 with respect to depth. However, if we take the derivative of with respect to depth, we obtain
| (35) |
If we approximate, by , we find that the estimated attenuation coefficient slope of the sample is given by
| (36) |
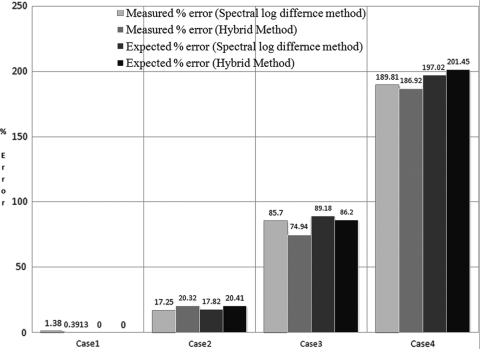
Equations 36, 31 show that the error in the attenuation coefficient slope of the sample is very similar between the hybrid method and the spectral log difference method. To test the expressions given by Eqs. 31, 36 for the difference in scatterer size, two additional cases were simulated and compared to our previous results. Figure 10 shows the expected percent error and the measured percent error in the attenuation coefficient slope of the sample using the hybrid method and the modified spectral log difference method for the four cases using an ROI length of 35 pulse lengths and 100 independent echoes. In Fig. 10, the first two cases correspond to our previous results were for a homogeneous sample with 20 μm effective radius scatterers that have a Gaussian form factor (case 1 in Fig. 10) and for an in-homogeneous sample which had scatterers that have a Gaussian form factor and 20 μm effective radii after the focal plane and 10 μm effective radii before the focal plane axially (case 2 in Fig. 10). The first new case (case 3 in Fig. 10) was an in-homogeneous sample which had scatterers that have Gaussian form factor and 40 μm effective radii after the focal plane and 10 μm effective radii before the focal plane axially. The fourth case (case 4 in Fig. 10) was an in-homogeneous sample which had scatterers that have a Gaussian form factor and 60 μm effective radii after the focal plane and 10 μm effective radii before the focal plane axially. These cases were selected to sweep through a range of scattering properties to validate our derived equations. We observe the percent error in the attenuation estimate increases with increasing difference of scatterer size between the top half and bottom half of the ROI in agreement with Eqs. 36, 31. Also, the expected error and measured error are comparable in both the hybrid and the modified spectral log difference method confirming our derived error terms.
Figure 10.
(Color online) The expected percent error and the measured percent error in the attenuation coefficient slope of the sample using the hybrid method and the modified spectral log difference method for the four simulated cases.
ACKNOWLEDGMENTS
This project was supported by Grant # R01 CA111289 from the National Institutes of Health, a subcontract with the University of Illinois-Chicago made possible by Grant # R21HD058705-01A2 from the National Institutes of Health, and Iowa State University. The content is solely the responsibility of the authors and does not necessarily represent the official views of the National Institutes of Health.
References
- Bigelow, T. (2010). “Estimating the total ultrasound attenuation along the propagation path by applying multiple filters to backscattered echoes from a single spherically focused source,” IEEE Trans. Ultrason. Ferroelectr. Freq. Control 57(4), 900–907. 10.1109/TUFFC.2010.1494 [DOI] [PMC free article] [PubMed] [Google Scholar]
- Bigelow, T. A., McFarlin, B. L., O’Brien, W. D., Jr., and Oelze, M. L. (2008). “In vivo ultrasonic attenuation slope estimates for detecting cervical ripening in rats: Preliminary results,” J. Acoust. Soc. Am. 123(3), 1794–1800. 10.1121/1.2832317 [DOI] [PMC free article] [PubMed] [Google Scholar]
- Bigelow, T. A., and O’Brien, W. D., Jr. (2004). “Scatterer size estimation in pulse-echo ultrasound using focused sources: Calibration measurements and phantom experiments,” J. Acoust. Soc. Am. 116(1), 594–602. 10.1121/1.1757453 [DOI] [PubMed] [Google Scholar]
- Bigelow, T. A., and O’Brien, W. D., Jr. (2006). “Impact of local attenuation approximations when estimating correlation length from backscattered ultrasound echoes,” J. Acoust. Soc. Am. 120(1), 546–553. 10.1121/1.2208456 [DOI] [PubMed] [Google Scholar]
- Flax, S. W., Pelc, N. J., Glover, G. H., Gutmann, F. D., and McLachlan, M. (1983). “Spectral characterization and attenuation measurements in ultrasound,” Ultrason. Imaging 5(2), 95–116. 10.1016/0161-7346(83)90013-5 [DOI] [PubMed] [Google Scholar]
- Hall, T. J., Insana, M. F., Harrison, L. A., and Cox, G. G. (1996). “Ultrasonic measurement of glomerular diameters in normal adult humans,” Ultrasound Med. Biol. 22(8), 987–997. 10.1016/S0301-5629(96)00142-1 [DOI] [PubMed] [Google Scholar]
- Hyungsuk, K., and Varghese, T. (2007). “Attenuation estimation using spectral cross-correlation,” IEEE Trans. Ultrason. Ferroelectr. Freq. Control 54(3), 510–519. 10.1109/TUFFC.2007.274 [DOI] [PubMed] [Google Scholar]
- Insana, M., Zagzebski, J., and Madsen, E. (1983). “Improvements in the spectral difference method for measuring ultrasonic attenuation,” Ultrason. Imaging 5(4), 331–345. [DOI] [PubMed] [Google Scholar]
- Insana, M. F., Wagner, R. F., Brown, D. G., and Hall, T. J. (1990). “Describing small-scale structure in random media using pulse-echo ultrasound,” J. Acoust. Soc. Am. 87(1), 179–192. 10.1121/1.399283 [DOI] [PMC free article] [PubMed] [Google Scholar]
- Kim, H., and Varghese, T. (2008). “Hybrid spectral domain method for attenuation slope estimation,” Ultrasound Med. Biol. 34(11), 1808–1819. 10.1016/j.ultrasmedbio.2008.04.011 [DOI] [PubMed] [Google Scholar]
- Kuc, R. (1980). “Clinical application of an ultrasound attenuation coefficient estimation technique for liver pathology characterization,” IEEE Trans. Biomed. Eng. BME-27(6), 312–319. 10.1109/TBME.1980.326739 [DOI] [PubMed] [Google Scholar]
- Kuc, R. (1984). “Estimating acoustic attenuation from reflected ultrasound signals: Comparison of spectral-shift and spectral-difference approaches,” IEEE Trans. Acoust., Speech, Signal Process. 32(1), 1–6. 10.1109/TASSP.1984.1164282 [DOI] [Google Scholar]
- Kuc, R., and Schwartz, M. (1979). “Estimating the acoustic attenuation coefficient slope for liver from reflected ultrasound signals,” IEEE Trans. Sonics Ultrason. 26(5), 353–361. [Google Scholar]
- Landini, L., and Sarnelli, R. (1986). “Evaluation of the attenuation coefficients in normal and pathological breast tissue,” Med. Biol. Eng. Comput. 24(3), 243–247. 10.1007/BF02441619 [DOI] [PubMed] [Google Scholar]
- Landini, L., Sarnelli, R., and Squartini, F. (1985). “Frequency-dependent attenuation in breast tissue characterization,” Ultrasound Med. Biol. 11(4), 599–603. 10.1016/0301-5629(85)90031-6 [DOI] [PubMed] [Google Scholar]
- Leeman, S., Ferrari, L., Jones, J. P., and Fink, M. (1984). “Perspectives on attenuation estimation from pulse-echo signals,” IEEE Trans. Sonics Ultrason. 31(4), 352–361. [Google Scholar]
- McFarlin, B. L., O’Brien, W. D., Jr, Oelze M. L., Zachary, J. F., and White-Traut, R. C. (2006). “Quantitative ultrasound assessment of the rat cervix,” J. Ultrasound Med. 25(8), 1031–1040. [DOI] [PMC free article] [PubMed] [Google Scholar]
- Narayana, P. A., and Ophir, J. (1984). “The measurement of attenuation in nonlinearly attenuating media by the zero crossing method,” Ultrasound Med. Biol. 10(6), 715–718. 10.1016/0301-5629(84)90231-X [DOI] [PubMed] [Google Scholar]
- Oelze, M. L., Zachary, J. F., and O’Brien, W. D., Jr. (2002). “Characterization of tissue microstructure using ultrasonic backscatter: Theory and technique for optimization using a Gaussian form factor,” J. Acoust. Soc. Am. 112(3), 1202–1211. 10.1121/1.1501278 [DOI] [PubMed] [Google Scholar]
- Parker, K. J., Lerner, R. M., and Waag, R. C. (1988). “Comparison of techniques for in vivo attenuation measurements,” IEEE Trans. Biomed. Eng. 35(12), 1064–1068. 10.1109/10.8691 [DOI] [PubMed] [Google Scholar]
- Parker, K. J., and Waag, R. C. (1983). “Measurement of ultrasonic attenuation within regions selected from B-scan images,” IEEE Trans. Biomed. Eng. BME-30(8), 431–437. 10.1109/TBME.1983.325148 [DOI] [PubMed] [Google Scholar]
- Treece, G., Prager, R., and Gee, A. (2005). “Ultrasound attenuation measurement in the presence of scatterer variation for reduction of shadowing and enhancement,” IEEE Trans. Ultrason. Ferroelectr. Freq. Control 52(12), 2346–2360. 10.1109/TUFFC.2005.1563279 [DOI] [PubMed] [Google Scholar]
- Yao, L. X., Zagzebski, J. A., and Madsen, E. L. (1990). “Backscatter coefficient measurements using a reference phantom to extract depth-dependent instrumentation factors,” Ultrason. Imaging 12(1), 58–70. 10.1016/0161-7346(90)90221-I [DOI] [PubMed] [Google Scholar]


