

Abstract
Objective:
To assess the potential relationship of ultraviolet B radiation (UVB) and Epstein-Barr virus (EBV) exposure in explaining the period prevalence of multiple sclerosis (MS) in England.
Methods:
English national Hospital Episode Statistics covering all admissions to National Health Service hospitals in England in the 7 years from 1998 to 2005 were used to obtain the period prevalences of MS and infectious mononucleosis (IM) in England. The United States National Aeronautics and Space Administration's data on UVB intensity for England from the Nimbus 7 satellite was collected. The relationships among the 3 variables (MS prevalence, IM prevalence, and UVB intensity) were investigated.
Results:
The regression of MS against UVB intensity for all seasons had an r2 of 0.61; when including the interaction of IM with seasonal UVB, the r2 rose to 0.72.
Conclusions:
UVB exposure and IM together can explain a substantial proportion of the variance of MS. The effect of UVB on generating vitamin D seems the most likely candidate for explaining its relationship with MS. There is a pressing need to investigate the role of vitamin D and EBV and how they might interact to influence MS risk to identify potential prevention strategies.
Multiple sclerosis (MS) is the most common disease of the CNS in young adults of Northern European descent.1 MS seems unlikely to result from a single causative event; instead, the disease seems to develop in genetically susceptible populations as a result of environmental exposures.2
The most striking illustration of the importance of the environment in MS is its geographical distribution.3 Within regions of temperate climate, MS incidence and prevalence are thought to increase with latitude.3,4 The latitudinal trend starts around 42 degrees of latitude North.5 A cutoff at this latitude implicates solar wavelengths in the shorter UV range (ultraviolet B [UVB]) as UVB is strongly affected by the solar zenith angle.6 There is also a month of birth effect for MS,7 which is also indicative of solar-correlated processes, and this effect is itself strongly latitude-dependent.
We have recently reported period prevalence values for MS across England.8 Epstein-Barr virus (EBV) is a B-lymphotropic human DNA herpesvirus that infects most individuals asymptomatically but in some people causes infectious mononucleosis (IM) upon infection.9 Because the risk of MS is increased in individuals with a clinical history of IM,10–12 we also compared the geography of MS with the distribution of IM, and observed a strong correlation, but this was not enough to fully account for the variance of MS. Recent studies have documented the inverse relationship between MS prevalence and UV exposure.13 In the present study, we assess how the prevalence of MS and IM relates to UVB exposure.
METHODS
Standard protocol approvals, registrations, and patient consents.
The English NHS Central Office for Research Ethics approved this study.
MS and IM prevalence data.
As published, we analyzed data on hospital admissions for MS from linked hospital admission statistics, assembled from the English national Hospital Episode Statistics (HES) system.8 This covered all admissions to National Health Service (NHS) hospitals in England in the 7 years from April 1, 1998, to March 31, 2005 (population: 51 million). We identified cases of MS as code G35 in the 10th revision of the International Classification of Diseases (ICD). The English national linked HES database includes information about all people who are admitted to hospital (including day care as well as overnight stays). Using data linkage, we identified each person only once for MS, regardless of how many admissions each person had, and recorded their residence out of 28 English Strategic Health Authorities (SHAs) at first known admission for MS. Admission rates were calculated using numbers of admissions for residents of each area as the numerators and the total resident populations of the area as the denominators. To adjust for differences in the age structure of different areas, age standardization was undertaken using the indirect method and the age-specific rates in 5-year age groups in the English population as the standard. We undertook the same calculations for hospital admissions for people with IM, varicella infection, and cytomegalovirus infections using the ICD codes B27, B01, and B25 to identify them.
UV.
We used the US National Aeronautics and Space Administration's (NASA's) data for the single wavelength of 305 nm at noon (J.R. Herman, 2003, NASA Goddard Centre, Greenbelt, MD). This single wavelength data slightly overestimates the amount of UVB at its prime physiologically active wavelengths which are 290–295 nm. The data also tend to overestimate ground availability of UVB by approximately 15% in areas where there is dense optical pollution from particulates and aerosols formed from oxides of sulfur and nitrogen. The data model has allowances for natural clouds but the sensor will read the reflection from the top of polluted cloud formations, thereby overestimating ground values.14 The magnitude of this error is not expected to be large for the United Kingdom because it is on the oceanic side of the prevailing wind and so does not carry much pollution. The error will be greater in urban areas. The NASA data for the single wavelength of 305 nm at noon collected on the Nimbus 7 satellite from 1978–1992 was sampled for 5 days centered on the 22nd of each month and averaged over the whole period. This data reduction was necessary due to the enormous size of the dataset comprising more than 60,000 readings a day for 14 years. This solar month sampling also has the advantage of catching the full range of the annual variation because it captures the solstices and overcomes the problem of differing numbers of days per calendar month. The data were further averaged into seasons and integrated for the area of each of the 28 SHAs using ArcGIS (ESRI, 2009, Redlands, CA, 9.3.1 ArcInfo). See figure 1 for a map of spring season UVB 305 nm for the SHAs of England.
Figure 1. Map of ultraviolet B radiation 305 nm spring from total ozone mapping spectrometer averaged for each of 28 English Strategic Health Authorities.

Analysis.
The data were subjected to exploratory data analysis, consisting of inspecting the correlation matrix and evaluation using principal component analysis. The final analysis was a least-squares regression analysis. To test for geographic dependencies the data were tested by looking at quantile–quantile plots of the residuals, and performing geographically weighted regression. The data were considered suitable for ordinary least squares regression, ArcGIS, and Geospatial Analyst (ESRI 2009) and S-Plus (Insightful Corp., S-PLUS 6.2 [2003], Insightful Corp., Seattle, WA).
RESULTS
Correlations between seasonal UVB and MS and IM.
The correlations between seasonal UVB intensity with latitude and both MS and IM prevalence are shown in table 1. As shown previously, MS was highly correlated with IM (0.69). As a control, we also examined the correlations of MS with cytomegalovirus prevalence (0.05), and MS with varicella prevalence (0.21), which were both nonsignificant. Annual average UVB was not correlated with IM (0.02) nor with cytomegalovirus (0.19), and was only moderately correlated with varicella (−0.41), whereas the annual average UVB is more weakly correlated with MS (−0.29). The correlation between MS and latitude was stronger than the correlation between IM and latitude (0.46 and 0.16, respectively). UVB in any season was more highly correlated with MS than with IM. Therefore, the seasonal pattern of UVB is more important in MS. The most highly correlated UVB seasons with MS distinguish between onset and prevalence were spring and autumn (−0.46 and −0.48, respectively).
Table 1.
Correlations between seasonal UVB with latitude, MS, and IM prevalence

Abbreviations: IM = infectious mononucleosis; MS = multiple sclerosis; UVB = ultraviolet B radiation.
Principal components analysis.
The first 2 components in the principal components analysis together accounted for 99.7% of the variance for MS (table 2). The interaction term for MS and IM together with spring UVB were the most important factors in determining MS variance. Next were the interaction terms for MS and IM together with summer and autumn UVB. Of more minor importance were the interaction terms for MS on its own with spring, summer, or autumn UVB as well as IM with spring UVB. The way MS and IM interact with UVB is more important to MS prevalence than just MS and UVB independently.
Table 2.
Principal component analysis for MS
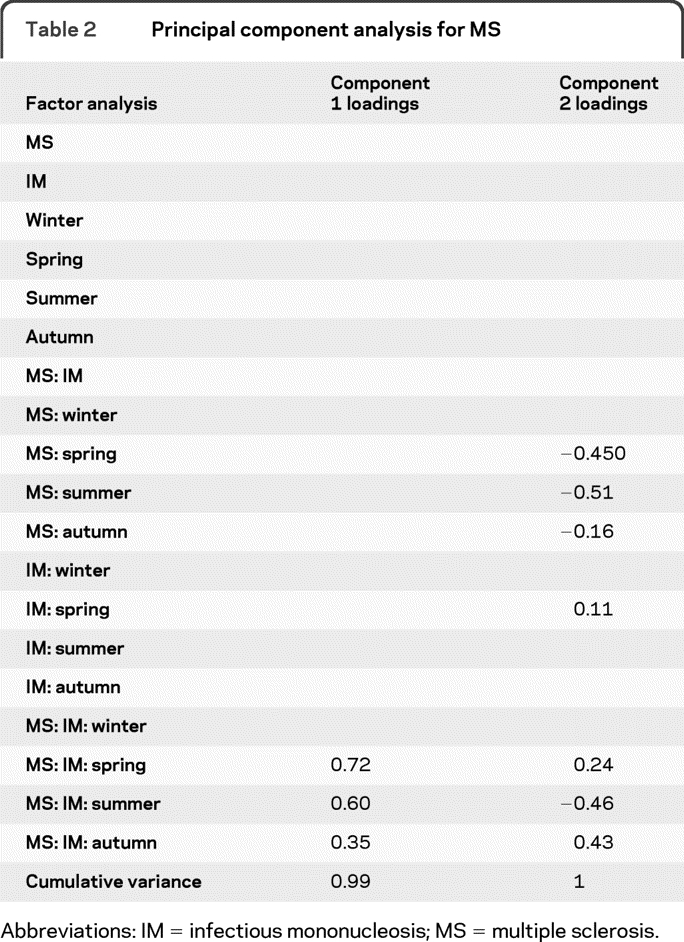
Abbreviations: IM = infectious mononucleosis; MS = multiple sclerosis.
Multivariate regression.
The regression of MS against a single season UVB had r2 values ranging between 0.03 (summer, p = 0.38) and 0.23 (spring, p = 0.009) (table 3). The regression of MS against UVB for all seasons had an r2 of 0.61 (p = 0.0001). When including the interaction of IM with seasonal UVB the r2 rose to 0.72 (p = 0.001). The regression line for the relationship of UVB to MS for all seasons is a very good fit to the data (figure 2A) and the residuals show little nonrandom structure (figure 2B). Most of the variance has therefore been explained by this model.
Table 3.
Regression resultsa
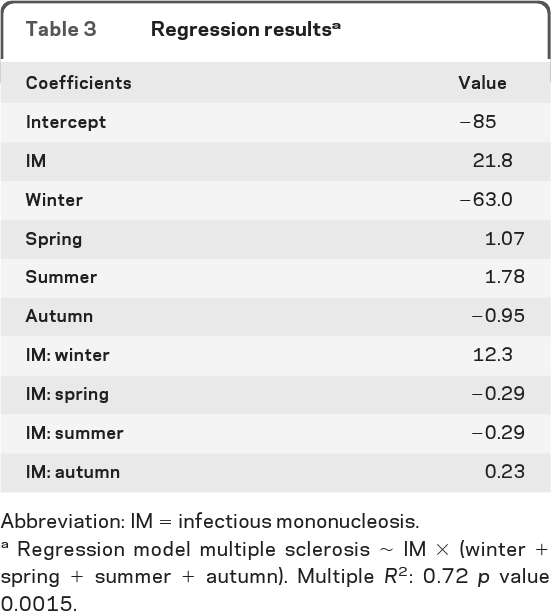
Abbreviation: IM = infectious mononucleosis.
Regression model multiple sclerosis ∼ IM × (winter + spring + summer + autumn). Multiple R2: 0.72 p value 0.0015.
Figure 2. Response of multiple sclerosis to the effect of infectious mononucleosis and ultraviolet B radiation (A) and residuals to the effect of infectious mononucleosis and ultraviolet B radiation against a QQ normal plot (B).

DISCUSSION
We show that the distribution of MS across England is explained both by UVB exposure and the prevalence of IM. In England, there is a definite latitudinal cline in MS occurrence but a weaker cline in IM, and as expected, IM prevalence could not entirely explain the variance of MS. Incorporating a linear model for MS with an interaction term for IM and UVB could explain 72% of the variance of MS prevalence across England. Interestingly, it is spring UVB that is most strongly associated. Lower levels of UVB in the spring season would coincide with late gestation for offspring born in late spring/early summer. This corresponds with the time for peak risk of MS by month of birth.7
There are several possible mechanisms through which UVB radiation could be mediating the effect on MS risk. The most attractive explanation is UVB-induced synthesis of cutaneous vitamin D, which is the principal source of this important sterol hormone.15,16 It has been suggested that low vitamin D levels may lead to an increase in EBV infection. The pleiotropic roles of vitamin D on the immune system17 may lead to an abnormal or variant response to EBV infection as manifested by IM when an individual is vitamin D deficient.18
There are limitations to our study. Limitations of record linkage studies using routinely collected administrative data are well-known, and include the facts that the data are limited to hospitalized patients and that information about some variables of potential interest, such as social circumstances and ethnicity, are generally unavailable. The pattern of MS or of UVB and MS is confounded in the large metropolitan areas of Merseyside and Manchester through to Leeds, together with Birmingham and London. Geographically weighted regression showed these regions to be 2 standard deviations below the main trend. These conurbations have larger populations of people with lower genetic susceptibility to MS.
The size of the correlations can be misleading although they are strong for UVB. In any case where there are putative gene–environment interactions, and where both elements are required, there will inevitably be the presence of one or other in the absence of the outcome being studied.
It is unclear as to how generalizable our data are to genetically dissimilar regions or to different insolation climates across the world. There are well-known exceptions to the latitude gradient, for example, Sardinia.3 The relationships shown represent associations and causative inferences must be tentative. In the case of IM in particular, the age dependency of the IM phenotype intersects with early life hygiene, social class, and other variables that may account for secondary associations, leaving the primary association speculative. However, when our data are taken in combination with others,13,19,20 it gives confidence that there is a pressing need to investigate the role of vitamin D and IM and their interaction in the pathogenesis of MS. At present there are no effective vaccines or treatments targeting EBV, but their development could complement vitamin D supplementation as potential interventions that might result in a reduction in the prevalence of this often devastating disease.21
Footnotes
- EBV
- Epstein-Barr virus
- HES
- Hospital Episode Statistics
- ICD
- International Classification of Diseases
- IM
- infectious mononucleosis
- MS
- multiple sclerosis
- NHS
- National Health Service
- NASA
- National Aeronautics and Space Administration
- SHA
- English Strategic Health Authorities
- UVB
- ultraviolet B radiation
AUTHOR CONTRIBUTIONS
Statistical analysis was conducted by Dr. Sreeram Ramagopalan.
DISCLOSURE
Dr. Ramagopalan receives research support from the Multiple Sclerosis Society of Canada Scientific Research Foundation and the Multiple Sclerosis Society of the United Kingdom. Dr. Handel reports no disclosures. Dr. Giovannoni serves on scientific advisory boards for Merck Serono and Biogen Idec and Vertex Pharmaceuticals; served on the editorial board of Multiple Sclerosis; has received speaker honoraria from Bayer Schering Pharma, Merck Serono, Biogen Idec, Pfizer Inc, Teva Pharmaceutical Industries Ltd.–sanofi-aventis, Vertex Pharmaceuticals, Genzyme Corporation, Ironwood, and Novartis; has served as a consultant for Bayer Schering Pharma, Biogen Idec, GlaxoSmithKline, Merck Serono, Protein Discovery Laboratories, Teva Pharmaceutical Industries Ltd.–sanofi-aventis, UCB, Vertex Pharmaceuticals, GW Pharma, Novartis, and FivePrime; serves on the speakers bureau for Merck Serono; and has received research support from Bayer Schering Pharma, Biogen Idec, Merck Serono, Novartis, UCB, Merz Pharmaceuticals, LLC, Teva Pharmaceutical Industries Ltd.–sanofi-aventis, GW Pharma, and Ironwood. Dr. Siegel reports no disclosures. Dr. Ebers serves on the editorial boards of the International Multiple Sclerosis Journal and Multiple Sclerosis and as Section Editor for BMC Medical Genetics; has received funding for travel or speaker honoraria from Bayer Schering Pharma, sanofi-aventis, Roche, and UCB; has served as a consultant to Biopartners, Bayer Schering Pharma, Howrey LLP, Heron Health, and Eli Lilly and Company; and receives research support from Bayer Schering Pharma, the Multiple Sclerosis Society of the United Kingdom, and the Multiple Sclerosis Society of Canada Scientific Research Foundation. G. Chaplin reports no disclosures.
REFERENCES
- 1. Noseworthy JH, Lucchinetti C, Rodriguez M, Weinshenker BG. Multiple sclerosis. N Engl J Med 2000;343:938–952 [DOI] [PubMed] [Google Scholar]
- 2. Ebers GC. Environmental factors and multiple sclerosis. Lancet Neurol 2008;7:268–277 [DOI] [PubMed] [Google Scholar]
- 3. Pugliatti M, Sotgiu S, Rosati G. The worldwide prevalence of multiple sclerosis. Clin Neurol Neurosurg 2002;104:182–191 [DOI] [PubMed] [Google Scholar]
- 4. Taylor BV, Pearson JF, Clarke G, et al. MS prevalence in New Zealand, an ethnically and latitudinally diverse country. Mult Scler 2010;16:1422–1431 [DOI] [PubMed] [Google Scholar]
- 5. Ascherio A, Munger KL. Environmental risk factors for multiple sclerosis: part II: noninfectious factors. Ann Neurol 2007;61:504–513 [DOI] [PubMed] [Google Scholar]
- 6. Johnson FS, Mo T, Green AES. Average latitudinal variation in ultraviolet radiation at the Earth's surface. Photochem Photobiol 1976;23:179–188 [DOI] [PubMed] [Google Scholar]
- 7. Willer CJ, Dyment DA, Sadovnick AD, Rothwell PM, Murray TJ, Ebers GC. Timing of birth and risk of multiple sclerosis: population based study. BMJ 2005;330:120. [DOI] [PMC free article] [PubMed] [Google Scholar]
- 8. Ramagopalan SV, Hoang U, Seagroatt V, et al. Geography of hospital admissions for multiple sclerosis in England and comparison with the geography of hospital admissions for infectious mononucleosis: a descriptive study. J Neurol Neurosurg Psychiatry Epub 2011 Jan 6 [DOI] [PMC free article] [PubMed] [Google Scholar]
- 9. Crawford DH. Biology and disease associations of Epstein-Barr virus. Philos Trans R Soc Lond B Biol Sci 2001;356:461–473 [DOI] [PMC free article] [PubMed] [Google Scholar]
- 10. Handel AE, Williamson AJ, Disanto G, Handunnetthi L, Giovannoni G, Ramagopalan SV. An updated meta-analysis of risk of multiple sclerosis following infectious mononucleosis. PLoS One 2010;5 [DOI] [PMC free article] [PubMed] [Google Scholar]
- 11. Goldacre MJ, Wotton CJ, Seagroatt V, Yeates D. Multiple sclerosis after infectious mononucleosis: record linkage study. J Epidemiol Community Health 2004;58:1032–1035 [DOI] [PMC free article] [PubMed] [Google Scholar]
- 12. Lindberg C, Andersen O, Vahlne A, Dalton M, Runmarker B. Epidemiological investigation of the association between infectious mononucleosis and multiple sclerosis. Neuroepidemiology 1991;10:62–65 [DOI] [PubMed] [Google Scholar]
- 13. Sloka JS, Pryse-Phillips WE, Stefanelli M. The relation of ultraviolet radiation and multiple sclerosis in Newfoundland. Can J Neurol Sci 2008;35:69–74 [DOI] [PubMed] [Google Scholar]
- 14. Xu M, Liang XZ, Gao W, Krotkov N. Comparison of TOMS retrievals and UVMRP measurements of surface spectral UV radiation in the United States. Atmos Chem Phys Discuss 2010;10:10969–11008 [Google Scholar]
- 15. Handel AE, Giovannoni G, Ebers GC, Ramagopalan SV. Environmental factors and their timing in adult-onset multiple sclerosis. Nat Rev Neurol 2010;6:156–166 [DOI] [PubMed] [Google Scholar]
- 16. Holick MF. Vitamin D deficiency. N Engl J Med 2007;357:266–281 [DOI] [PubMed] [Google Scholar]
- 17. Ramagopalan SV, Heger A, Berlanga AJ, et al. A ChIP-seq defined genome-wide map of vitamin D receptor binding: associations with disease and evolution. Genome Res 2010;20:1352–1360 [DOI] [PMC free article] [PubMed] [Google Scholar]
- 18. Grant WB. Latitude and multiple sclerosis prevalence: vitamin D reduces risk of Epstein-Barr virus infection. Mult Scler 2010;16:373; author reply 374–375 [DOI] [PubMed] [Google Scholar]
- 19. van der Mei IA, Ponsonby AL, Blizzard L, Dwyer T. Regional variation in multiple sclerosis prevalence in Australia and its association with ambient ultraviolet radiation. Neuroepidemiology 2001;20:168–174 [DOI] [PubMed] [Google Scholar]
- 20. Beretich BD, Beretich TM. Explaining multiple sclerosis prevalence by ultraviolet exposure: a geospatial analysis. Mult Scler 2009;15:891–898 [DOI] [PubMed] [Google Scholar]
- 21. Ascherio A, Munger KL, Simon KC. Vitamin D and multiple sclerosis. Lancet Neurol 2010;9:599–612 [DOI] [PubMed] [Google Scholar]