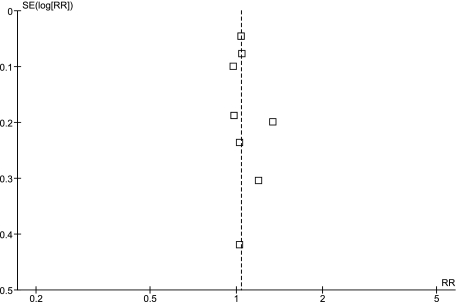
Figure 5.
Funnel plot for analysis of clinical success at test-of-cure for all included studies. The x axis demonstrates the effect estimate (RR) and the y axis demonstrates the log of the SE. The vertical line demonstrates the pooled effect size and the open squares represent effect estimates for each study plotted against the study SE. RR = relative risk.

