Abstract
Studying renal microcirculation and its dynamics is of great importance for understanding the renal function and further aiding the diagnosis, prevention and treatment of renal pathologies. In this paper, we present a potentially useful method to provide high-sensitive volumetric imaging of renal microcirculations using ultrahigh-sensitive optical microangiography (UHS-OMAG). The UHS-OMAG image system used here is based on spectral domain optical coherence tomography, which uses a broadband light source centered at 1300 nm with an imaging speed of 150 frames per second that requires ~6.7 sec to complete one 3D scan of ~2.5 × 2.5 mm2 area. The technique is sensitive enough to image capillary networks, such as peritubular capillaries within renal cortex. We show the ability of UHS-OMAG to provide depth-resolved volumetric images of capillary level renal microcirculation. We also show that UHS-OMAG is capable of monitoring the changes of renal microcirculation in response to renal ischemia and reperfusion. Finally, we attempt to show the capability of OMAG to provide quantitative analysis about velocity changes in a single capillary vessel (down to tens of microns per second) in response to the ischemic event.
OCIS codes: (170.4500) Optical coherence tomography, (170.3880) Medical and biological imaging
1. Introduction
Many factors have been identified that play an important role in the progression of chronic kidney disease (CKD) [1] to end-stage renal failure. Among the factors, microvascular loss, being pathologically linked to the development of glomerular sclerosis and tubulointerstitial fibrosis [2,3], plays a critical role. Hence, detection of renal microcirculation abnormalities would help the early diagnosis of CKD before it progresses to renal failure. Up to now, various techniques were applied to image the renal circulation, which include magnetic resonance imaging (MRI) [4], computational tomography (CT) [5–7], ultrasound [8,9] and optical microscope modalities [10]. Among these methods, the resolution of MRI and CT is not high enough to resolve the microvasculature within renal cortex, whereas ultrasound requires the injection of microbubbles as contrast agents and suffers from low sensitivity to capillary vessels. Optical imaging methods were also adopted to detect the renal microcirculation. Fluorescent microangiography (FMA) [11] is a recently reported imaging modality for assessing the microvasculature in the animal models of CKD. However, the requirement for injection of necessary dyes with their possible side effects is often undesirable. Recently, Bezemer et al. [12] introduced near-infrared laser speckle imaging (LSI) to assess the renal cortical microvascular perfusion heterogeneities. Unfortunately, the resolution is far from resolving capillary vessel and it is incapable of giving depth-resolved information. Hence, a non-invasive, contrast agent free, high-resolution and high-sensitive imaging technique capable of visualizing detailed renal microvasculature, especially capillary networks within renal cortex would be a significant advance.
Optical coherence tomography (OCT) [13,14] is a non-invasive, contrast-agent-free, cross-sectional and high-resolution imaging modality that can provide images of tissue morphology as well as functional information in vivo and in real-time. Y. Chen et al. applied OCT to study the excised and living kidney for visualizing the morphology of the uriniferous tubules and the renal corpuscles [15–17]. However, to the best of our knowledge, till now no work has been reported on the imaging of renal microvasculature in vivo with OCT.
As a novel extension of OCT technology, optical microangiography (OMAG) is a new imaging modality capable of generating 3D images of dynamic blood perfusion distribution within microcirculatory tissue beds [18]. OMAG produces imaging contrast via endogenous light scattering from moving particles (e.g., flowing blood cells), thus, no exogenous contrast agents are necessary. The feasibility of OMAG for imaging cerebral blood flow in mice [18,19] and ocular blood flow in human [20] has been successfully demonstrated. Unfortunately, limited by the optical heterogeneous properties of renal tissue the minimal blood flow velocity that this reported OMAG system is capable of imaging was ~200μm/s. However, the flow velocity of capillaries within renal cortex is quite slow, ranging from tens of microns per second to hundreds of microns per second, which is beyond the capability of conventional OMAG method. In order to visualize the rich microvasculature within renal cortex, the sensitivity of OMAG to the blood flow must be improved. Recently, an ultrahigh sensitive OMAG (UHS-OMAG) method based on conventional OMAG method was successfully proposed to image the capillary level microvasculature within human skin [21], retina and choroid [22]. It was extended to the animal study as well, such as imaging of microvasculature within meninges and cortex [23] and sentinel lymph node [24] in mice.
In this paper, we propose the use of this newly developed UHS-OMAG technique to image the renal microvasculature of mice in vivo. We will first describe the system setup, and then introduce the scanning protocol and data processing algorithm, making UHS-OMAG with sufficient sensitivity to image the ultra-slow renal microcirculation. We show the potential capability of UHS-OMAG in providing 3-D depth-resolved renal microvascular perfusion map. To evaluate the efficiency of UHS-OMAG for studying the renal microcirculation dynamics, renal ischemic event is induced by occlusion of the renal artery. We demonstrate that the UHS-OMAG has the potential to monitor the progress of fast perfusion reduction in response to renal ischemia and reperfusion after the clamp of artery is released. Finally, quantitative analyses about the changes of the functional vessel density and the blood flow velocity in a single capillary during the progress of ischemia are given.
2. Materials and Methods
2.1 Animal preparation
Studies were performed using Healthy C57 BL/6 mice weighing around 20 to 30 g (3 month old). The experimental protocol was in compliance with the Federal guidelines for care and handling of small rodents. The animals were initially anesthetized by isoflurane (0.2 L/min O2, 0.8 L/min air). The mouse was then placed on a heating pad keeping the body temperature between 35.5 and 36.5 °C which was monitored by a rectal thermal probe throughout the experiment. Prior to surgically exposing the kidney, the mouse was immobilized and positioned onto an imaging platform to minimize the movements, which is essential for in vivo imaging. The animals were turned on their left side and a right subcostal flank incision was made to expose the right kidney. In order to further minimize the motion caused by mouse heart beating, the kidney was immobilized in a Lucite kidney cup (K. Effenberger, Pfaffingen, Germany). The right renal artery was then identified, around which a 10 cm length of 3–0 silk ligature was looped at its juncture with the abdominal aorta. Gentle tension on this loop was sufficient enough to occlude blood flow to the right kidney. This technique allows inducing ischemia and reperfusion to the kidney by applying tension on the silk loop or releasing it. Thereafter, the mouse was positioned under the scanning probe; adjustment can be done to make sure the whole scanning area was on kidney as monitored by real time OMAG/OCT structural images displayed on the computer screen. Following imaging experiments, while still anesthetized, the animal was euthanized using an overdose of isoflurane.
2.2 UHS-OMAG System setup
The experimental setup for UHS-OMAG imaging system is shown in Fig. 1 . Briefly, light centered at 1310 nm with a 56 nm bandwidth comes out from a low-coherence broadband infrared super luminescent diode light source and then split into two paths in a 10:90 fiber based Michelson interferometer. One beam with the ten percent power is coupled onto a stationary reference mirror and the second with ninety percent power was focused with a focal lens with a power incident of ~4 mW. The focal spot on the sample was scanned using a pair of galvo-mirrors mounted in the sample arm. The lights reflected from both arms met each other at the interferometer again and the interference signal emerging at the output of interferometer was sent to a custom-built high speed spectrometer. The axial resolution of the system was 13 μm in air (~9.6 μm in tissue), and by using an objective lens with a focal length of 30 mm to focus the probe beam onto the sample, the system provided a measured lateral resolution of ~9 μm and a depth of focus of ~200 um. The imaging speed of the system was 47,000 A scans per second, with which the measured signal to noise ratio (SNR) was ~105 dB at the focus spot of sampling beam, which was placed at ~500 μm below the zero delay line.
Fig. 1.
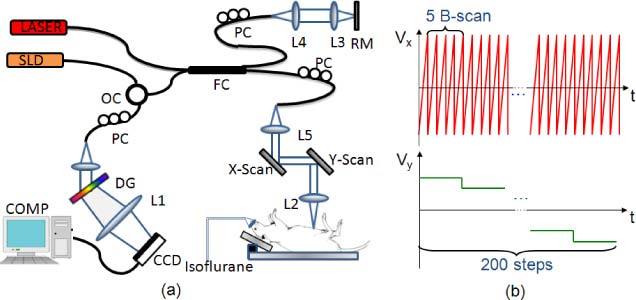
(a) Schematic of the UHS-OMAG system: SLD – super luminescent diode, OC – optical circulator, FC– 10:90 fiber coupler, PC – polarization controller, RM – reference mirror, Laser- pilot laser for beam guiding, DG – diffraction grating, CCD – line-scan camera, COMP – computer. (b) Scanning voltage pattern for galvo-mirror during UHS-OMAG data acquisition.
2.3 Scanning protocol and image reconstruction method
Unlike conventional OMAG [18], in order to achieve ultrahigh sensitive imaging of slow microcirculation, UHS-OMAG employed a new scanning protocol and data processing algorithm for image reconstruction. Figure 1 (b) shows the scanning voltage pattern used to drive the galvo-scanner. Firstly, the x-scanner was driven by a 150 Hz saw tooth waveform Vx (red), meaning the imaging rate is 150 frames/sec (fps). In each B scan (i.e. x-direction scan) we acquired 256 A-lines with a spacing of ~10 μm between adjacent lines that covered a size of ~2.5 mm on the kidney. Secondly, the y-scanner was driven by a step function Vy (green), and the entire C scan consists of 200 steps, with spacing of ~12.5 μm between steps. In each position (step), we acquired 5 repeated B scans, which was preferred by the UHS-OMAG algorithm. Accordingly, it required only 6.7 sec to acquire one 3D OMAG data set with the A-line scanning speed of 47 KHz, covering an area of ~2.5x2.5 mm2 on the kidney surface.
In order to image the slow flows, UHS-OMAG applied high pass filtering along the C-scan direction, rather than the B-scan direction as in conventional OMAG [18]. According to VAxial = Δφ(z,t)λ0/4πnΔt, where λ0 is the central wavelength of the light source and n is the refractive index of the sample, the detectable flow velocity is determined by the time spacing between adjacent interferograms used for velocity calculation. Since our OMAG algorithm shifts from B-scan direction to C-scan direction, the time spacing between adjacent interferograms would change from ΔtA (between adjacent A scans) to ΔtB (between adjacent B scans). As the A-scan rate we used here was 47 kHz, and A-line number in each B-scan was 256, the imaging speed achieved was 150 fps, leading to ΔtB = 6.7 ms. Hence, the maximum unambiguous detectable velocity in UHS-OMAG would be ~72 µm/s. That means flow velocity smaller than 72µm/s could be detected as the time spacing is much longer. On the other hand, the minimal flow velocity that can be detected by the system is determined by the system phase noise floor. With the measured SNR = 105 dB, the minimal detectable flow velocity is ~4 μm/s as demonstrated in our previous study [21].
We must emphasize that the maximum velocity that can be detected by the system is determined by the system A-scan imaging rate, or more precisely the integration time of the camera used in the study. Here, the imaging speed was of 47,000 A-scans per second. Thus, the blood flow with a maximal velocity of ~30 mm/s would be detectable. Therefore, the detectable blood flow of the UHS-OMAG system would range from ~4µm/s to ~30mm/s, which range is sufficient to image the renal circulation in the mice.
2.4 Visualization and Quantitative analysis of renal ischemia
According to the American Academy of Family Physicians, approximately 60 to 70 percent of acute renal failure cases are classified as prerenal, characterized by significantly reduced blood flow to the kidneys. Renal ischemia is a severe condition that can cause acute renal failure. In order to evaluate the effectiveness of UHS-OMAG for dynamic renal microcirculation monitoring, it was applied to image the microvasculature changes throughout renal ischemia and reperfusion (three mice were used for this work). After taking the baseline under the normal condition, a renal ischemia was induced by applying a tension on the silk loop to occlude the renal artery. During the first 30 seconds, repeated B-Scans at the same cross-section were done for qualitative and quantitative analysis to check the immediate response of blood flow velocity. After that we continuously captured the 3D volumetric data set every 30 seconds for the same region until no blood flow was measured, meaning almost complete ischemia occurred at this time point. The silk loop was then released to allow for renal reperfusion, and 3D volumetric data was acquired again continuously every 30 seconds after the release so that the progress of renal reperfusion was followed.
To quantitatively analyze the renal microcirculation response to the ischemia, especially for capillaries, we applied the phase resolved technique [25] to the UHS-OMAG flow signals, which calculates the phase changes of the interference signal caused by moving blood cells. Since the flow velocity in a single capillary is slow (usually down to several tens of microns per second), the traditional phase resolved technique that analyzes the phase difference between adjacent A-lines within one B-scan was inadequate to extract this velocity. However, as described above, if we shift this phase analysis from B-scan direction to C-scan direction, the time spacing between adjacent interferogram would change from ΔtA (between adjacent A scans within one B-scan) to ΔtB (adjacent A –lines between adjacent B scans), and this will enable us to measure the blood flow velocity of capillary. Hence, the axial flow velocity in the capillary is derived from the phase differences between adjacent B-scans. The relationship between them is:
| (1) |
where Δφ is the phase difference between adjacent A-scans within two adjacent B-scans at one location; λ0 is the central wavelength of the light source; n is the refractive index of tissue (~1.35); ΔtB is the time interval for the phase change calculation. Here, ΔtB equals to 6.7 ms as mentioned above.
3. Experimental Results and discussion
In vivo visualization of the renal microvascular perfusion in mouse was obtained through the subcostal flank incision. Data were acquired over a region of 2.5 mm by 2.5 mm on the exposed mouse kidney. By applying UHS-OMAG algorithm on these data, the cross-sectional OCT structure image and the corresponding-OMAG blood flow can be obtained as show in Fig. 2 (A) and (B) . From the structural image, the capsule and renal cortex can be observed. Notably, the maximal penetration depth is around ~1 mm in renal tissue. This limited imaging depth is in part due to 1) the high scattering property of renal cortex which prevents the light from penetrating deeper in the tissue, and 2) the dense microvasculature network into which the blood moves within the cortex that attenuate the penetrating light. Luckily, within this imaging depth plenty of capillary vessels (peritubular capillaries) could be detected as shown in Fig. 2 (B), where all small bright dots represent capillary vessels as pointed by small arrows. Thinner cortical tissue would make the arcuate artery visible as pointed by the open arrow.
Fig. 2.
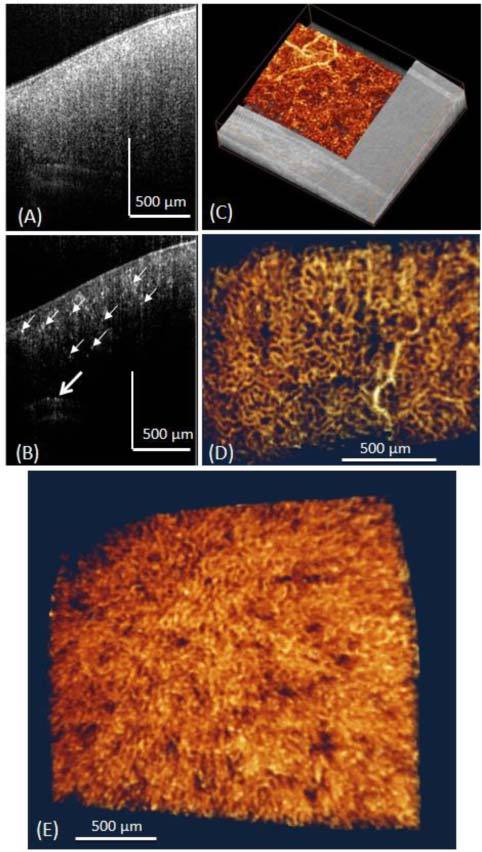
Typical in vivo UHS-OMAG imaging results of the renal microcirculation in adult mouse. (A) Shows one typical cross-sectional OCT image of the mouse kidney structure, and (B) is corresponding UHS-OMAG blood flow image of (A). Small white arrows point to the small capillaries and the open arrow points the arcuate artery. (C) 3D merged structure and volumetric perfusion image, (D) Microvasculature image showing the arterioles and peritubular capillary network. (E) 3D rendered angiogram of cortical microvasculature from the top view.
Rendered with 3D visualization software Amira 5.01 (Visage Imaging, Inc.), 3D volumetric perfusion image of renal microvasculature were shown in Fig. 2 (E). We interpret the dark holes to be uriniferous tubules which surrounded by capillary networks. We also provided 3D reconstruction of the micro-perfusion map merged with the structure image as shown in Fig. 2 (C). Single capillary vessel can be resolved clearly from the dense micro-perfusion map. In order to better show the network of the capillaries, an en face image of the microvasculature at the depth of 100 µm below the surface was presented in Fig. 2 (D), where capillary vessels are in loop structures. Most of them are peritubular capillaries in the cortical nephron. Figure 2 (E) shows a 3D view of the renal microvasculature. Notably, we can see some luminescent areas which are supposed to be the renal tubules. To the best of our knowledge, this is the first demonstration of using OCT to visualize the detailed capillary network within renal cortex in vivo.
One of the advantages of OMAG versus other imaging techniques like LSI is its capability of giving depth-resolved information. To show the vessel distribution along the depth direction better, we segmented and rendered the perfusion maps in different depths. Figure 3 (a) is the 3D perfusion map that shows vessels in all depths of a kidney sample. Figure 3 (b-e) shows the en face perfusion map within 0-200 μm, 200-400μm, 400-600 μm, 600 + μm, respectively. By looking at vessels within these four depths, we found that the superficial layer contains mostly capillaries, while the deeper layer contains some bigger vessels. These big vessels are supposed to be interlobular arterioles and venules. Using the depth-resolved perfusion map would benefit the identification of abnormal renal function in depth.
Fig. 3.
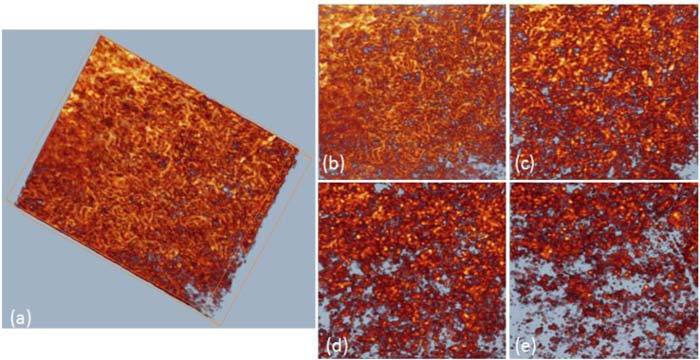
Typical image of renal microvasculature at different depth (distance from surface): (a) 3D volumetric perfusion map, maximal intensity projection map at depth of (b) 0-200 um, (c) 200-400um, (d) 400-600 um, (e) > 600 um. The imaged region is ~1.5 x 1.5 mm2.
Figure 4 (a) and (b) are the cross-sectional structure and corresponding blood flow images before renal ischemia, while (c) and (d) are the structure and blood flow images right after renal ischemia captured at the same cross-section. Obvious change can be seen in the blood flow image since in Fig. 4 (d) almost no blood flow was detected while the structure images kept almost unchanged. The functional vessel density was estimated from the cross-sectional blood flow image. In doing so, the flow images were first transformed into a binary format by setting a fixed intensity threshold. The percentage of pixels with binary value of 1s versus pixel numbers of the whole image was calculated as the estimation of vessel density. Figure 4 (e) shows the relative vessel density (normalized to the baseline that was captured at the normal state) change during the progress with 30 seconds interval between the time points. The functional blood vessel density reduced gradually when the renal artery was blocked until almost no blood flow could be detected which indicates almost the complete renal ischemia. When the artery was released, abrupt reperfusion occurs as the blood vessel density rise back to around 80% of the initial stage.
Fig. 4.
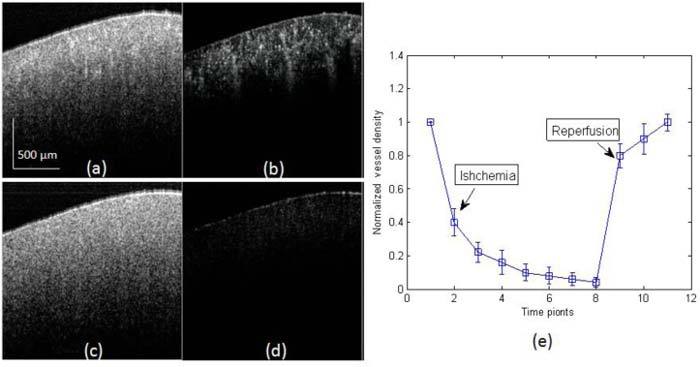
Monitor of the process of renal ischemia using UHS-OMAG. (a, c) are the cross-sectional structure images captured before and after renal ischemia, and (b, d) are the corresponding UHS-OMAG flow images. (e) The normalized vessel density change during the process of renal ischemia and reperfusion, mean ± SEM (n = 3).
The changes of the 3D rendered functional microvasculature were shown in Fig. 5 , where the functional vessel density reduction could be observed directly after renal ischemia. Within one minute, renal ischemia resulted in an obvious reduction of capillary flow within cortex. Meanwhile, we noticed that the capillaries stop flowing sooner than the interlobular arterioles or venules [as can be seen from Fig. 5 (b), where almost no capillary left and only afferent arteriole/ venules and interlobular artery/vein can be seen]. At the third minute, almost all the blood flow stopped; only several vessels could be seen from Fig. 5 (d) which represents severe renal ischemia. Reperfusion turned out to be faster than ischemia. Once the loop was released, an abrupt reperfusion happened within the first half minute [Fig. 5 (e)]. The functional microvasculature at this time point shows a vessel density that is similar to that at the baseline (0 min). And one minute later no more further change was observed as shown in Fig. 5 (f).
Fig. 5.
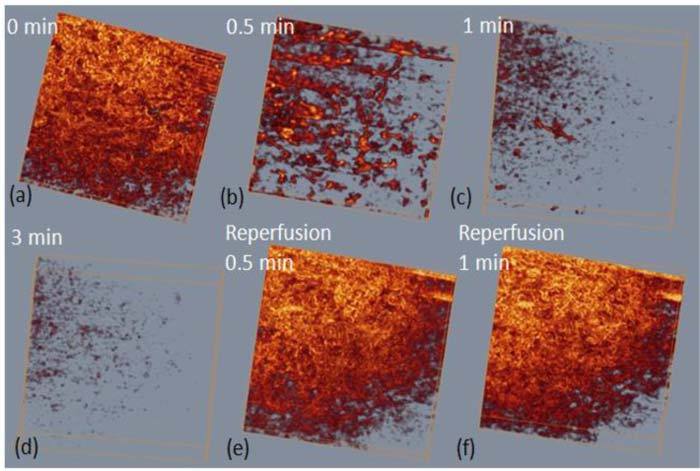
Representative 3D renal microcirculation perfusion maps show the process of renal ischemia and reperfusion. The imaged region shown here is ~1.5 x 1.5 mm2.
To examine in more detail about the dynamic change of microvasculature in response to ischemia, we resolved the phase difference between A-lines within subsequent B frames of the UHS-OMAG flow images to calculate the flow velocity. In order to eliminate the influence of background phase noise, phase differences were only calculated when the structural signal is 15dB above the noise floor. Longitudinal quantitative analysis was done on the blood flow velocity of single capillary vessel and the result was shown in Fig. 6 . We choose a typical capillary vessel using both the 2D cross-sectional flow image and the 3D capillary network map as shown in Fig. 6 panel (a). Then we applied the phase analysis method discussed above to calculate the velocity of this capillary and the velocity change during ischemia process as shown in Fig. 6 (b). The blood flow velocity in the capillary started to decrease immediately after the renal artery was clamped. Then it decreased almost linearly and stopped flowing in ~6 seconds because at this time point the velocity fell to the range of noise level (~6 µm/s). Our UHS-OMAG imaging system which has an imaging speed of 150 fps is capable of capturing this fast response in capillaries. And this result confirms the disappearing of small capillary vessels in Fig. 5 at 0.5 min point after the clamp of renal artery.
Fig. 6.
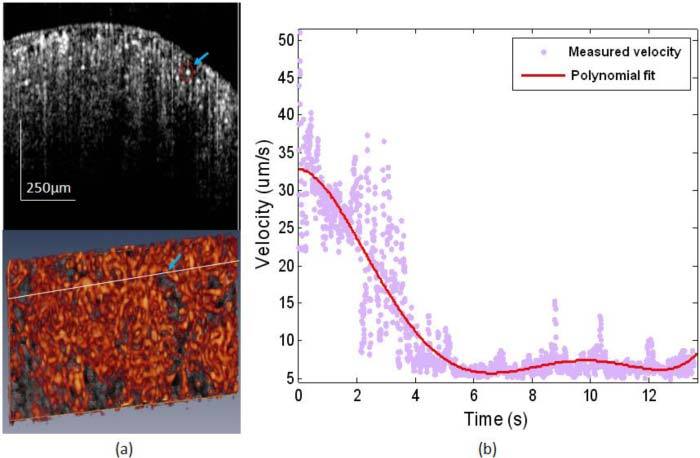
(a) Cross-sectional blood flow image (upper) showing the capillary vessel used for velocity evaluation as located by the circle and arrow. This capillary vessel was also pointed out in the bottom 3D capillary map. (b) Blood flow velocity change of the single capillary vessel pointed out in (a) during the process of renal ischemia.
Our method has ultrahigh sensitivity to the slow blood flow as we increased the time interval used for the phase calculation. But one drawback for this is that the unambiguous detectable velocity range is decreased, which means phase wrapping would happen for blood vessels with axial velocity components larger than this range. In our case, the maximal unambiguous detectable velocity is 72 µm/s. In order to avoid the problem of phase wrapping, we managed to find single capillary vessels with proper Doppler angle that given axial velocity component within this range for velocity evaluation.
4. Conclusions
In summary, we have presented a preliminary study on using UHS-OMAG to image renal microcirculation within mouse kidney in vivo. By shifting the previous OMAG algorithm from B-scan direction to C-scan direction, we have shown that UHS-OMAG system is sensitive to the capillary level renal microcirculation in mice. We provided preliminary result on qualitatively and quantitatively monitoring the progress of renal ischemia and reperfusion. Using high sensitive phase resolved technique we were able to calculate the flow velocity within single capillary and monitor its dynamic change during the ischemia process. This earlier work may lead to the potential applications of OCT/OMAG for renal microvasculature imaging which is critical for renal pathology and physiology.
Acknowledgments
This work was supported in part by research grants from the National Heart, Lung, and Blood Institute (R01 HL093140), National Institute of Biomedical Imaging and Bioengineering (R01 EB009682), and the American Heart Association (0855733G). The content is solely the responsibility of the authors and does not necessarily represent the official views of grant giving bodies.
References and links
- 1.Steiber A. L., Kalantar-Zadeh K., Secker D., McCarthy M., Sehgal A., McCann L., “Subjective Global Assessment in chronic kidney disease: a review,” J. Ren. Nutr. 14(4), 191–200 (2004). [PubMed] [Google Scholar]
- 2.Nissel R., Fischer D. C., Puhlmann A., Holdt-Lehmann B., Mitzner A., Petzsch M., Körber T., Tieß M., Schmidt R., Haffner D., “Short-term growth hormone treatment and microcirculation: effects in patients with chronic kidney disease,” Microvasc. Res. 78(2), 246–252 (2009). 10.1016/j.mvr.2009.05.006 [DOI] [PubMed] [Google Scholar]
- 3.Iliescu R., Fernandez S. R., Kelsen S., Maric C., Chade A. R., “Role of renal microcirculation in experimental renovascular disease,” Nephrol. Dial. Transplant. 25(4), 1079–1087 (2010). 10.1093/ndt/gfp605 [DOI] [PMC free article] [PubMed] [Google Scholar]
- 4.Knesplova L., Krestin G. P., “Magnetic resonance in the assessment of renal function,” Eur. Radiol. 8(2), 201–211 (1998). 10.1007/s003300050363 [DOI] [PubMed] [Google Scholar]
- 5.Hillman B. J., Lee S. M., Tracey P., Swindell W., Long D. M., “CT determination of renal and hepatic microvascular volumes in experimental acute renal failure,” Invest. Radiol. 17(1), 41–45 (1982). 10.1097/00004424-198201000-00008 [DOI] [PubMed] [Google Scholar]
- 6.Fortepiani L. A., Ruiz M. C., Passardi F., Bentley M. D., Garcia-Estan J., Ritman E. L., Romero J. C., “Effect of losartan on renal microvasculature during chronic inhibition of nitric oxide visualized by micro-CT,” Am. J. Physiol. Renal Physiol. 285(5), F852–F860 (2003). [DOI] [PubMed] [Google Scholar]
- 7.Bentley M. D., Lerman L. O., Hoffman E. A., Fiksen-Olsen M. J., Ritman E. L., Romero J. C., “Measurement of renal perfusion and blood flow with fast computed tomography,” Circ. Res. 74(5), 945–951 (1994). [DOI] [PubMed] [Google Scholar]
- 8.Nilsson A., “Contrast-enhanced ultrasound of the kidneys,” Eur. Radiol. 14(S8 Suppl 8 Suppl 8), 104–109 (2004). [PubMed] [Google Scholar]
- 9.Wei K., Le E., Bin J. P., Coggins M., Thorpe J., Kaul S., “Quantification of renal blood flow with contrast-enhanced ultrasound,” J. Am. Coll. Cardiol. 37(4), 1135–1140 (2001). 10.1016/S0735-1097(00)01210-9 [DOI] [PubMed] [Google Scholar]
- 10.Yamamoto T., Tada T., Brodsky S. V., Tanaka H., Noiri E., Kajiya F., Goligorsky M. S., “Intravital videomicroscopy of peritubular capillaries in renal ischemia,” Am. J. Physiol. Renal Physiol. 282(6), F1150–F1155 (2002). [DOI] [PubMed] [Google Scholar]
- 11.Kuliszewski M., Rudenko D., Connelly K., Yuen D., Trogadis J., Advani A., Gilbert R., Leong-Poi H., “Abstract 5266: a novel technique for assessing the renal microvasculature in chronic kidney disease,” Circulation 120, S1077 (2009). [Google Scholar]
- 12.Bezemer R., Legrand M., Klijn E., Heger M., Post I. C., van Gulik T. M., Payen D., Ince C., “Real-time assessment of renal cortical microvascular perfusion heterogeneities using near-infrared laser speckle imaging,” Opt. Express 18(14), 15054–15061 (2010). 10.1364/OE.18.015054 [DOI] [PubMed] [Google Scholar]
- 13.Huang D., Swanson E. A., Lin C. P., Schuman J. S., Stinson W. G., Chang W., Hee M. R., Flotte T., Gregory K., Puliafito C. A., Fujimoto J. G., “Optical coherence tomography,” Science 254(5035), 1178–1181 (1991). 10.1126/science.1957169 [DOI] [PMC free article] [PubMed] [Google Scholar]
- 14.Tomlins P. H., Wang R. K., “Theory, developments and applications of optical coherence tomography,” J. Phys. D Appl. Phys. 38(15), 2519–2535 (2005). 10.1088/0022-3727/38/15/002 [DOI] [Google Scholar]
- 15.Andrews P. M., Chen Y., Onozato M. L., Huang S. W., Adler D. C., Huber R. A., Jiang J., Barry S. E., Cable A. E., Fujimoto J. G., “High-resolution optical coherence tomography imaging of the living kidney,” Lab. Invest. 88(4), 441–449 (2008). 10.1038/labinvest.2008.4 [DOI] [PubMed] [Google Scholar]
- 16.Chen Y., Andrews P. M., Aguirre A. D., Schmitt J. M., Fujimoto J. G., “High-resolution three-dimensional optical coherence tomography imaging of kidney microanatomy ex vivo,” J. Biomed. Opt. 12(3), 034008 (2007). 10.1117/1.2736421 [DOI] [PubMed] [Google Scholar]
- 17.Li Q., Onozato M. L., Andrews P. M., Chen C. W., Paek A., Naphas R., Yuan S., Jiang J., Cable A., Chen Y., “Automated quantification of microstructural dimensions of the human kidney using optical coherence tomography (OCT),” Opt. Express 17(18), 16000–16016 (2009). 10.1364/OE.17.016000 [DOI] [PubMed] [Google Scholar]
- 18.Wang R. K., Jacques S. L., Ma Z., Hurst S., Hanson S. R., Gruber A., “Three dimensional optical angiography,” Opt. Express 15(7), 4083–4097 (2007). 10.1364/OE.15.004083 [DOI] [PubMed] [Google Scholar]
- 19.Wang R. K., Hurst S., “Mapping of cerebro-vascular blood perfusion in mice with skin and skull intact by Optical Micro-AngioGraphy at 1.3 mum wavelength,” Opt. Express 15(18), 11402–11412 (2007). 10.1364/OE.15.011402 [DOI] [PubMed] [Google Scholar]
- 20.An L., Wang R. K., “In vivo volumetric imaging of vascular perfusion within human retina and choroids with optical micro-angiography,” Opt. Express 16(15), 11438–11452 (2008). 10.1364/OE.16.011438 [DOI] [PubMed] [Google Scholar]
- 21.An L., Qin J., Wang R. K., “Ultrahigh sensitive optical microangiography for in vivo imaging of microcirculations within human skin tissue beds,” Opt. Express 18(8), 8220–8228 (2010). 10.1364/OE.18.008220 [DOI] [PMC free article] [PubMed] [Google Scholar]
- 22.Wang R. K., An L., Francis P., Wilson D. J., “Depth-resolved imaging of capillary networks in retina and choroid using ultrahigh sensitive optical microangiography,” Opt. Lett. 35(9), 1467–1469 (2010). 10.1364/OL.35.001467 [DOI] [PMC free article] [PubMed] [Google Scholar]
- 23.Jia Y., An L., Wang R. K., “Label-free and highly sensitive optical imaging of detailed microcirculation within meninges and cortex in mice with the cranium left intact,” J. Biomed. Opt. 15(3), 030510 (2010). 10.1117/1.3432654 [DOI] [PMC free article] [PubMed] [Google Scholar]
- 24.Jung Y., Zhi Z., Wang R. K., “Three-dimensional optical imaging of microvascular networks within intact lymph node in vivo,” J. Biomed. Opt. 15(5), 050501 (2010). 10.1117/1.3496301 [DOI] [PMC free article] [PubMed] [Google Scholar]
- 25.Zhao Y., Chen Z., Saxer C., Xiang S., de Boer J. F., Nelson J. S., “Phase-resolved optical coherence tomography and optical Doppler tomography for imaging blood flow in human skin with fast scanning speed and high velocity sensitivity,” Opt. Lett. 25(2), 114–116 (2000). 10.1364/OL.25.000114 [DOI] [PubMed] [Google Scholar]


