Abstract
The location of the loss of the inner segment (IS)/outer segment (OS) border, as seen with frequency domain optical coherence tomography (fdOCT), was determined on fdOCT scans from patients with retinitis pigmentosa. A comparison to visual field loss supported the hypothesis, based upon previous work, that the point at which the IS/OS border disappears provides a structural marker for the edge of the visual field. Repeat fdOCT measures showed good within day reproducibility, while data obtained on average 22.5 months later showed signs of progression. The IS/OS contour shows promise as a measure for following changes in patients undergoing treatment.
OCIS codes: (170.4500) Optical coherence tomography, (330.4300) Vision system - noninvasive assessment
1. Introduction
The loss of vision due to heredodegenerative diseases of the receptors traditionally has been followed in the clinic with behaviorally measured visual fields and/or electrophysiologically measured electroretinograms. The behavioral techniques, such as standard automated perimetry (SAP), have the advantage of providing topographical information about the disease process. With the introduction of optical coherence tomography (OCT), it became possible to obtain topographical information about the anatomical/structural damage to the receptors as well.
A number of studies have shown a correspondence between a loss of light sensitivity with SAP and a decrease in receptor layer thickness on OCT scans. Earlier studies with time domain OCT showed good quantitative agreement between the extent of local field loss and the thickness of the outer nuclear layer (ONL) [1–4]. With the improved resolution of frequency domain (fd) OCT, it became possible to measure the thickness of the outer segment (OS) layer. Rangaswamy et al. [5], for example, found that the OS thickness decreased approximately linearly with local field loss, becoming non-detectable in regions where visual field sensitivity loss was worse than −10 dB. A study of the transition zone from regions of normal to abnormal vision reported that the earliest sign of damage in RP was a thinning of the OS layer, followed by a decrease in ONL thickness, and then a disappearance of the OS layer [6]. The disappearance of the OS layer occurs, by definition, at the point where the so-called inner segment (IS)/OS border is no longer visible.
What is called the IS/OS border is a prominent and clearly visible landmark on OCT scans. Whether this is in fact the IS/OS border or the ellipsoids at the distal ends of the IS is open to debate [7]. In any case, there are many reports of this IS/OS border being disrupted in patients with diseases of the outer retina. (See for example [8–10].) Of particular relevance here is the finding of Fischer et al. [11] that the distance from the center of the fovea to the loss of the IS/OS signal correlated with distance to the edge of the visual field as measured with Goldmann perimetry.
Taken together, these studies suggest that the point at which the IS/OS border disappears should correspond to a visual field sensitivity loss of −10 dB and may provide a structural marker for the edge of the visual field. Here we test this hypothesis. In addition, we explore the use of this OCT marker as a possible measure of disease progression.
2. Methods
2.1. Subjects
Six patients with RP (age 47.8 ± 11.1 yr) were enrolled in this study. Patients were diagnosed with RP based on the appearance of the fundus, clinical history, visual fields, and full‐field electroretinogram results. All patients had best corrected visual acuity (BCVA) of 20/25 or better. Table 1 summarizes some of the clinical characteristics. Twenty healthy controls (age 51.4 ± 9.4 yr) without visual abnormalities served as controls for the OCT measures.
Table 1. Patient characteristicsa.
| Patient | Eye | Age | Gender | BCVA | Type (genetics) | 10-2 fovea (dB) | 10-2 MD (dB) | Time to visit 2 (mos) |
|---|---|---|---|---|---|---|---|---|
| P1 | OD | 48 | F | 20/20-2 | AR (unknown) | 33 | −7.09 | 31 |
| P2 | OD | 37 | M | 20/20-1 | AD (unknown) | 35 | −27.42 | 25 |
| P3 | OD | 50 | F | 20/25 | Simplex | 32 | −28.37 | 24 |
| P4 | OD | 57 | F | 20/16 | AR (USH2A-E3088K) | 35 | −5.36 | 24 |
| P5 | OS | 35 | F | 20/25 | Usher II (unknown) | 32 | −15.43 | 21 |
| P6 | OD | 62 | F | 20/16-1 | AD (unknown) | 36 | −17.25 | 10 |
aBCVA: best corrected visual acuity; AR: autosomal recessive; AD: autosomal dominant.
A single eye of each patient was tested with SAP (10-2 SITA standard program, Carl Zeiss Meditec, Inc. Dublin, CA) and OCT 3D macular cube scans (Topcon, Inc., Paramus, NJ, USA). The 10-2 visual field protocol uses a test spot 0.43° in diameter presented on a grid of 68 points and against a background is 31.5 cd.m2. The grid starts ± 1° from the point of fixation with the points spaced every 2°. All patients had reliable 10-2 visual fields with foveal sensitivities between 32 to 36 dB. With the exception of P3 and P5, the foveal sensitivity on the 10-2 was within normal limits. The macular cube scan consisted of 128 line scans [B-scans] and covered a 6 mm by 6 mm region, approximately 21° by 21°. Repeat scans were obtained at each visit. In addition, the patients were tested again, on average 22.5 mos. after the first session. All 6 patients had fdOCT scans on the second visit and 5 of 6 had 10-2 visual field tests, as well. All patients had good fixation and the scans were relatively free of movement artifacts.
Written informed consent was obtained from all subjects. Procedures followed the tenets of the Declaration of Helsinki, and the protocol was approved by the Committee of the Institutional Board of Research of Columbia University.
2.2. fdOCT measurements
For every cube scan, 11 individual B-scans were manually segmented. The B-scans chosen included the one centered on the fovea (0°) and 10 others located at: ± 1°, ± 3°, ± 5°, ± 7°, and ± 9° from the center. The B-scan centered on the fovea was selected based upon the following criteria: the presence of a bright light reflex/artifact; the depth of the foveal depression; and the prominence of the peak in the IS/OS line. The manual segmentation procedure has been previously described [12,13]. For our purpose here, the IS/OS (red) line and the proximal (vitreal) edge of what is typically taken to be the retinal pigment epithelium (RPE) (green) were marked as shown in Fig. 1(b) and Fig. 1(c). The difference between these borders was taken as the OS thickness. The OS thickness was measured to provide an objective method for locating the loss of the IS/OS border. Figure 2 illustrates this procedure with the line scan shown in Fig. 1. The location of this line scan corresponds to the horizontal dashed red line in Fig. 2(a),(b) superimposed on P1’s 10-2 visual field. In Fig. 2(c), the OS thickness (red curve) is plotted versus retinal location for this scan; the black curves are the mean and 95% confidence intervals for the control group. The location at which the OS/IS border is lost is estimated as the point at which the OS thickness reaches the zero thickness line (dashed horizontal line), as indicated by the red circle. This location is also indicated with the red circle on the visual field in panel A. A similar procedure was followed for the 10 other scans positioned as shown in Fig. 2(b) to correspond to the locations of the 10-2 visual field points. This method of locating the edge of the IS/OS border agreed with the visual identification of its complete disappearance. That is, in a few cases the border appeared to be interrupted before it disappeared. While this region may be of interest to study in the future, here we ignored this section and marked only the point at which the IS/OS line disappeared as this point could be unambiguously determined.
Fig. 1.
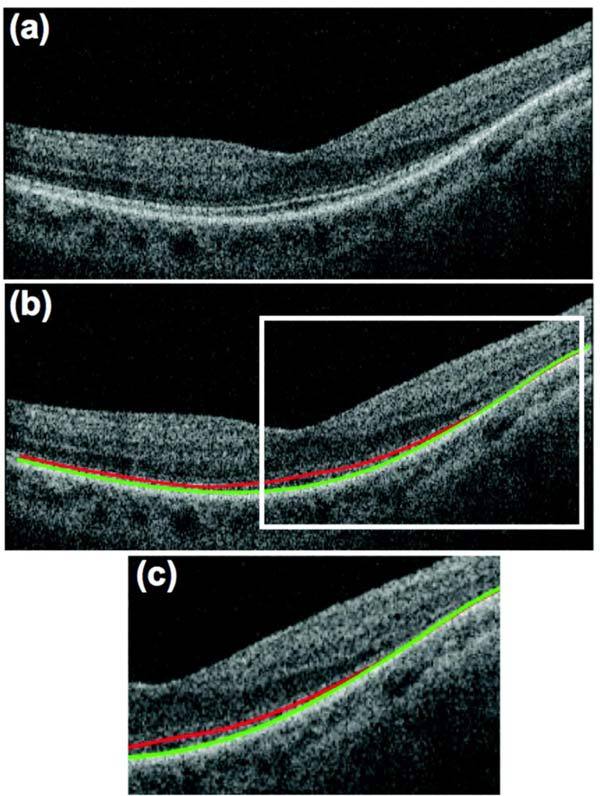
fdOCT scan through the horizontal meridian of P1. (a) Scan before segmentation. (b) Scan after segmentation of IS/OS (red) and OS/RPE (green) boundaries. (c) Expanded view of portion within white rectangle in panel (b).
Fig. 2.
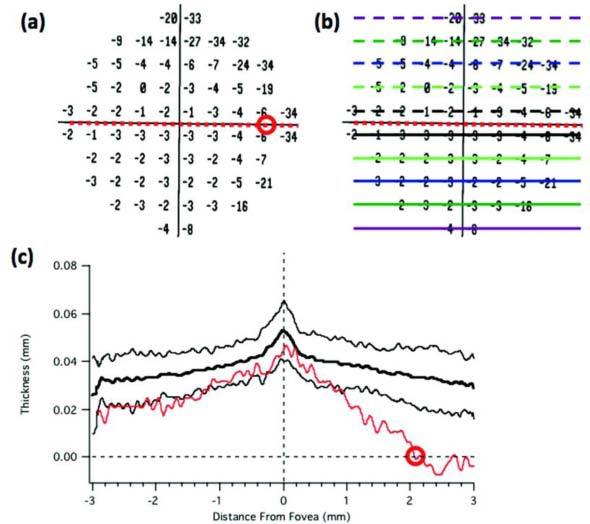
An illustration of the procedure for estimating the end of the IS/OS border using the horizontal scan for P1 shown in Fig. 1. (a) The 10-2 total deviation plot. (b) Same as panel A with the location of the scans segmented. (c) The thickness of the OS layer as a function of distance across the scan shown in Fig. 1. The dashed lines indicate zero OS thickness (horizontal) and the center of the fovea (vertical).
3. Results
3.1. IS/OS contours
Figure 3 summarizes the results for all 6 patients, ordered based upon the extent of the intact visual field. The black circles indicate the locations of the 10-2 test points and the red dots the locations of the end (disappearance) of the IS/OS border. We will refer to the red curve connecting these points as the ‘IS/OS contour’. (The dashed lines in Fig. 3 are estimated regions of the IS/OS contour and indicate a place where the exact location of the IS/OS disappearance was uncertain due to the sparse vertical spacing of the segmented scans.) The numbers inside the black circles are the loss in sensitivity (total deviation in dB) relative to a control group for each patient’s 10-2 visual field.
Fig. 3.
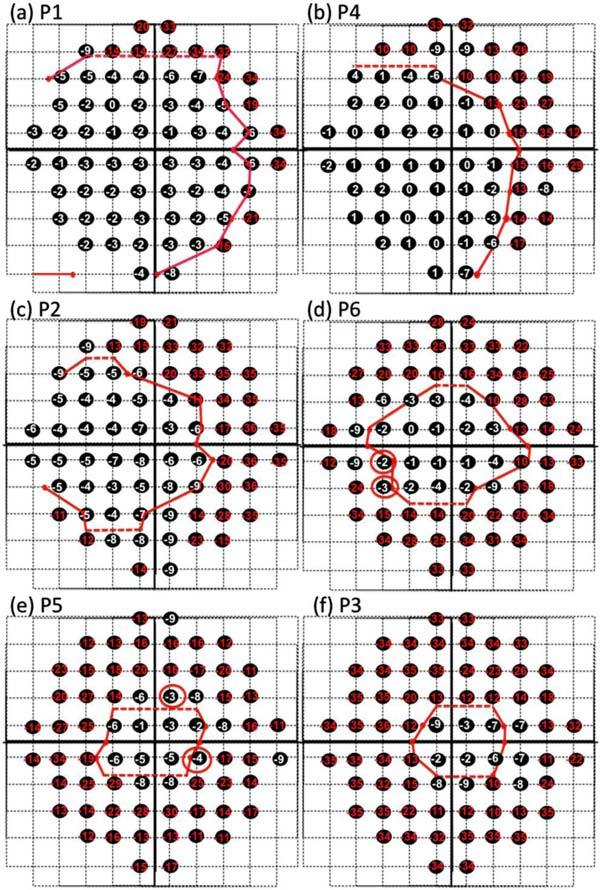
IS/OS contours and visual fields. A dashed line was used where the exact location of the IS/OS disappearance was uncertain due to the sparse vertical spacing of the segmented scans. (a) The 10-2 visual field losses (total deviation in dB) are shown with the boundary (red curve) of the IS/OS loss for patient P1. Visual field losses of −10 or worse are shown in red. (b)-(f). Same as in (a) for the other 5 patients.
We hypothesized that the termination of the IS/OS border should correspond approximately to a visual field loss of −10 dB [5]. The visual field points of −10 dB or worse are shown in red. Of the 408 points in Fig. 3, 3 (<1%) of the points coded red (−10 dB or worse) fell inside the red IS/OS contour, while 36 (<9%) of the points outside the red contours were not red (i.e. −9 dB or better). The agreement with the −10 dB hypothesis appears to be good, but it would be slightly better if a cutoff of −8 dB were used for this data set (see below). Of the 36 ‘discrepant’ points outside the IS/OS contour, 24 (67%) were −8 or −9 dB. Only 12 points better than −8 dB fell outside the IS/OS contour and only 4 of these points had visual field sensitivities better than −5 dB (red circles), well within the 95% confidence intervals for visual field measurements. That is, the agreement is even better than it appears if the variability of the visual field measures is taken into consideration. In any case, the issue here is not the particular value of the field loss that best agrees with the IS/OS contour. Rather, it appears from Fig. 3 that this contour falls, in general, in the region of a marked loss in field sensitivity. To obtain a quantitative measure of this qualitative observation, we compared the sensitivity of the visual field points adjacent to the inside of the IS/OS contour to those adjacent to the outside. The median of all points adjacent to the inside of this contour was −4 dB as compared to −12 dB for those just outside, a difference of −8 dB or a change in sensitivity by a factor of more than 6.
3.2. Repeat Reliability
All patients had repeat scans taken at each session The red curves in Fig. 4 are the result of the segmentation of the two scans for the first visit and the green curves are the results for the second visit, 10 to 31 months later. For all 6 patients, the mean difference between IS/OS contour on the 2 scans repeated on the same visit was 0.00 ± 0.12mm and 0.11 ± 0.16mm, for the first and second visits respectively, or on average < 0.2 degrees in visual angle on the field. (The average of the mean of the absolute differences was 0.18 ± 0.06mm and 0.17 ± 0.13mm or about 0.6 degrees.)
Fig. 4.
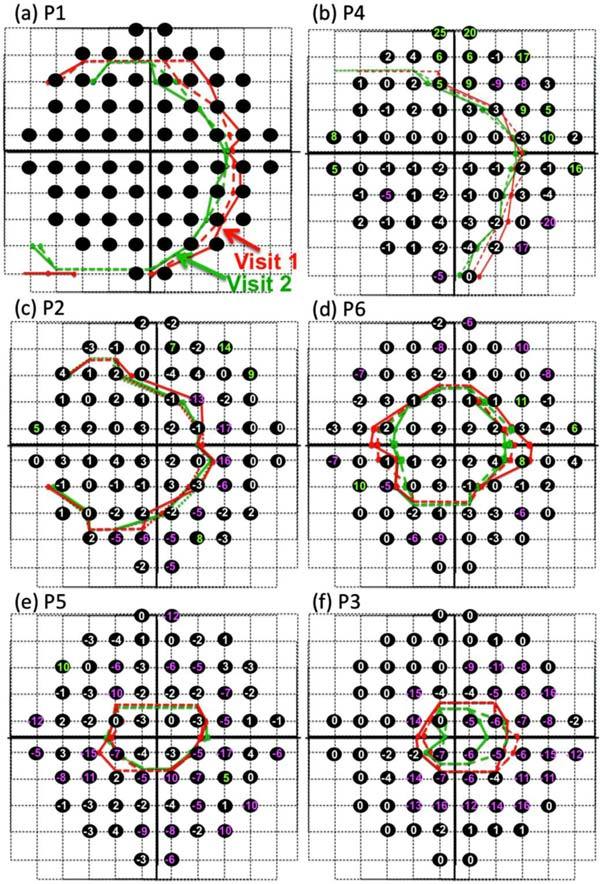
Repeat measures within and across sessions. In each panel, the red and green curves show the 2 scans performed on the first (red) and second (green) visits. Black circles indicate the location of the 10-2 points and the numbers (in dB) show the change in field sensitivity (in dB) between the 2 visits (visit 2-visit 1).
3.3. A possible method for following progression
The patients returned for repeat 10-2 fields and fdOCT scans between 10 and 31 months later. The number in each black circle in Fig. 4 is the difference in dB between visual field test sensitivity on the two occasions (visit 2 minus visit 1). In particular, a negative number means that the more recent field at that point showed a more negative (poorer) total deviation score, while a positive number indicates the more recent field had a better total deviation score. To help visualize changes in the visual field, differences of −5 dB or worse were colored pink, while changes of 5 dB or better were coded green. (Note due to an error, P1 did not have a 10-2 test on visit 2.)
For the IS/OS contours, in general the earlier measures (red) fell outside the more recent measures (green). To obtain a quantitative measure of this, the location of the two IS/OS contours were averaged and then the locations of the IS/OS contours for the different sessions were compared point by point for each patient. The IS/OS contour moved closer to the center of fixation on average by 0.21 ± 0.18 mm. For the individual patients, these values were P1: 0.51 mm; P2: 0.08 mm; P3: 0.29 mm; P4: 0.24 mm; P5: 0.02 mm; and P6: 0.18 mm.
To make a quantitative comparison to the change in the visual fields, we compared the difference in mean deviation (MD) values between the two visits to the change in the position of the IS/OS contour between visits. For the 5 patients on whom we had repeat 10-2 scans, on average, the movement of the IS/OS contour of 0.16 mm was associated with an average change in MD of −4.02 dB.
3.4. Local OS thickness vs. local sensitivity change
In order to quantitatively test the hypothesis that field losses of −10 dB or more correspond to regions without a measurable OS layer [5], the normalized OS thickness was plotted against visual field loss in Fig. 5 . Each small point in Fig. 5 shows the OS thickness and visual field loss for an individual field point of an individual patient at the first visit. To normalize the OS thickness at each retinal location for each patient, the OS thickness was divided by the OS thickness of the controls at that point. This was necessary to adjust for the variation in OS thickness with eccentricity seen in controls [5]. 68 data points, corresponding to the 68 test points on the 10-2, are shown for each of the 6 patients (different colors). Except for one (green) data point, the OS thickness for all visual field points with total deviations worse than −8 dB (vertical solid black line) cluster around the zero OS line as previously reported [5]. The black squares are the mean values for data of equal size bins (x-axis). The mean OS thickness is close to zero by the time the mean field loss is −8 dB. Taken together with the analysis of Fig. 4, these results suggest that on average, the loss of the IS/OS border corresponds better to a loss of −8 dB for this group of patients. As mentioned above, the exact value of this cutoff is not important for the method presented here. In fact, from a practical point of view, the potential clinical usefulness of the IS/OS contour depends upon the repeat reliability of this measure, which is quite good as shown above.
Fig. 5.
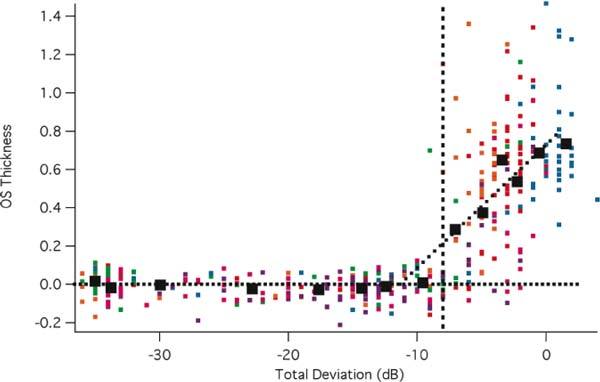
OS thickness versus field loss. The thickness of the OS at each point in the visual field is shown for individual patients (small symbols) as a function of the field loss at that point. The large symbols are the means of the data grouped into equal sized bins.
3.5. Limitations and future directions
All patients in this study had relatively preserved central retinas. Because the IS/OS border disappears for field losses greater than about −8 dB, this technique will not be useful for patients with severely depressed central fields. For such patients, ONL thickness should be explored [6]. Further work is also needed to understand the effects on the IS/OS line of different genetic variations of RP, as well as the relative effect of losing local rods as compared to a loss of rods and cones. In addition, future work, perhaps with adaptive optics [14], should help elucidate the structural basis of the IS/OS line, as well as the changes seen with disease.
4. Conclusion
The point at which the IS/OS border disappears, the IS/OS contour, shows promise as a structural measure of progression. First, the reproducibility of the IS/OS contour showed good within day repeatability when the contours from 2 different scans were compared. Second, the IS/OS contour exhibited good agreement with a sharp drop in VF sensitivity. Finally, the preliminary data presented here suggest this measure of IS/OS contour may be useful in following changes in patients undergoing treatment.
Acknowledgments
This work was supported by NIH Grant R01-EY-09076 and a grant of equipment from Topcon, Inc.
References and links
- 1.Apushkin M. A., Fishman G. A., Alexander K. R., Shahidi M., “Retinal thickness and visual thresholds measured in patients with retinitis pigmentosa,” Retina 27(3), 349–357 (2007). 10.1097/01.iae.0000224944.33863.18 [DOI] [PubMed] [Google Scholar]
- 2.Aleman T. S., Cideciyan A. V., Sumaroka A., Windsor E. A., Herrera W., White D. A., Kaushal S., Naidu A., Roman A. J., Schwartz S. B., Stone E. M., Jacobson S. G., “Retinal laminar architecture in human retinitis pigmentosa caused by Rhodopsin gene mutations,” Invest. Ophthalmol. Vis. Sci. 49(4), 1580–1590 (2008). 10.1167/iovs.07-1110 [DOI] [PMC free article] [PubMed] [Google Scholar]
- 3.Jacobson S. G., Aleman T. S., Sumaroka A., Cideciyan A. V., Roman A. J., Windsor E. A., Schwartz S. B., Rehm H. L., Kimberling W. J., “Disease boundaries in the retina of patients with Usher syndrome caused by MYO7A gene mutations,” Invest. Ophthalmol. Vis. Sci. 50(4), 1886–1894 (2009). 10.1167/iovs.08-3122 [DOI] [PubMed] [Google Scholar]
- 4.Jacobson S. G., Cideciyan A. V., Aleman T. S., Sumaroka A., Windsor E. A., Schwartz S. B., Heon E., Stone E. M., “Photoreceptor layer topography in children with leber congenital amaurosis caused by RPE65 mutations,” Invest. Ophthalmol. Vis. Sci. 49(10), 4573–4577 (2008). 10.1167/iovs.08-2121 [DOI] [PMC free article] [PubMed] [Google Scholar]
- 5.Rangaswamy N. V., Patel H. M., Locke K. G., Hood D. C., Birch D. G., “A comparison of visual field sensitivity to photoreceptor thickness in retinitis pigmentosa,” Invest. Ophthalmol. Vis. Sci. 51(8), 4213–4219 (2010). 10.1167/iovs.09-4945 [DOI] [PMC free article] [PubMed] [Google Scholar]
- 6.Hood D. C., Lazow M. A., Locke K. G., Greenstein V. C., Birch D. G., “The transition zone between healthy and diseased retina in patients with retinitis pigmentosa,” Invest. Ophthalmol. Vis. Sci. 52(1), 101–108 (2011). 10.1167/iovs.10-5799 [DOI] [PMC free article] [PubMed] [Google Scholar]
- 7.Fernández E. J., Hermann B., Povazay B., Unterhuber A., Sattmann H., Hofer B., Ahnelt P. K., Drexler W., “Ultrahigh resolution optical coherence tomography and pancorrection for cellular imaging of the living human retina,” Opt. Express 16(15), 11083–11094 (2008). 10.1364/OE.16.011083 [DOI] [PubMed] [Google Scholar]
- 8.Chang L. K., Koizumi H., Spaide R. F., “Disruption of the photoreceptor inner segment-outer segment junction in eyes with macular holes,” Retina 28(7), 969–975 (2008). 10.1097/IAE.0b013e3181744165 [DOI] [PubMed] [Google Scholar]
- 9.Oishi A., Otani A., Sasahara M., Kojima H., Nakamura H., Kurimoto M., Yoshimura N., “Photoreceptor integrity and visual acuity in cystoid macular oedema associated with retinitis pigmentosa,” Eye (Lond.) 23(6), 1411–1416 (2009). 10.1038/eye.2008.266 [DOI] [PubMed] [Google Scholar]
- 10.Aizawa S., Mitamura Y., Baba T., Hagiwara A., Ogata K., Yamamoto S., “Correlation between visual function and photoreceptor inner/outer segment junction in patients with retinitis pigmentosa,” Eye (Lond.) 23(2), 304–308 (2009). 10.1038/sj.eye.6703076 [DOI] [PubMed] [Google Scholar]
- 11.Fischer M. D., Fleischhauer J. C., Gillies M. C., Sutter F. K., Helbig H., Barthelmes D., “A new method to monitor visual field defects caused by photoreceptor degeneration by quantitative optical coherence tomography,” Invest. Ophthalmol. Vis. Sci. 49(8), 3617–3621 (2008). 10.1167/iovs.08-2003 [DOI] [PubMed] [Google Scholar]
- 12.Hood D. C., Lin C. E., Lazow M. A., Locke K. G., Zhang X., Birch D. G., “Thickness of receptor and post-receptor retinal layers in patients with retinitis pigmentosa measured with frequency-domain optical coherence tomography,” Invest. Ophthalmol. Vis. Sci. 50(5), 2328–2336 (2009). 10.1167/iovs.08-2936 [DOI] [PMC free article] [PubMed] [Google Scholar]
- 13.Hood D. C., Cho J., Raza A. S., Dale E. A., Wang M., “Reliability of a computer-aided manual procedure for segmenting optical coherence tomography scans,” Optom. Vis. Sci. 88(1), 113–123 (2011). 10.1097/OPX.0b013e3181fc3625 [DOI] [PMC free article] [PubMed] [Google Scholar]
- 14.Jonnal R. S., Besecker J. R., Derby J. C., Kocaoglu O. P., Cense B., Gao W., Wang Q., Miller D. T., “Imaging outer segment renewal in living human cone photoreceptors,” Opt. Express 18(5), 5257–5270 (2010). 10.1364/OE.18.005257 [DOI] [PMC free article] [PubMed] [Google Scholar]


