Abstract
Using a spectral domain OCT system, equipped with a broadband Ti:sapphire laser, we imaged the human retina with 5 µm x 1.3 µm transverse and axial resolution at acquisition rate of 100 kHz. Such imaging speed significantly reduces motion artifacts. Combined with the ultra-high resolution, this allows observing microscopic retinal details with high axial definition without the help of adaptive optics. In this work we apply our system to image the parafoveal capillary network. We demonstrate how already on the intensity level the parafoveal capillaries can be segmented by a simple structural high pass filtering algorithm. This data is then used to quantitatively characterize the capillary network of healthy and diseased eyes. We propose to use the fractal dimension as index for capillary integrity of pathologic disorders.
OCIS codes: (170.3880) Medical and biological imaging, (170.4500) Optical coherence tomography, (170.4470) Ophthalmology, (170.0110) Imaging systems, (170.6900) Three-dimensional microscopy, (170.6960) Tomography
1. Introduction
Spectral domain optical coherence tomography (SDOCT) offered for the first time comprehensive volumetric in-vivo imaging due to its achievable high acquisition speeds [1–4]. So far the most successful field of application is ophthalmology [5–7]. Here OCT profits from the transparent tissue of the eye and OCT’s unique possibility of acquiring 3D volumes of the cornea and retina. CMOS detector technology pushed the speed limit for spectrometer based SDOCT systems further up to reported 312.500 A-scans per second opening new directions for structural as well as functional imaging [8–10]. Such high imaging speed reduces motion artifacts to a minimum. That allows resolving microscopic structures, which otherwise would have been blurred. It was already shown with en-face time domain OCT that fast transverse scanning modes reveal microscopic details such as the photoreceptor cone mosaic of the human retina even in the absence of adaptive optics [11]. Of course the eccentricity at which individual photoreceptors are visible is larger than for adaptive optics supported OCT systems [12,13]. Nevertheless, it gives new exciting perspectives for studying retinal physiology on cellular level [14]. An important retinal microstructure for the early diagnosis of several retinal diseases, including diabetes, is the capillary network [15,16]. At an early stage such diseases manifest as changes of capillary physiology [17]. Changes may be occlusions, the complete degradation of parts of the capillary network, as well as neo-vascularization. Hence the visualization of this structure has great diagnostic potential. A natural candidate for extracting blood flow is Doppler OCT [18]. However the flat vascular bed, together with slow flow values leave this task challenging. Recent work showed that with the help of dedicated scanning protocols the sensitivity of those methods is strongly enhanced and capillary flow is accessible [19,20]. Nevertheless any Doppler method needs oversampling in order to keep proper signal correlations. Large volumes become therefore time consuming and are prone to motion artifacts. Another way to contrast the flow of the retinal capillary network, using a dual beam setup was presented by Makita et. al. [21–23]. However, even with alternative scanning protocols or sophisticated double beam configurations, highly phase sensitive flow extraction suffers from phase decorrelation below vessels that lead to axially extended Doppler shadows.
Figure 1 shows a data set, imaged with a 1050 nm swept source OCT system in our lab, operating at 100 kHz A-scan frequency. In this case the capillary network was extracted by calculating the phase variance of 9 successive B-scans. In Fig. 1(a) we present the maximum intensity projection of the inner retinal layers. On the right hand side in Fig. 1(b) a representative B-scan of the same phase variance volume is shown. One can already tell from the B-scan, that a 3D visualization of such a volume will suffer from shadowing artifacts, due to the decorrelation tails below each vessel. Hence, typically only en-face projections of the inner retinal layers are presented. This is especially disappointing, as the 3D information represents the major advantage compared to other imaging techniques such as scanning laser ophthalmoscopy or high resolution fundus fluorescence angiography [24,25]. These methods provide high resolution 2D fundus photographs and videos with high contrast of the smallest parafoveal capillaries. However, they do not provide depth information comparable to OCT. Axially oriented vessel structures are hardly observable in these data sets. Resolving such oriented vessels is important for a number of retinal diseases such as vessels breaking through the retinal pigment epithelium in age-related macular degeneration or capillaries growing down towards the photoreceptors in telangiectasia. We aimed for the extraction of capillary structure on a pure intensity basis. We demonstrate in the present work strategies for micro-vessel extraction as well as methods of analyzing and characterizing the integrity and structure of the retinal capillary network using fractal characterization. Those parameters are accessible through the introduction of our high-speed ultra-high resolution SDOCT system.
Fig. 1.
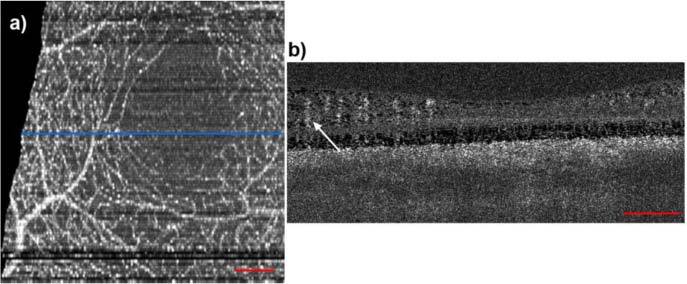
The human parafoveal capillary network, extracted using phase variance analysis with swept-source OCT at 1050 nm. (a) Fundus projection taken from the inner retinal layers. (b) Phase variance tomogram across the blue line in (a). The arrow indicates typical vessel shadow decorrelation artifacts. The red bars denote 200µm.
2. Methods
2.1. Experimental Setup
We implemented a high speed SDOCT system for retinal imaging with up to 128.000 A-scans / second. The central unit for achieving high acquisition speed is the CMOS camera in the spectrometer (Basler Sprint spL4096-140km). For all measurements presented in this paper we used an A-scan acquisition rate of 100 kHz. For this line rate the sensitivity close to the zero delay was 97 dB with depth decay of −9dB/2mm. As light source we used a Ti:Sapph laser (Integral, Femtolasers Produktions GmbH) with an almost Gaussian shaped spectrum centered at 800 nm and 165 nm FWHM yielding 1.7 µm axial resolution in air. The incident power on the cornea was adjusted to 610 µW, which is for this wavelength below the maximum exposure limit, given by laser safety standards. To support the full bandwidth of the laser, we designed a bulk optics Michelson interferometer. A scheme of the setup can be found in [9]. The sample arm contains a galvo x-y-scanning unit and a telescope to enlarge the diameter of the collimated beam, before it enters the eye. The reference arm contains prisms and a water chamber to match the dispersion of the sample arm. At a given wavelength the lateral resolution for retinal imaging is basically defined by the collimated beam size at the cornea and the dilatation of the iris. According to Gaussian optics we have in the diffraction limit the following relation between spot size σ and beam diameter d, σ = 4λf/(πd), where λ0 is the central wavelength of our system (λ0 = 800 nm), and f is the effective focal length of a standard eye. Assuming f = 24.46 mm we obtain the plot of Fig. 2 .
Fig. 2.
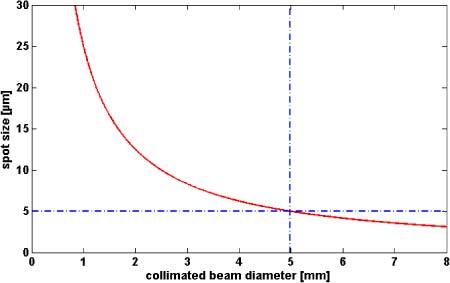
Diffraction limited spot size on the retina for central wave length λ0 = 800nm.
Even in the optimal case of diffraction limited imaging and full pupil size of 7 mm one would be limited to a lateral spot size of 3.6 µm. In practice it is not recommended to use the full aperture given by the dilated iris. As the diameter at the cornea increases, aberrations will become more prominent. Since we like to avoid the high complexity of adaptive optics we keep the diameter of the collimated beam in front of the cornea at 5 mm. This still yields a theoretic spot size of 5 µm, which is sufficient for imaging small retinal capillaries. In order to avoid vignetting of the probing beam by the pupil, the eyes were dilated using 0.2 mg tropicamide.
All presented in-vivo measurement adhered to the tenets of the Declaration of Helsinki and the ethics committee of the Medical University of Vienna.
2.2. Data Analysis
On the one hand, the visualization of microscopic retinal details needs a densely sampled volume. On the other hand we aim for small recording times in order to keep motion artifacts low. We decided for a 1000 x 200 pixel sampling laterally covering a patch in the central fovea of 1.5 mm x 1.5 mm taking into account slight under-sampling in the slow scanning direction (Fig. 3(a) ). The recording time for a full volume at 100.000 A-scans per second is 2 s. The short acquisition time reduces the influence of motion artifact. Combined with the high lateral resolution this enables resolving microscopic retinal detail, such as individual nerve fiber bundles which can be seen in the volume displayed in Fig. 3(a).
Fig. 3.
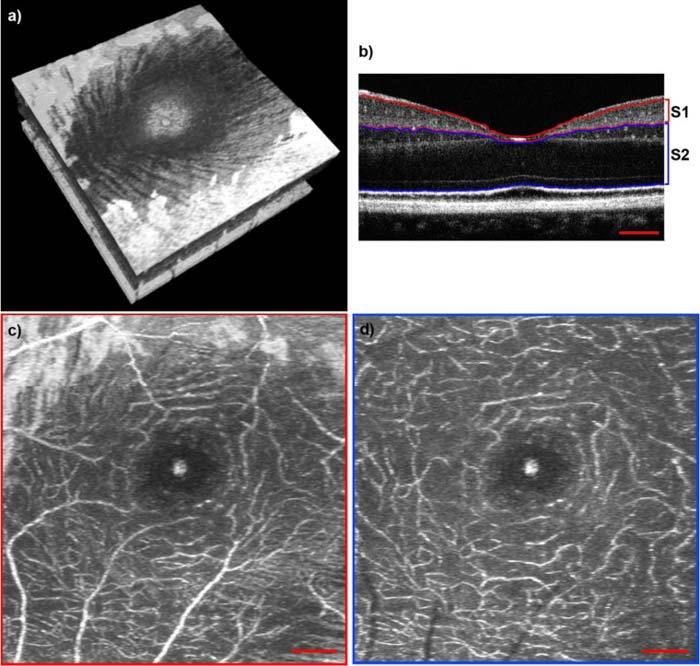
(a) Volume across the fovea (1.5 mm x 1.5 mm). Media 1 (4MB, MOV) shows a fly through this volume starting from the RNFL down to the choroid. (b) B-scan from the volume presented in (a) across the central fovea. Red lines indicate the segmentation of segment 1 (S1). Blue lines indicate the segmentation of segment 2 (S2). The corresponding video (Media 2 (4MB, MOV) ) shows a fly through in the same plane. (c) En-face projection of S1, indicated in (b). (d) En-face projection of S2, indicated in (b). Red scale bars denote 200 µm.
Typically one can separate three capillary vessel layers: the radial peripapillary capillaries in the retinal nerve fiber layer (RNFL), the inner layer capillaries in the ganglion cell layer (GCL), and the outer layer of capillaries of the inner nuclear layer (INL) [26]. In fact we observed that the third layer can be distinguished into another two sub layers: Those at the border of inner plexiform layer (IPL) and INL, and another network at the INL and outer plexiform layer (OPL) boundary. This can be well seen from the movie Media 2 (4MB, MOV) showing a tomogram series across the central fovea. In the following we will separately analyze the inner layer capillaries of the GCL and IPL (Segment 1), as well as the outer layer capillaries of the INL (Segment 2). Although we did not expect to see any capillaries below the OPL within healthy eyes, we chose to include the OPL, outer nuclear layer (ONL) and the external limiting membrane (ELM) down to the inner segment / outer segment (IS/OS) of the photoreceptors within segment 2, because the pathology of telangiectasia implies abnormal vessel growth from the INL down towards the photoreceptors. Figure 3(c) and (d) are en-face maximum intensity projections of segment 1 (Fig. 3(b) S1) as well as segment 2 (Fig. 3(b) S2) from a retinal 3D volume of a healthy subject. The segmentation of the retinal layers within the individual B-scans is done semi-automatically using a canny edge detection algorithm. The maximum intensity projections are obtained by displaying the maximum intensity along the depth axis at each transverse position. We will further on refer to those sections as segment 1 and segment 2 (S1, S2) respectively. The vascular structure is well resolved down to the smallest capillaries. Also the foveal avascular zone (FAZ) is clearly visible. To further illustrate the information, which is already given by pure intensity based high speed and ultra-high resolution SDOCT imaging, we included 2 videos. Media 1 (4MB, MOV) is showing a fly through starting from the retinal nerve fiber layer down to the choroid of the volume presented in Fig- 3(a). The distinct capillary networks are comprehensively visible, as the video passes the corresponding retinal layers. Media 2 (4MB, MOV) shows a fly through in the perpendicular direction, i.e. the B-scan series as it has been captured. One can clearly see the small capillaries, especially at the borders of the INL as well as in some slices the capillaries connecting the layers in between.
As a ground truth for our filtering method, an expert viewer annotated the complete capillary network of two 3D data sets; one of a healthy volunteer and one of a patient suffering from telangiectasia. This was done by marking the vessels with in each individual B-scan, as well as each individual en-face slice of a complete volume. Such an annotation for a healthy eye can be seen in Fig. 4 . Figure 4(a) exhibits the complete capillary network surrounding the fovea. In Fig. 4(b) an overlay of the annotation with the intensity volume can be seen. The retinal nerve fiber layer was removed in order to reveal the underlying capillary network. Figure 4(c) shows the multiplication of the annotation with the inner retinal layers of the intensity volume. We also provide a movie of Fig. 4(c) (Media 3 (2.5MB, MOV) ), because the full 3D information becomes even more vivid when the volume is moving.
Fig. 4.
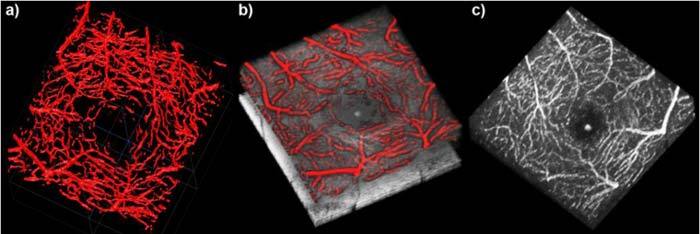
Annotation of the foveal capillary network of a healthy eye. (a) 3D view of the segmented capillary network. (b) Overlay of the annotation and the OCT intensity volume without the retinal nerve fiber layer. (c) Multiplication of the annotation with the inner retinal layers of the intensity volume (Media 3 (2.5MB, MOV) ).
It is a characteristic feature of inner retinal structures that the blood within vessels exhibits higher scattering than the surrounding tissue as seen from Fig. 3(b-d). Hence intensity thresholding does already improve the visibility and contrast of vascular structure against surrounding tissue. Of course this simple method has its limitations, as in particular in the plexiform layers the contrast is not as good as in the INL. In other samples, as e.g. the skin, the contrast between the capillaries and the surrounding tissue is much smaller and such method would not be applicable.
An improved approach segmenting the parafoveal capillary network is to combine intensity thresholding with a fast Fourier transform (FFT) band pass filter. By Gaussian filtering in the Fourier space, it filters out large structures down to a certain threshold as well as small structures up to a second threshold. This will suppress background intensities that exhibit only gross structures and noise. We applied this filter to maximum intensity projections of S1 and S2. The thresholds were empirically set to filter large structures down to 15 pixels and small structures up to 2 pixels. As these thresholds produced similar results for pathological and healthy eyes, the same thresholds were used for all data sets presented in this paper. The result is shown in Fig. 5 for the same data set as presented in Fig. 3. Figure 5(a) shows the maximum intensity projection of the segmented INL. In Fig. 5(b) the result of the FFT band pass filter is displayed. One can clearly observe that the signal from the surrounding tissue was removed and only the capillary network remains. In the center of the maximum intensity projection the central foveal reflex is visible. It is also visible within the filter result, as it has not been removed by the FFT band pass filter. Having segmented the capillaries we obtain the vessel center-lines by transforming the filter result to a binary image before skeletonizing the capillary network as displayed in Fig. 5(c). By skeletonizing the boundary pixels of the capillaries within the binary image are removed until each capillary consists of a single line, but does not break apart. To perform this operation we used the Matlab function bwmorph, which uses an algorithm described by W. K. Pratt [27]. Figure 5(d) shows the segmented manual annotation of the capillary network of the same INL. The maximum intensity projection of the annotation is displayed in Fig. 5(e). This maximum intensity projection has been transformed to a binary image as well before we skeletonized the capillary network, in order to retrieve the vessel center lines as shown in Fig. 5(f). To demonstrate the quality of the filter result, we created an overlay of the filter vessel center lines with the maximum intensity projection of Fig. 5(a). Figure 5(g) shows it for the FFT band pass filter result, whereas Fig. 5(h) shows it for the expert annotation result. To better compare the two, we furthermore created an overlay of the maximum intensity projection of Fig. 5(a), the filter result (green lines) and the annotation result (red lines) (Fig. 5(i)). The lines in this image do in some cases not perfectly match each other. This is due to an imperfect annotation. As some capillaries only contain several pixels, it is not possible to mark the vessels exact down to a single pixel. Apart from this artifact we obtain excellent agreement between the annotation and the filter result. It fails in cases of large back-ground signals as well in case of blood leakage (Fig. 5(j) red arrow). The corresponding fundus fluorescence angiography indicating areas of leakage is shown in Fig. 7(b) below. Figure 5(j-l) show the maximum intensity projection of S2 (Fig. 5(j)), the FFT band pass filter result (Fig. 5(k)) and the skeleton of Fig. 5(k) for a data set of a diseased eye suffering from telangiectasia. The extracted vessel architecture is now the perfect starting point for analysis of its integrity and structure.
Fig. 5.
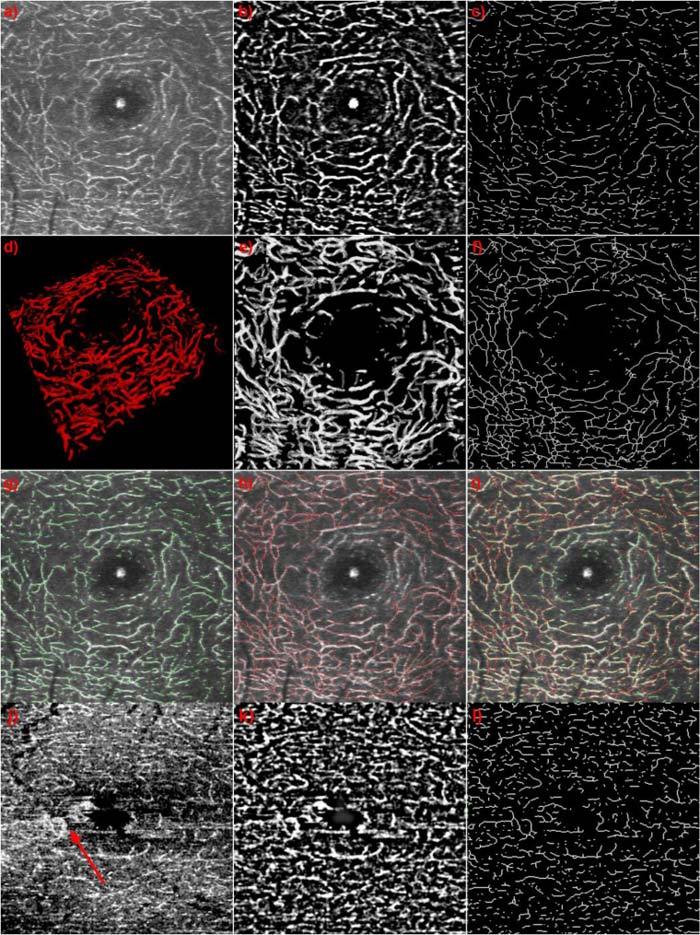
(a) Maximum intensity projection of the INL; (b) Result of band pass filtering (a). (c) Skeleton of (b). (d) 3D view of the annotation of the INL capillaries of the same data set. (e) Maximum intensity projection of (d). (f) Skeleton of (e). (g) Overlay of (a) and (c). (h) Overlay of (a) and (f). (i) Overlay of (a), (c) and (f). (j) maximum intensity projection of S2 of a diseased eye suffering from telangiectasia. (k) Result of band pass filtering (j). (l) Skeleton of (j). Red arrow indicates area of leakage.
Fig. 7.
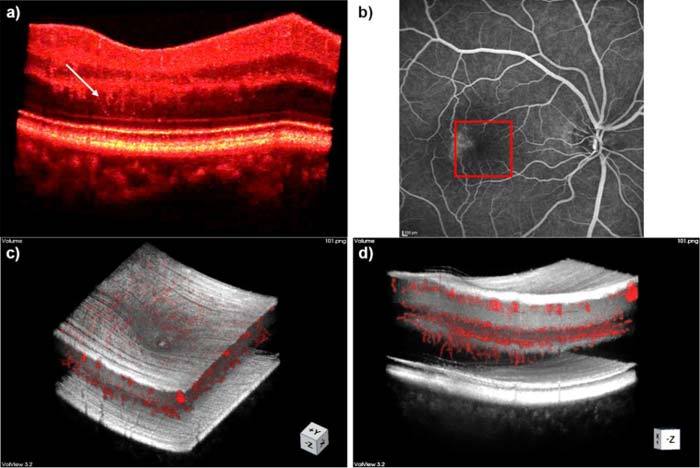
Atypical vessel growth in telangiectasia.; (a) Intensity volume, white arrow points to capillaries growing towards photoreceptors; (b) Fundus fluorescein angiogram, square indicates section imaged with OCT. (c) Overlay of intensity volume and annotation; (d) Overlay of intensity volume and annotation showing capillaries growing towards photoreceptors.
The index that we choose for this characterization is the fractal dimension (FD) of the vessel lines. The fractal dimension has been used before to characterize 3D tumor vessel growth [28]. We intent to use this index as early indicator of vascular growth disorder. We expect a decrease of this index in case of pathologic vessel deformation, or capillary degradation due to vessel occlusion. There are different methods to determine the FD. We choose the box count method, which is easy to implement [29,30]. It is based on calculating the number of vessel pixels that are covered after tiling the image area in boxes of different sizes (Fig. 6(b) ). The FD is given by determining a plateau of the local slope in the ln N versus ln s plot, where s is the size of the box, and N is the number of boxes that cover the vessels (Fig. 6(a)).
Fig. 6.
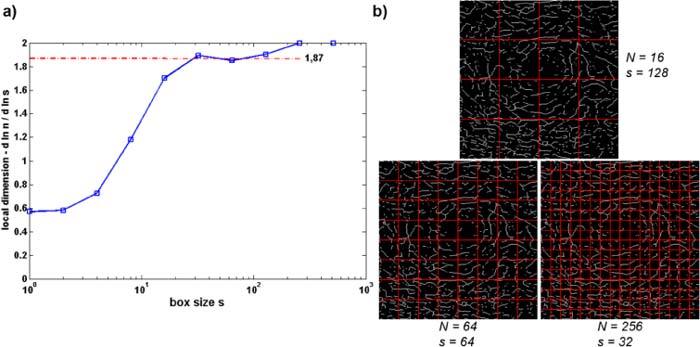
Demonstration of box count method for determination of fractal dimension (following [29,30]).
3. Results and Discussion
We obtained densely sampled high resolution foveal volume scans from two healthy volunteers as well as from two patients suffering from early stage telangiectasia. Matching the pathology of telangiectasia, we were with our ultra-high resolution and high speed system for the first time able to resolve capillaries growing from the INL, through the OPL and ONL, down towards the photoreceptors. These capillaries can already be observed within the intensity volume rendering without any filtering (Fig. 7(a)) and are even better visible within the overlay of the expert annotation with the intensity volume (Fig. 7(c and d)). We found that the area of the abnormal vessel growth corresponds to areas in the fundus fluorescence angiography, where leakages are clearly visible (Fig. 7(b)).
In general the FD can be calculated for the total measured 3D volume. Having the annotation of two complete capillary networks at hand, we calculated this parameter for one healthy eye, as well as for one eye suffering from telangiectasia. We obtained a fractal dimension of 2.35 for the healthy retina and 2.33 for the diseased retina. The value for the diseased eye is only slightly smaller. However, a more extensive study including multiple healthy as well as diseased eyes is needed to make a statistically significant statement.
The fractal volume analysis gives a gross overview about the entire parafoveal capillary network. If one investigates the capillary network of the diseased eyes, one observes pathologic changes especially in the second segment S2. We therefore chose to concentrate the analysis on the separate segments, using the previously described skeletonized capillary network projections. Figure 8 compares the FD of the two healthy and two diseased retinas for segments 2 (cf. Figure 3(b)) showing larger values for the healthy layers as compared to the diseased ones.
Fig. 8.
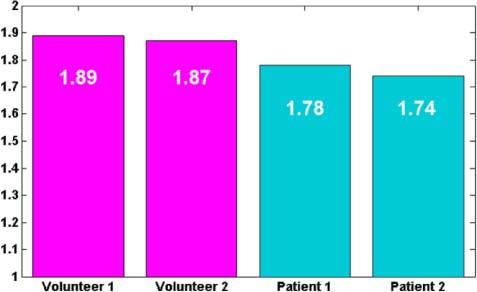
Fractal Dimension for segments of 2 healthy subjects and two patients suffering from telangiectasia.
Of course the results based on the fractal dimension show only a tendency that needs to be further investigated based on a larger number of patient data. It will be of main interest in further experiments how sensitive the index is to early small changes in the capillary structure. Nevertheless, the fact that we have now access to those structures with our high speed and ultra-high resolution retinal tomography system opens new perspectives in retinal diagnosis.
4. Conclusion
We introduced a high speed high resolution SDOCT system that allows to image comprehensive micro-structural details of the human retina in-vivo. The short imaging times at 100 kHz yield virtually motion - artifact free images of the capillary network. We present a method to extract the capillaries of different retinal structures on a pure intensity basis, thus keeping imaging times short. Also typical longitudinal artifacts of highly phase sensitive systems that obscure important axial vessel structures are avoided. We analyzed the extracted capillary bed with respect to its integrity and structure using fractal characterization as parameter. We believe that the present results open new perspectives for the early diagnosis of retinal as well as systemic pathologies.
Acknowledgments
Light source support from Femtolasers Produktions GmbH, equipment support from Prof. Theo Lasser, and funding from the European FP7 HEALTH program, grant 201880, FUN OCT are acknowledged.
References and links
- 1.Fercher A. F., Hitzenberger C. K., Kamp G., Elzaiat S. Y., “Measurement of intraocular distances by backscattering spectral interferometry,” Opt. Commun. 117(1-2), 43–48 (1995). 10.1016/0030-4018(95)00119-S [DOI] [Google Scholar]
- 2.Leitgeb R., Hitzenberger C. K., Fercher A. F., “Performance of Fourier domain vs. time domain optical coherence tomography,” Opt. Express 11(8), 889–894 (2003). 10.1364/OE.11.000889 [DOI] [PubMed] [Google Scholar]
- 3.de Boer J. F., Cense B., Park B. H., Pierce M. C., Tearney G. J., Bouma B. E., “Improved signal-to-noise ratio in spectral-domain compared with time-domain optical coherence tomography,” Opt. Lett. 28(21), 2067–2069 (2003). 10.1364/OL.28.002067 [DOI] [PubMed] [Google Scholar]
- 4.Wojtkowski M., Bajraszewski T., Targowski P., Kowalczyk A., “Real-time in vivo imaging by high-speed spectral optical coherence tomography,” Opt. Lett. 28(19), 1745–1747 (2003). 10.1364/OL.28.001745 [DOI] [PubMed] [Google Scholar]
- 5.Drexler W., Morgner U., Ghanta R. K., Kärtner F. X., Schuman J. S., Fujimoto J. G., “Ultrahigh-resolution ophthalmic optical coherence tomography,” Nat. Med. 7(4), 502–507 (2001). 10.1038/86589 [DOI] [PMC free article] [PubMed] [Google Scholar]
- 6.Schmidt-Erfurth U., Leitgeb R. A., Michels S., Povazay B., Sacu S., Hermann B., Ahlers C., Sattmann H., Scholda C., Fercher A. F., Drexler W., “Three-dimensional ultrahigh-resolution optical coherence tomography of macular diseases,” Invest. Ophthalmol. Vis. Sci. 46(9), 3393–3402 (2005). 10.1167/iovs.05-0370 [DOI] [PubMed] [Google Scholar]
- 7.W. Drexler and J. G. Fujimoto, Optical Coherence Tomography: Technology and Applications (Springer, Berlin, 2008). [Google Scholar]
- 8.Potsaid B., Gorczynska I., Srinivasan V. J., Chen Y., Jiang J., Cable A., Fujimoto J. G., “Ultrahigh speed spectral / Fourier domain OCT ophthalmic imaging at 70,000 to 312,500 axial scans per second,” Opt. Express 16(19), 15149–15169 (2008). 10.1364/OE.16.015149 [DOI] [PMC free article] [PubMed] [Google Scholar]
- 9.Schmoll T., Kolbitsch C., Leitgeb R. A., “Ultra-high-speed volumetric tomography of human retinal blood flow,” Opt. Express 17(5), 4166–4176 (2009). 10.1364/OE.17.004166 [DOI] [PubMed] [Google Scholar]
- 10.Grulkowski I., Gora M., Szkulmowski M., Gorczynska I., Szlag D., Marcos S., Kowalczyk A., Wojtkowski M., “Anterior segment imaging with Spectral OCT system using a high-speed CMOS camera,” Opt. Express 17(6), 4842–4858 (2009). 10.1364/OE.17.004842 [DOI] [PubMed] [Google Scholar]
- 11.Pircher M., Baumann B., Götzinger E., Hitzenberger C. K., “Retinal cone mosaic imaged with transverse scanning optical coherence tomography,” Opt. Lett. 31(12), 1821–1823 (2006). 10.1364/OL.31.001821 [DOI] [PMC free article] [PubMed] [Google Scholar]
- 12.Drexler W., “Cellular and functional optical coherence tomography of the human retina: the Cogan lecture,” Invest. Ophthalmol. Vis. Sci. 48(12), 5340–5351 (2007). 10.1167/iovs.07-0895 [DOI] [PubMed] [Google Scholar]
- 13.Zawadzki R. J., Choi S. S., Jones S. M., Oliver S. S., Werner J. S., “Adaptive optics-optical coherence tomography: optimizing visualization of microscopic retinal structures in three dimensions,” J. Opt. Soc. Am. A 24(5), 1373–1383 (2007). 10.1364/JOSAA.24.001373 [DOI] [PMC free article] [PubMed] [Google Scholar]
- 14.Schmoll T., Kolbitsch C., Leitgeb R. A., “In vivo functional retinal optical coherence tomography,” J. Biomed. Opt. 15(4), 041513 (2010). 10.1117/1.3463008 [DOI] [PubMed] [Google Scholar]
- 15.Arend O., Wolf S., Jung F., Bertram B., Pöstgens H., Toonen H., Reim M., “Retinal microcirculation in patients with diabetes mellitus: dynamic and morphological analysis of perifoveal capillary network,” Br. J. Ophthalmol. 75(9), 514–518 (1991). 10.1136/bjo.75.9.514 [DOI] [PMC free article] [PubMed] [Google Scholar]
- 16.van Leiden H. A., Dekker J. M., Moll A. C., Nijpels G., Heine R. J., Bouter L. M., Stehouwer C. D. A., Polak B. C. P., “Risk factors for incident retinopathy in a diabetic and nondiabetic population: the Hoorn study,” Arch. Ophthalmol. 121(2), 245–251 (2003). [DOI] [PubMed] [Google Scholar]
- 17.Manschot W. A., “Retinal vascular obstruction,” Doc. Ophthalmol. 40(2), 383–389 (1976). 10.1007/BF00155048 [DOI] [PubMed] [Google Scholar]
- 18.Leitgeb R. A., Schmetterer L., Drexler W., Fercher A. F., Zawadzki R. J., Bajraszewski T., “Real-time assessment of retinal blood flow with ultrafast acquisition by color Doppler Fourier domain optical coherence tomography,” Opt. Express 11(23), 3116–3121 (2003). 10.1364/OE.11.003116 [DOI] [PubMed] [Google Scholar]
- 19.Grulkowski I., Gorczynska I., Szkulmowski M., Szlag D., Szkulmowska A., Leitgeb R. A., Kowalczyk A., Wojtkowski M., “Scanning protocols dedicated to smart velocity ranging in spectral OCT,” Opt. Express 17(26), 23736–23754 (2009). 10.1364/OE.17.023736 [DOI] [PubMed] [Google Scholar]
- 20.Wang R. K., An L., Francis P., Wilson D. J., “Depth-resolved imaging of capillary networks in retina and choroid using ultrahigh sensitive optical microangiography,” Opt. Lett. 35(9), 1467–1469 (2010). 10.1364/OL.35.001467 [DOI] [PMC free article] [PubMed] [Google Scholar]
- 21.Makita S., Yamanari M., Yasuno Y., “High-speed and high-sensitive optical coherence angiography,” Proc. SPIE 7372, 73721M–, 73721M-6. (2009). 10.1117/12.831867 [DOI] [Google Scholar]
- 22.Makita S., Jaillon F., Yamanari M., Miura M., Yasuno Y., “Comprehensive in vivo micro-vascular imaging of the human eye by dual-beam-scan Doppler optical coherence angiography,” Opt. Express 19(2), 1271–1283 (2011). 10.1364/OE.19.001271 [DOI] [PubMed] [Google Scholar]
- 23.Zotter S., Pircher M., Torzicky T., Bonesi M., Götzinger E., Leitgeb R. A., Hitzenberger C. K., “Visualization of microvasculature by dual-beam phase-resolved Doppler optical coherence tomography,” Opt. Express 19(2), 1217–1227 (2011). 10.1364/OE.19.001217 [DOI] [PMC free article] [PubMed] [Google Scholar]
- 24.Tam J., Martin J. A., Roorda A., “Noninvasive visualization and analysis of parafoveal capillaries in humans,” Invest. Ophthalmol. Vis. Sci. 51(3), 1691–1698 (2010). 10.1167/iovs.09-4483 [DOI] [PMC free article] [PubMed] [Google Scholar]
- 25.Mendis K. R., Balaratnasingam C., Yu P., Barry C. J., McAllister I. L., Cringle S. J., Yu D. Y., “Correlation of histologic and clinical images to determine the diagnostic value of fluorescein angiography for studying retinal capillary detail,” Invest. Ophthalmol. Vis. Sci. 51(11), 5864–5869 (2010). 10.1167/iovs.10-5333 [DOI] [PubMed] [Google Scholar]
- 26.R. E. Records, Physiology of the Human Eye and Visual System (Harper & Row, Hagerstown, Md., 1979). [Google Scholar]
- 27.W. K. Pratt, Digital Image Processing (Wiley, New York, 1991). [Google Scholar]
- 28.Vakoc B. J., Lanning R. M., Tyrrell J. A., Padera T. P., Bartlett L. A., Stylianopoulos T., Munn L. L., Tearney G. J., Fukumura D., Jain R. K., Bouma B. E., “Three-dimensional microscopy of the tumor microenvironment in vivo using optical frequency domain imaging,” Nat. Med. 15(10), 1219–1223 (2009). 10.1038/nm.1971 [DOI] [PMC free article] [PubMed] [Google Scholar]
- 29.Baish J. W., Jain R. K., “Fractals and cancer,” Cancer Res. 60(14), 3683–3688 (2000). [PubMed] [Google Scholar]
- 30.F. Moisy, “Boxcount” (Matlab Central, 2006), http://www.mathworks.com/matlabcentral/fileexchange/13063-boxcount


