Abstract
Optical coherence tomography (OCT) systems are becoming more commonly used in biomedical imaging and, to enable continued uptake, a reliable method of characterizing their performance and validating their operation is required. This paper outlines the use of femtosecond laser subsurface micro-inscription techniques to fabricate an OCT test artifact for validating the resolution performance of a commercial OCT system. The key advantage of this approach is that by utilizing the nonlinear absorption a three dimensional grid of highly localized point and line defects can be written in clear fused silica substrates.
OCIS codes: (110.4500) Optical coherence tomography; (000.2700) Instruments, apparatus, and components common to the sciences
1. Introduction
Optical coherence tomography (OCT) is a technology that has gained acceptance as a non-invasive method for characterizing soft tissue and other turbid media [1]. It has widely been explored for use as a diagnostic tool in clinical medicine, with commercial devices now available in ophthalmology [2], dermatology [3] and interventional cardiology [4]. As OCT is increasingly translated to end-users, there is a growing requirement for robust test and characterization methods, suitable for deployment with commercial instruments and use by non-experts users. Moreover, European regulations for medical devices are quality system based [5]. Hence, established calibration methods for key instrument parameters can ease the regulatory process [6]. This approach has previously been observed in now established fields of medical imaging [7] and is expected to be an important for the widespread adoption of OCT for routine procedures.
A review of the types of artifacts used to date for characterizing and standardizing optical imaging instruments is given by Pogue et al. [8]. A conventional metric for OCT characterization is the resolution, often defined as the full-width at half-maximum (FWHM) of the system point-spread function (PSF) in axial and lateral dimensions [9]. Murali et al. [10] have disputed this definition, showing that it is insensitive to optical aberrations incurred in high numerical aperture OCT. Detailed measurements of OCT PSFs have previously been obtained by imaging scattering medium [11], nano-shells suspended in an aqua solution [7,12] and particles dispersed within a transparent matrix [1,9]. This last method has been demonstrated in both Fourier [13] and time domain [7] OCT. Both Ralston [14] and Woolliams et al. [15] have then used these measurements to remove the influence of the instrument function from OCT B-scan images.
The formation of PSF artifacts or phantoms by mixing sub-micrometer particles into a matrix material presents a number of challenges. Firstly, small particles have a low back-scattering cross-section and consequently can manifest as a barely detectable signal in the OCT image. Furthermore, prevention of particle clumping is essential for valid PSF measurements. Processing of the data is complicated by random particle placement associated with the mixing process. Whilst these particle based phantoms have proved to be a useful tool for OCT characterization a new approach is required for them to be more amenable to users and suppliers of OCT equipment. An optimal design would precisely position PSF targets in predetermined locations within the artifacts.
In this article, we present a PSF artifact produced using femtosecond optical pulses to introduce micron scale defects within a polished fused silica substrate. This manufacturing process provides the necessary control to accurately position the defect position. Furthermore, this method may be fully automated to produce repeatable artifacts.
Femtosecond laser machining and inscription of transparent and other media is well established and has been used to write waveguide and grating structures in silica as well as for the production of complex structures and parallel sided hole drilling [16–19]. The primary advantage of femtosecond lasers is the ability to interact with materials only at the focal point of the laser beam. The material-pulse interaction has an energy threshold originating from non-linear absorption in the material, leading to a range of physical mechanisms such as ionization. This enables transparent materials like silica to be micromachined. Hence, the purpose of this study was to evaluate femtosecond inscription as a candidate technology for producing OCT resolution artifacts.
2. Materials and Methods
A J-Series Femtosecond machining system built by Oxford Lasers Ltd, UK was used to write the PSF targets into a 30x25x2 mm pure silica substrate (Ibsen Photonics, Denmark). The substrate was held on a computer controlled multi-axis translation stage for laser writing. The laser inside the system was an s-pulse HP laser (Amplitude Systems, France) capable of producing sub 450 fs pulses at a wavelength of 1026 nm. The inscription lens was a Mitutoyo M Plan Apo NIR x100 lens having a numerical aperture of 0.50 and focal length f = 2 mm yielding a Rayleigh criterion focused spot size of ~2.5 µm.
The PSF artifact structure comprised a series of lines, written at different pulse energies as shown in Fig. 1 . Lines of continuous refractive index change were written by translating the sample at a constant speed of 1mm/s with a pulse repetition rate of 100 kHz. Under these conditions, individually inscribed point defects overlap to form a continuous line. The line pitch was set to 75 μm for both perpendicular axes, with the first line written at a depth of 75 μm from silica surface. The maximum laser power at the objective lens was 4.1 W (i.e. 41μJ per pulse and a peak pulse power of ~0.1GW). The inscription energy was set as a percentage of the maximum. The percentages chosen were 100, 80, 60, 40, 20, 10, 5, 2.5, 1, 0.5 and 0.25% of the maximum laser energy giving a range of energies from 41 to 0.1025 µJ. Lines were written in pairs at each energy level, with 100% lines written to facilitate location in microscope and OCT images.
Fig. 1.
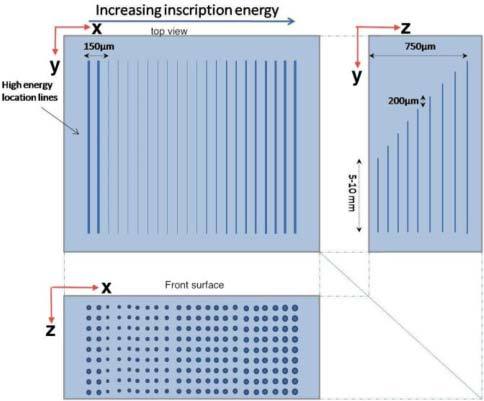
A schematic of the femtosecond inscribed OCT calibration artifact showing the paired lines of varying power increasing from left to right after initial location lines.
The artifact was first evaluated using an optical microscope (Axioskop 2, Carl Zeiss, Germany) and the size of the defects estimated for each of the power settings and the different depths by measuring the inscribed line widths. A 20x magnification imaging lens (Plan Neofluar 20x/0.50) was used to acquire microscope images of the sample. The artifact was also imaged using an OCT instrument (EX1301, Michelson Diagnostics, UK). This swept-source OCT system operates at a central wavelength of 1305 nm and has previously been measured to have a lateral resolution (FWHM) of 8.4 μm and axial resolution (FWHM) of 10.9 μm [9]. This instrument comprises four interferometric channels focused at different depths to obtain an extended depth of field. However, in the present analysis only results from a single channel are presented. To obtain an oversampled estimate of the average OCT response to each detected point, 40 B-scans were combined. This averaging also smooths out any granularity in the inscribed line. Corresponding points in each B-scan were aligned from the peak location of a two-dimension Gaussian fit to the raw linear intensity data. The oversampled data was interpolated onto a regular grid for visualization. Specular back-reflection from the artifact surface was avoided by mounting the sample with a 3.0 degree tilt relative to the incident OCT beam.
Following OCT analysis, the artifact was cleaved along the OCT B-scan plane and etched in hydrofluoric acid (40% initial concentration diluted 20:1 with distilled water) for 20 minutes. One half of the etched artifact was imaged with a confocal microscope (LEXT, Olympus)
3. Results
The effect of varying the laser power on the width of the target line can be clearly seen in Fig. 2a . Three pairs of lines are shown, in which the feature width broadens with increasing inscription power. The degree of broadening was determined using quantitative phase microscopy (QPm), from which the inscription was identified as a distinct phase modulation, demonstrated in Fig. 2b.
Fig. 2.
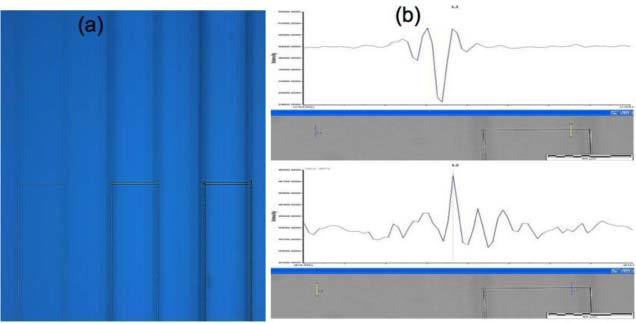
a) Microscope image of three pairs of lines showing a variation in the feature width with varying inscription power b) QPm measurements of two lines showing the contrast between above material threshold void creation (above) and below material threshold index change. The yellow line in the grey image marks the measurement area for relative phase plot.
Figure 3 shows the average widths of the lines in the upper layer as a function of laser power. Along any given line 6 measurements were taken and then averaged. The measured defects range from 0.5 to 7.6 μm in width, corresponding with power levels of 5–100%. The lines written at a power of <5% were found to be too close to the resolution of the microscope for accurate assessment of their size.
Fig. 3.
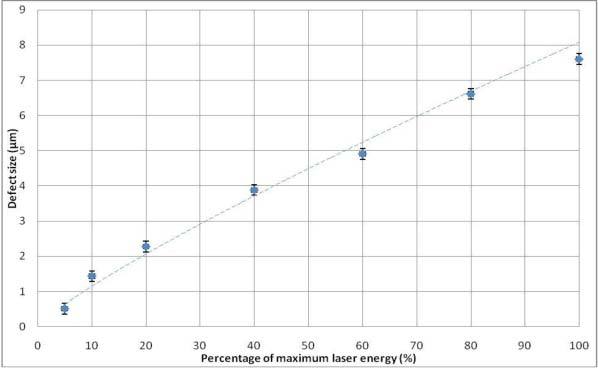
Variation of measured apparent defect size with laser power setting used taken at a depth 75 µm from the surface, as measured using an optical microscope.
Figure 4 shows the OCT cross-section of the sample on a linear intensity scale. The strongest lines are at the far edges with the inscription power decreasing from the left hand side (columns 1–20). Columns 21 and 22 (far right) represent lines written at 100% power for identification. The focus of the OCT instrument corresponds approximately with lines written in row 2, where point visibility just extends to column 16, or 2.5% power.
Fig. 4.
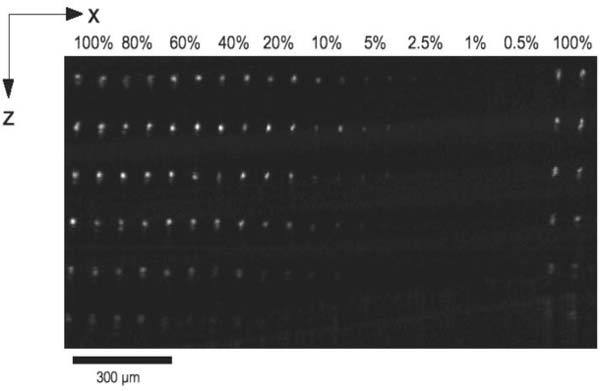
OCT cross-section of engraved sample, scaled in logarithmic intensity. Lateral and axial dimensions are denoted x and z respectively. Femtosecond inscription is denoted by the bright points. Rows and columns were written at 75μm intervals. At each depth, pairs of lines were written at laser powers varying from 0.5 to 100%. The OCT image has not been corrected for the silica substrate refractive index.
The axial and lateral resolution was estimated from the FWHM of a two-dimensional Gaussian function fitted to each detected point in the OCT data. The results of these, averaged over 40 sequential B-scan slices, are shown in Fig. 5 at depth of 75 μm. The measured axial FWHM is plotted as a function of inscription power and for different line depths of 75 μm, corresponding with rows 1-6 respectively. At different depths similar trends were observed.
Fig. 5.
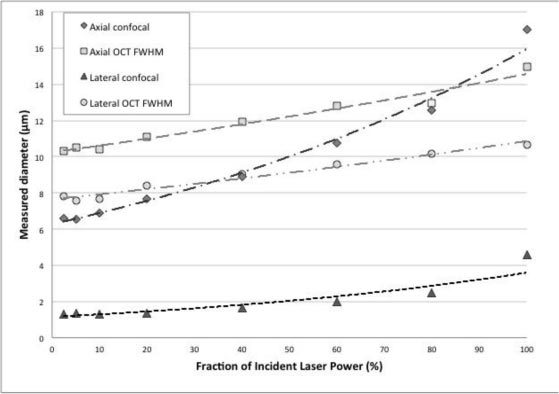
Plot of FWHM of axial PSF measured from laser inscribed artifact written at powers of 2.5, 5, 10, 20, 40, 60,80 and 100% of the maximum laser power and at a depth of 75 μm.
Figure 5 also shows axial and lateral measurements taken using a confocal microscope of the lines from the end face (etched surface) of the sample. The lateral diameters here are smaller than shown in Fig. 3, this is probably due to the higher contrast ratio of the etched sample making it easier to focus on the defect.
Oversampled plots of the PSF at different positions in the B-scan plane are shown in color in Fig. 6 , showing the clear trend in the shape as the inscription pulse energy is reduced. There is also a notable change in the OCT measurement for points at different depths. The 10% laser power gives noticeable smaller features than the 100% laser power.
Fig. 6.
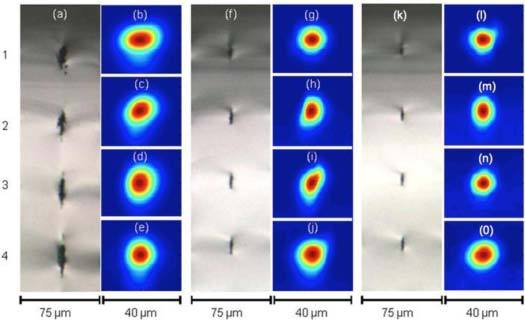
Confocal microscope images (a, f and k) of the cleaved, etched artifact with corresponding OCT PSFs (b-e, g-j and l-o) shown on a intensity linear scale. Images a-e correspond to 100% power, f-j to 20% power and k-o 10% power. Rows 1-4 correspond to depths of 75, 150, 225 and 300 μm from the artifact surface. It should be noted that the full scale for the confocal microscope images is 75 μm but only 40 μm for the OCT measurements.
For 2.5% laser power it was not possible to measure the feature with the OCT system. However, the images in Fig. 7 shows the presence of an inscribed feature at the 2.5% power level for depths between 75 and 300 μm.
Fig. 7.

Confocal microscope images of the cleaved and etched cross-section of lines written at 2.5% power. Images a-d correspond with depths from the artifact surface of 75, 150, 225 and 300 μm respectively.
3. Discussion
The femtosecond inscription mechanism results in highly spatially localized index changes relative to the substrate material. In fused silica this is believed to be due to a resultant material density or chemical change leading to a change in the refractive index. The nature of the pulse-material interaction leads to a resultant variation in the dimensions and appearance of the spot as the thresholds for inscription and ablation with the resultant void creation are exceeded. The elongated elliptical shape shown in the higher intensity artifact lines is characteristic of a focused beams’ incident intensity profile where the minimum threshold value is taken to be that of the material threshold. Above this threshold the material in plasma state undergoes rarefaction and subsequent densification during thermal cooling leading to the index change or void creation. The apparent increase in complexity of the structure is a feature of the spatial intensity variation and subsequent nonlinear absorption at and around the focus at higher incident intensities. At lower incident intensities the profile of the energy distribution above threshold is more localized and results in a more spherical cross-section of index change profile. For this work small voids, below or close to the resolution of the system, were required so the determination of the inscription threshold for the laser system was crucial.
The initial samples written consist of a regular series of line defects written by translating the sample through the focus of the laser beam. The individual defects overlap to produce a long line defect. At a constant repetition rate of 100 kHz, different pulse energies and depths were used to see the effect on the defects and their visibility to the OCT. A grid of lines was written where the vertical rows of the sample had varying pulse energies, this allowed the variation of energy and depth to be examined. At one end of the lines the finish points were staggered to allow the lower levels to be imaged with the OCT and microscope without optical aberrations from other levels being introduced when viewed from above. The deepest lines were written first so that during the inscription the laser pulses were not affected by passing through previously written structures.
The use of femtosecond inscription theoretically allows a calibration artifact to be designed to test the resolution of OCT systems from a single B-scan. This can be achieved by inscribing lines perpendicular to the scan planes, creating point like refractive index variations in each 2D B-scan. However, the nature of the femtosecond writing process results in a slight granularity of the lines in terms of the refractive index change. When examined using the OCT this results in a variation in the brightness of response from each line in subsequent B-scan resulting in a ‘flicker’ when consecutive slices are observed. For the lowest energy inscriptions, the fine intensity threshold dependence for significant index change means that some lines are only visible in a fraction of the B-scans. Hence there is a need to acquire several dozen B-scans to enable accurate results. Although this refractive index variation currently means that a single B-scan may not yield a complete picture of the OCT resolution it indicates the potential for the use of the inscription technique and ability through multiple scans for it to acquire the information required. In addition, the controllable relative positioning of the refractive index features, and subsequent scattering features, also may be used to help calibrate the axial scaling of the resulting OCT images and B-scan field of view distortion. This is important when OCT images are going to be used for the measurement and subsequent monitoring of possible disease processes.
The OCT instrument pixel size used for this study corresponded to 4.15 μm laterally and 3.92 μm axially (assuming a silica medium at 1300 nm or 5.6 μm axially in air). In prior studies the theoretical axial resolution (FWHM of the intensity) of this instrument (processed with a Hann window) was found to be 10.9 μm and the lateral was 8.2 μm [9]. Figure 5 shows the dimensions of the smallest lines to be 1.28 μm (lateral) and 6.6 μm (axial). Since this is below the resolution of the OCT system the points appear to be spherical in Fig. 6. A key challenge is to reliably reduce the feature size in the axial direction so that it is closer to those shown in Fig. 7. This will allow artifacts to be made that can be used to calibrate systems on the 1-2 μm scale.
The axial size of the points was found to vary significantly with the power setting as would be expected from the microscope images. There was also considerable spread in size, due to the variability in the appearance of the defects. Estimating the PSF of larger defects, written with higher power, was unreliable due to the speckle (the secondary features that can be seen on the high power points shown in Fig. 4). This speckle make the PSF fitting unreliable and can be explained by the formation of micro-cracks, voids or additional stress in the material caused by the higher power exposure.
In order to estimate the instrument PSF from the data a subsection of the data containing only the weakest points was taken. For each B-scan the points were located in the image using a threshold filter then a Gaussian fit was applied through the middle of each point in the axial and lateral directions. The goodness-of-fit was calculated, and if found to be less than 0.95 (normalized to 1) then the point was rejected, this helped reject false points caused by image artifacts and gave more robust results.
No defects were reliably visible using the OCT system for powers <5%, suggesting that the resultant refractive index induced by inscription is smaller than the OCT can observe and / or that the energy threshold for index has not been met for the smallest intensity levels. The small size of the inscribed feature leads to an extremely small fraction of the light being backscattered into the OCT instrument requiring the use of highly sensitive instrumentation. The size of the artifacts, measured using a microscope, compare well to the theoretical ideal for the creation of a direct OCT PSF measurement. This is because it is significantly smaller than the resolution of the instrumentation and thus approximates to a delta function in the convolution of the object and instrument PSF that forms the final image [20]. The nature of the inscription approximating to a cylindrical line at these low inscription energies means that this can give yield a measure of OCT point spread function in two orthogonal directions.
The weakest points, corresponding to the top 4 layers and the power settings 5% and 10% were looked at in detail. At power levels of 20% and above, axial bifurcation of the points was observed in individual OCT B-scans. However, when multiple OCT images of a single point were combined, the bifurcation ceased and its place and axial tail was evident, as shown clear seen in Figs. 6b-e and g-j. The effect of averaging indicates that the bifurcation effect is possibly due to interference between light reflected from the top and bottom of the defects that exhibit a noticeable depth elongation (Figs. 6a, f and k). Chemical (HCl) etching followed by confocal microscope characterization reveals for 100% inscription power, the voids dimensions are up to 17 μm (lateral) (Fig. 6a). The elongation effect is still visible for 10% power settings (Fig. 6c). However, the effect is negligible in the OCT PSF measurement (Fig. 5) and therefore suggest a maximum inscription power levels of 10% for the present setup. Lines written at 2.5% power settings showed less elongation (Fig. 7). It was not possible to measure these lines reliably using OCT but the confocal microscope images imply that more work should be done around this power level to optimize the line shape.
The lateral resolution varies with depth as the beam is focused into the sample. By tilting the sample the lateral resolution for the different layers allows the beam waist to be seen. Further samples with writing power optimized to give small defects are being planned.
It is worth noting that the visibility of the lines for any given power decreases with depth in the sample. This phenomenon could be due to the fact that the OCT system was focused close to the surface of the sample and away from this point the probe beam diverges. Alternatively it is possible that absorption of the femtosecond beam as it travels through the material is decreasing relative refractive index change between the modified region and its surroundings. Further investigation is required to understand this issue.
The resultant effect of the focused femtosecond pulses depends on the relative intensity of the focused spot in the sample to the material energy threshold. Low intensity pulses change the refractive index, and can be used for producing waveguide-like structures, with typical refractive index variations of around 1 x 10⁻⁴ [14]. As the pulse energy is increased a damage threshold is reached, above which small voids can be formed at the beam focus [18]. Due to the non-linear nature of the interaction, the size of the resultant defect can be on the micron scale. However, the exact nature of the damage depends on the laser parameters, focusing optics and host material. Increasing pulse energy can result in large voids with micro-cracks forming around the written structures. The uniformity of the substrate was found to be critical in the reproducibility of the point defects. The excellent surface flatness, finish and ease of anti-reflection coating, as compared to the use of the previously used epoxy resins, were also key features of the chosen substrate.
For the successful and repeatable production of OCT artifacts both the size of the defects and the repeatability of the writing procedure needed to be investigated. Subsurface defects are very hard to accurately measure, with cleaving being the only one to give accurate results [12].
3. Conclusions
This applicability of subsurface femtosecond machining techniques to the production of test artifacts for the validation of commercial OCT microscope systems has been demonstrated. The artifacts produced consisted of arrays of line defects whose size was shown to be around 1 µm. This is similar in size to the particles used in the previous OCT resolution work and is suitable for the validation of most commercial OCT systems. The advantage of the femtosecond technology is the ability to accurately place the defects at arbitrary locations in a material substrate that has well known optical properties that can be easily polished and anti-reflection coated. The results obtained are in agreement with those in the previous work.
Another advantage of this technology is that the accurate positioning of the defects and the variable size that can be achieved allows the artifact to also be used test the instrument scaling and sensitivity.
Current work is ongoing to optimize the laser settings and pursue improved designs which will be more sensitive tests of OCT systems than this initial trial.
Acknowledgments
The Authors wish to acknowledge the UK Government’s National Measurement Office and Sensors Knowledge Transfer Network for co-funding J. Rasakanthan CASE Ph.D.
References and links
- 1.Tomlins P. H., Wang R. K., “Theory, developments and applications of optical coherence tomography,” J. Phys. D Appl. Phys. 38(15), 2519–2535 (2005). 10.1088/0022-3727/38/15/002 [DOI] [Google Scholar]
- 2.Hee M. R., Izatt J. A., Swanson E. A., Huang D., Schuman J. S., Lin C. P., Puliafito C. A., Fujimoto J. G., “Optical coherence tomography of the human retina,” Arch. Ophthalmol. 113(3), 325–332 (1995). [DOI] [PubMed] [Google Scholar]
- 3.“St. Jude Medical to Acquire LightLab Imaging for $90M in cash,” OCT News, May 20, 2010, http://www.octnews.org/articles/2047898/st-jude-medical-to-acquire-lightlab-imaging-for-90/
- 4.Tsai M. T., Lee H. C., Lu C. W., Wang Y. M., Lee C. K., Yang C. C., Chiang C. P., “Delineation of an oral cancer lesion with swept-source optical coherence tomography,” J. Biomed. Opt. 13(4), 044012 (2008). 10.1117/1.2960632 [DOI] [PubMed] [Google Scholar]
- 5.Council of the European Communities, “Council Directive 93/42/EEC of 14 June 1993 concerning medical devices,” http://eur-lex.europa.eu/LexUriServ/LexUriServ.do?uri=CELEX:31993L0042:en:HTML
- 6.M. Cheng, Medical Device Regulations: Global Overview and Guiding Principles (World Health Organization, 2003). [Google Scholar]
- 7.Agrawal A., Huang S., Wei Haw Lin A., Lee M. H., Barton J. K., Drezek R. A., Pfefer T. J., “Quantitative evaluation of optical coherence tomography signal enhancement with gold nanoshells,” J. Biomed. Opt. 11(4), 041121 (2006). 10.1117/1.2339071 [DOI] [PubMed] [Google Scholar]
- 8.Pogue B. W., Patterson M. S., “Review of tissue simulating phantoms for optical spectroscopy, imaging and dosimetry,” J. Biomed. Opt. 11(4), 041102 (2006). 10.1117/1.2335429 [DOI] [PubMed] [Google Scholar]
- 9.Schmitt J. M., Knüttel A., “Model of optical coherence tomography of heterogeneous tissue,” J. Opt. Soc. Am. A 14(6), 1231–1242 (1997). 10.1364/JOSAA.14.001231 [DOI] [Google Scholar]
- 10.Murali S., Meemon P., Lee K. S., Kuhn W. P., Thompson K. P., Rolland J. P., “Assessment of a liquid lens enabled in vivo opitcal coherence microscope,” Appl. Opt. 49(16), D145–D156 (2010). 10.1364/AO.49.00D145 [DOI] [PubMed] [Google Scholar]
- 11.van Leeuwen T. G., Faber D. J., Aalders M. C., “Measurement of the axial point spread function in scattering media using single-mode fiber-based optical coherence tomography,” IEEE J. Sel. Top. Quantum Electron. 9(2), 227–233 (2003). 10.1109/JSTQE.2003.813299 [DOI] [Google Scholar]
- 12.Agrawal A., Pfefer T. J., Gilani N., Drezek R., “Three-dimensional characterization of optical coherence tomography point spread functions with a nanoparticle-embedded phantom,” Opt. Lett. 35(13), 2269–2271 (2010). 10.1364/OL.35.002269 [DOI] [PubMed] [Google Scholar]
- 13.P. H. Tomlins, R. A. Ferguson, C. Hart, and P. D. Woolliams, “Point-spread function phantoms for optical coherence tomography,” NPL Report OP 2 (National Physical Laboratory, 2009), pp. 1754–2944.
- 14.Ralston T. S., Marks D. L., Kamalabadi F., Boppart S. A., “Deconvolution methods for mitigation of transverse blurring in optical coherence tomography,” IEEE Trans. Image Process. 14(9), 1254–1264 (2005). 10.1109/TIP.2005.852469 [DOI] [PubMed] [Google Scholar]
- 15.Woolliams P. D., Ferguson R. A., Hart C., Grimwood A., Tomlins P. H., “Spatially deconvolved optical coherence tomography,” Appl. Opt. 49(11), 2014–2021 (2010). 10.1364/AO.49.002014 [DOI] [PubMed] [Google Scholar]
- 16.Gattass R. R., Mazur E., “Femtosecond laser micromachining in transparent materials,” Nat. Photonics 2(4), 219–225 (2008). 10.1038/nphoton.2008.47 [DOI] [Google Scholar]
- 17.Schaffer C. B., Jamison A. O., Mazur E., “Morphology of femtosecond laser-induced structural changes in bulk transparent materials,” Appl. Phys. Lett. 84(9), 1441–1443 (2004). 10.1063/1.1650876 [DOI] [Google Scholar]
- 18.Dubov M., Bennion I., Nikogosyan D. N., Bolger P., Zayats A. V., “Point-by-point inscription of 250nm period structure in bulk fused silica by tightly focused femtosecond UV pulses,” J. Opt. A Pure Appl. Opt. 10(2), 025305 (2008). 10.1088/1464-4258/10/2/025305 [DOI] [Google Scholar]
- 19.Wang D. L., Li C. D., Luo L., Yang H., Gong Q. H., “Sub-diffraction-limit voids in bulk quartz induced by femtosecond laser pulses,” Chin. Phys. Lett. 18(1), 65–67 (2001). 10.1088/0256-307X/18/1/323 [DOI] [Google Scholar]
- 20.D. Merino, “Adaptive optics for optical coherence tomography,” Ph.D. thesis (National University of Ireland, 2007). [Google Scholar]


