Abstract
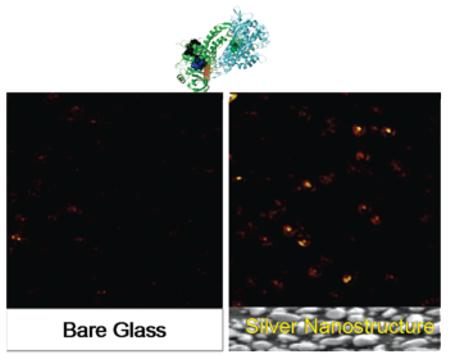 The enzyme cofactors are intrinsically fluorescent and participate directly in the single molecule enzymology studies. Due to photobleaching, one cannot follow kinetics continuously by cofactor fluorescence for more than several minutes typically. Modification of spectral properties of fluorophores, such as the amplification of emission intensity, can be achieved through coupling with surface plasmons in close proximity to metallic nanostructures. This process, referred to as metal-enhanced fluorescence, offers promise for a range of applications, including bioassays, sensor technology, microarrays, and single-molecule studies. Here, we demonstrated up to a 100-fold increase in the emission of the single cofactors and flavoenzymes near silver nanostructures. Amplified fluorescence of different types of flavins and flavoenzymes has been interpreted by using time-resolved single molecule fluorescence data. The results show considerable promise for the studies of enzyme kinetics using the intrinsic fluorescence from the cofactors.
1. INTRODUCTION
The development in single molecule fluorescence spectroscopy techniques has allowed for real-time observations of enzyme reaction kinetics on biologically relevant time scales.1-9 Such measurements bypass the usual ensemble averaging and provide detailed information on substrate binding and conformational changes. Flavin enzymes, notably dehydrogenases and oxide-reductase, have been utilized to study the real-time dynamic behavior of biomacromolecules through intrinsic flavin fluorescence without perturbation.10-15 Flavin adenine dinucleotide (FAD) and flavin mononucleotide (FMN) are cofactors commonly found in flavoproteins. These cofactors are naturally fluorescent and participate in the catalytic steps in a large number of enzymes which catalyze oxidation–reduction reactions. The emission of these cofactors turns on and off during catalysis, and thus, the signature fluorescence change of flavin upon reductive and oxidative reactions has been employed to study the turnover of single flavoenzymes with single molecule spectroscopy.8,11,12,14
While flavin fluorescence seems promising for single molecule enzymology, there are relatively few reports on this topic.16-19 The limited use of flavins with single molecule detection (SMD) is the result of several factors. Because of the inherent difficulties of SMD, single molecule experiments are typically performed using fluorophores with high extinction coefficients, quantum yields, and photostability. Flavins have extinction coefficients near 1.2 × 10⁴ M−1 cm−1 at 450 nm,20 which are about 10-fold smaller than probes like cyanine dyes which are typically used for SMD. Flavins in solution also have low quantum yields near 0.03. Additionally, upon binding to proteins, the flavin fluorescence is so heavily quenched that they are traditionally regarded as nonfluorescent. Furthermore, flavins display rapid blinking and transition to the triplet state. This combination of factors makes it very challenging to observe single flavoprotein molecules.
During the past several years, this laboratory has been active in modifying fluorophore emission near metallic nanostructures.21-27 We have shown that single fluorophores near metallic particles can display increased intensities and quantum yields, decreased lifetimes and blinking, and increased photostability.28-32 These favorable spectral changes are the result of increases in the radiative decay rates of fluorophores near metal nanoparticles due to the interactions and occur with all fluorophores tested to date, lanthanides, transition metal complexes, and quantum dots. We refer to this phenomenon as metal-enhanced fluorescence (MEF).23 Hence, it appeared likely that metallic nanostructures would have similar favorable effects on flavins and flavoproteins.
In the present report, we describe single molecule studies of flavins near silver nanoparticles. We first examined the flavin cofactors, namely, flavin mononucleotide (FMN) and flavin-adenine dinucleo-tide (FAD). Flavins are fluorescent in the oxidized state and become nonfluorescent in the reduced state. As a model protein, we selected glutathione reductase (GR) which is one of the best-studied flavoenzymes. Glutathione reductase is a homodimeric enzyme with a molecular mass of ~50 kDa per subunit, containing one molecule of FAD per subunit.33 The flavin cofactor is noncovalently bound, and is trapped in a tightly binding site between the two subunits. The enzyme catalyzes the NADPH-dependent reduction of oxidized glutathione (GSSG). The kinetic mechanism of glutathione reductase from various sources has been studied extensively.15,33-36 In this study, we have overcome the limitation of flavin cofactors and flavoenzymes by using silver nanostructured films and shown increases in quantum yields, reduced blinking, and increased photo-stability. The increase in the photostability will allow performing single molecule enzymology on proteins using only the intrinsic fluorescence from the cofactors. The experiments for this project have been performed using silver nanostructures prepared by wet chemical methods. However, it is difficult to control the distance and orientation of particle clusters and strongly directional emission can be best obtained using patterns on metal surfaces. Using currently available knowledge about plasmonics and fluorescence, one can propose a variety of defined configurations manufactured with available lithographic methods and apply them to enzyme kinetic studies which are dependent on intrinsic fluorescent cofactors.
2. EXPERIMENTAL SECTION
2.1. Cofactors and Enzymes Immobilized in Agarose Gel
FMN, FAD, and GR from bakers yeast were purchased from Sigma and used as received. The low gelling point agarose (Sigma, Type VII) was used to entrap flavin molecules and was dissolved in the PBS buffer (pH 7.2) with heating. The solution of flavin molecules was diluted into the agarose solution to a concentration of 1 nM just above the gelling temperature (30 °C), and the solution was spun on a coverslip at 3000 rpm for 10 s, yielding a smooth thin gel layer containing the flavin molecules. After the slide was mounted on the microscope stage, a small volume of buffer (10 μL) was applied on the gel sample to keep it moist, which also helped to reduce background noise.
2.2. Silver Island Film Preparation
Silver island films (SIFs) were deposited on cleaned glass coverslips by reduction of silver nitrate as reported previously.31,32 The formed silver island films are greenish and nonreflective. Only one side of each slide was coated with SIF. The particles are typically 100–500 nm across and 70 nm high, covering about 20% of the surface. Briefly, silver deposition was carried out in a clean beaker equipped with a Teflon-coated stir bar. Eight drops of fresh 5% NaOH solution were added to a fast stirring silver nitrate solution (0.22 g in 26 mL of water). Dark-brownish precipitates were formed immediately. Less than 1 mL of ammonium hydroxide was then added drop by drop to redissolve the precipitate. The clear solution was cooled to 5 °C in an ice bath, followed by placing the clean quartz slides in the solution. At 5 °C, a fresh solution of D-glucose (0.35 g in 4 mL of water) was added. The mixture was stirred for 2 min at that temperature. The beaker was removed from the ice bath and allowed to warm up to 30 °C. As the color of the mixture turned from yellow-greenish to yellow-brown, the color of the slides became greenish. The slides were removed and rinsed with water and bath sonicated for 1 min at room temperature. After rinsing with water, the slides were stored in water for several hours prior to the experiments.
2.3. Single Molecule Experiments
All single molecule studies were performed using a time-resolved confocal microscope (MicroTime 200, PicoQuant). A single mode pulsed laser diode (470 nm, 100 ps, 40 MHz) (PDL800, PicoQuant) was used as the excitation light. The collimated laser beam was spectrally filtered by an excitation filter (D470/10, Chroma) before directing into an inverted microscope (Olympus, IX 71). An oil immersion objective (Olympus, 100×, 1.3 NA) was used both for focusing laser light onto the sample and for collecting fluorescence emission from the sample. The fluorescence that passed a dichroic mirror was focused onto a 75 μm pinhole for spatial filtering to reject out-of-focus signals and then reached the single photon avalanche diode (SPAD) (SPCM-AQR-14, Perkin-Elmer Inc.) after passing a bandpass filter (Chroma D550/40 m). Images were recorded by raster scanning (in a bidirectional fashion) the sample over the focused spot of the incident laser with a pixel integration of 0.6 ms. The excitation power into the microscope was maintained less than 1 μW. Time-dependent fluorescence data were collected with a dwell time of 50 ms. The data was stored in the time-tagged-time-resolved (TTTR) mode, which allows recording every detected photon with its individual timing information. In combination with a pulsed diode laser, instrument response function (IRF) widths of about 300 ps fwhm can be obtained, which permits the recording of subnanosecond fluorescence lifetimes, extendable to less than 100 ps with reconvolution. Lifetimes were estimated by fitting to a χ2 value of less than 1.2 and with a residuals trace that was fully symmetrical about the zero axis. All measurements were performed in a dark compartment at room temperature.
3. RESULTS AND DISCUSSION
3.1. General Appearances of Embedded Single FMN, FAD, and Glutathione Reductase Molecules on Glass Substrate
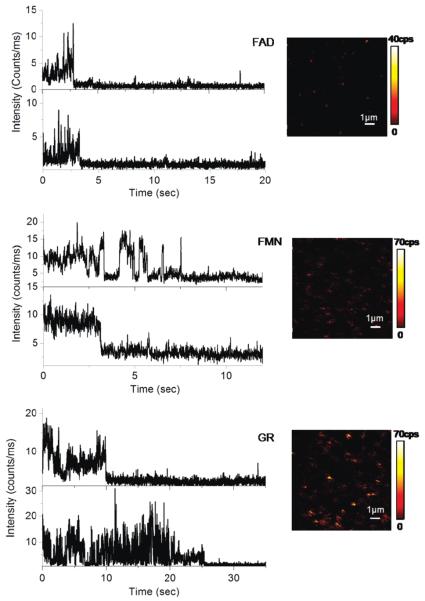
The images in Figure 1 show confocal fluorescence scans for 10 μm 10 μm areas from low concentrations of flavin molecules in agarose gel on bare glass substrates. Images of blank gels on glass, using PBS instead of flavin solution, show no fluorescence signals, confirming that the emission spots in the images are due to the specific cofactor fluorescence. However, the images indicate that it is rather difficult to observe single flavin cofactors when in gel. The image from FAD illustrates isolated dim fluorescence spots. Most of the spots instantaneously disappear after the subsequent scans, which is characteristic for single molecule bleaching in one step. The FMN image is somewhat “noisy”; a large number of fluorescent streaks appear, oriented along the bidirectional scan course, indicating that the fluorescence is not continuous in these spots, which is a typical single molecule blinking behavior. With glutathione reductase (GR) embedded in gel, one can see single molecules blink dramatically during the scanning. The flavoproteins are assumed to be spatially confined in the gel with free rotational diffusion. The appearances of emission spots from the images indicate that the single molecules were entrapped in and/or on the agarose gel at fixed positions. These confocal scan images provide initial qualitative information on local environment properties. Variation of the vertical displacement of the molecules in the agarose gel from the focal point of the illumination may account for the difference in fluorescent intensities of different molecules.
Figure 1.
Single molecule trajectories and fluorescence images of FAD, FMN, and glutathione reductase embedded in agarose gel on glass coverslips.
Figure 1 also presents the typical single flavin molecule intensity traces. The emission rates observed are much lower than what we observed with fluorophores such as Cy5 under similar circumstances, which are typically near 20–30 kHz. For FMN and FAD, we observe rapid blinking and photobleaching which limited the observation time to several seconds. The fluorescence trajectories in Figure 1 show flavin molecules were fluorescing over time until they abruptly dropped to background level. The fluorescence of single GR occasionally drops to the background level in two steps, which could be attributed to the fluorescence loss of FAD from each subunit. Because photobleaching increases with excitation intensity while fluorophore dissociation is photoindependent, the power dependence of one-step irreversible fluorescence loss in the experiments suggested we are observing single enzyme molecules, not aggregates of several molecules. Some of the enzyme molecules lost fluorescence in a single step, indicating that only one FAD is bound to the enzyme at that point. The one-step photobleaching from the GR enzyme could also suggest that our GR samples could contain free FAD residues. Photobleaching may have been somewhat slower with GR. However, the short observation times and blinking will make it very difficult to detect catalyst events which will also show blinking by the flavin redox reactions. As illustrated in Figure 1, the emission rates observed from these one-step time traces of GR are somewhat higher compared with those from single cofactor molecules, implying that the fluorescent features of bound flavin molecules are rather influenced by the protein environment.
3.2. General Appearances of Embedded Single FMN, FAD, and Glutathione Reductase Molecules in the Presence of Metallic Nanostructures
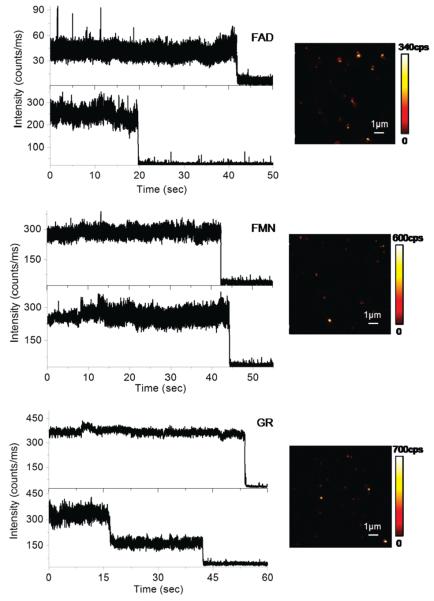
Silver island films were constituted of irregularly spread nanoscale spherical and elliptical silver nano-particles. SIF itself typically generates relatively weak scattering light, which was invisible in such images under similar circumstances. The representative inserted images in Figure 2 show well-defined and much brighter fluorescent spots over background. The resulting amplification of fluorescence increases the overall signal-to-noise ratio and greatly facilitates detection of single flavins. The fluorescence images of single flavoproteins in the presence of metallic nanostructues were observed to be a very good approximation of a two-dimensional Gaussian. Representative time traces of different single flavins and single flavoproteins deposited on SIF are depicted in Figure 2. We found much higher and fairly constant emission rates for FAD, FMN, and GR in the presence of silver nanostructure. The rapid “on/off” blinking appeared to be completely eliminated by the silver particles. Remarkably, for FAD deposited on SIF, the brightness ranges from 40 to almost 300 kHz, which is about a 10- to 100-fold enhancement compared with those deposited on glass substrates. A comparable enhancement factor of about 20–30-fold for brightness was also observed for FMN molecules under similar circumstances. In the case of GR, we noticed two-step irreversible photobleaching occurring for the single flavoproteins near silver nanoparticles, indicating the presence of glutathione reductase homodimers. A 30-fold increase in the emission rate of GR molecules was observed on silver nanostructures, as shown in Figure 2. A relative high level of background was consistently detected in the presence of metallic nanostructure. This background is stable and continuous, and it does not significantly interfere with the measurement of single molecule emission. In addition to increased emission rates on silver nanostructure, flavin molecules appeared to survive for longer periods prior to photobleaching. Most of the molecules displayed nearly constant emission intensity for more than 20 s before undergoing irreversible photobleaching. On the contrary, most flavin molecules on glass substrates suffered photobleaching shortly under constant illumination.
Figure 2.
Single molecule trajectories and fluorescence images of FAD, FMN, and glutathione reductase embedded in agarose gel deposited on silver nanostructures.
3.3. Comparison of Total Detected Photons of Single Flavin and Flavoenzyme Molecules on Glass and SIF
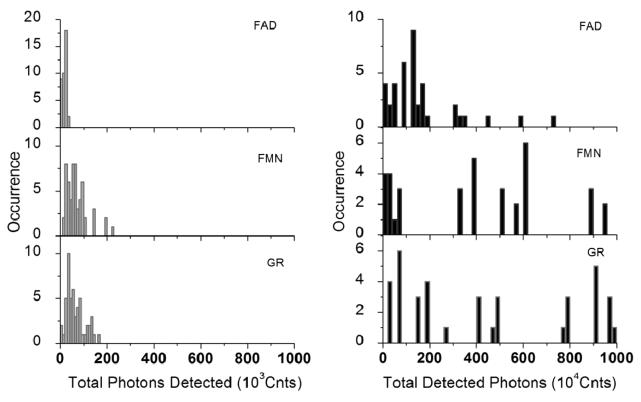
In comparison to flavin molecules deposited on a bare glass cover-slip, flavins on silvered surfaces show another clear advantage. The total number of photons emitted before photobleaching is particular interesting. Figure 3 shows the histograms of the total detected photons measured for over 40 single molecules on glass and SIF surfaces. This has been done by taking about 60 single trajectories. These traces reveal the total number of photons observed for each fluorophore until it stopped emitting. The total number of detected photons is determined by integrating of individual single-molecule time transients prior to photobleaching (Figures 1 and 2). It is obvious from these histograms that the flavin and flavoenzyme molecules on glass are prone to fast photobleaching and emitting total photons in the range 104–105. In the presence of SIF, flavins emit significantly more total photons of above 106 in most cases before photobleaching. The approximately 10–100-fold increase in total emitted photons on silvered surfaces suggests an incredible increase in the fluorescence quantum yield of the flavin and enzyme molecules and also an improvement in photostability as evidenced by the reduced “on/off” blinking.
Figure 3.
Total detected photons of FAD, FMN, and GR on glass (left panel) and silver nanostructures (right panel), respectively.
The significant broadening of the enhancement distributions obtained from the cofactors/enzymes on SIF layers not only provides a clear proof for efficient coupling between metal nanoparticles and biomoleculess but is also a direct consequence of heterogeneity characteristic for the chosen system. First, the size variations of silver nanoparticles in the SIF layer contribute to a broad distribution of fluorescence enhancement factors for individual cofactors. In addition, the interaction mechanisms between the metal surface and the fluorescent cofactor depend on the distance. Fluorescence may be quenched for flavin molecules located directly on the SIF surface, while fluorescence of the ones far from the surface should remain unaffected. A signature of the latter is presumably by the small fraction of flavin molecules on SIF with intensities below 10 kHz, which is comparable to signals measured for the reference sample.
3.4. Comparison of Time-Resolved Fluorescence Statistics on Glass and SIF
The single molecule fluorescence lifetime measurement was employed using time-correlated single photon counting (TCSPC) by plotting a histogram of time lags between the excitation pulses and the detected fluorescence photons. Fluorescence lifetime decay profiles were constructed by binning all of the arrived photons within a defined time interval and were analyzed in terms of the multiexponential model as the sum of individual single-exponential decays. The average lifetime τav shown in the experiment is the amplitude-weighted averaged lifetime calculated from the fit result37,38 (eq 1). The values of αl and τl were determined using PicoQuant SymPhoTime software with the deconvolution of the instrument response function. In this expression, the values αi represent amplitudes of the components and the values τi are the decay times.
| (1) |
Monoexponential decay analysis of a free FMN trajectory (Figure 1, top trace) revealed a fluorescence lifetime of 3.46 ns, whereas FAD (Figure 1, top trace) yielded an averaged lifetime of 2.35 ns, respectively (decay curves not shown). Since the fluorescence lifetimes are predominantly determined by the rate constants of photochemical and radiative decay processes, the estimation of the relative fluorescence quantum yield can be obtained from the amplitudes and time constants of the TCSPC data of FAD and FMN according to eq 2,39 yielding QFAD about 68% of QFMN, which is in good agreement with the observed trajectories shown in Figure 1.
| (2) |
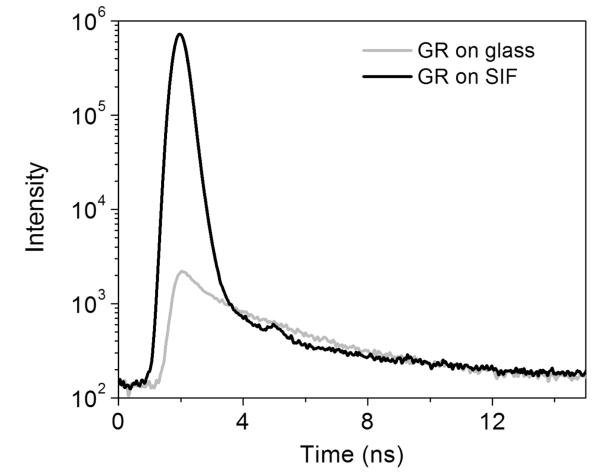
The major population of GR molecules from bakers yeast are characterized by nanosecond fluorescence lifetime. Lifetime analysis of the fluorescence intensity decays of the enzymes normally yields lifetime distributions with two components. The bioexponential decay behavior of the flavin could be the result of an interaction of fluorophore with the protein environment.40 In Figure 4, the fluorescence decay of a specific single GR on silvered surfaces is compared with that of GR on bare glass. A bioexponential decay model best fits the GR fluorescence decay deconvolved from the instrument response function (IRF), as evaluated by the residuals and values of χ2. The analysis of the fluorescence signal of GR on glass yields an averaged lifetime of τ = 3.52 ns. The curve decays exponentially with two lifetime components of τ1 = 3.63 ns and τ2 = 0.39 ns, with relative amplitudes of 76 and 24%, respectively (χ2 = 1.013). The relative amplitudes of bioexponential fits to the flavoenzyme decays are found to be relatively constant upon being deposited on bare glass substrates, which suggests that most of the molecules adsorbed on glass are in a relatively homogeneous environment. In contrast, the fluorescence of protein deposited on SIF decay much faster and yields a much shorter averaged lifetime of 1.38 ns in Figure 4. Two lifetime components of τ1 = 1.98 ns and τ2 = 0.19 ns were obtained with relative amplitudes of 16 and 84%, respectively (χ2 = 1.058). At later times, the time correlated decay gradually approaches that of GR on glass coverslips. In the presence of SIF, we observed a predominant high-intensity contribution (>80%) from the faster lifetime component (as short as 0.2 ns) for the investigated single molecules.
Figure 4.
Time decay curves of single GR enzyme on glass (gray line) and silver nanostructures (dark line), respectively.
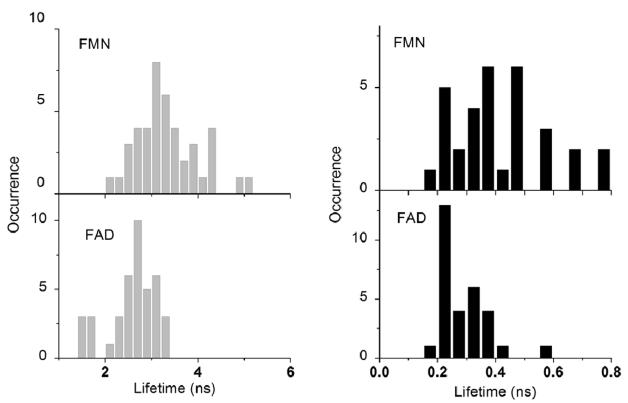
The histograms provide a means for evaluating the lifetime components of the single molecule data. Significant shifts to shorter values of the lifetime distributions are observed for the samples bound to SIF. We also examined the lifetime distributions of flavin molecules (Figure 5) and GR (data not shown) on glass and SIF. Remarkably, the FMN lifetime is decreased 8-fold from averaged 3.1 ± 0.3 ns on glass to 0.46 ± 0.24 ns on SIF, the FAD lifetime is shortened about 10-fold from averaged 2.7 ± 0.2 to 0.25 ± 0.09 ns, and the lifetime of GR is reduced from averaged 3.6 ± 0.3 to 1.4 ± 0.5 ns (data not shown). In the presence of silver nanoparticles, the distributions of lifetime become relatively broad and skewed; the intensity decay is dominated by a short decay time around 200 ps. The minor component is also observed around 3–4 ns. It seems reasonable therefore to assume that the longer lifetime component arises from flavin molecules exposed to the glass substrate and its contribution decreases dramatically where the surface becomes occupied by metallic nanostructure.
Figure 5.
Lifetime histograms of single FAD and FMN flavins on glass (left panel) and silver nanostructures (right panel), respectively.
Lifetime is defined as the time of the excited state. This observation demonstrates an increase in the radiative decay rate, which in turn will decrease blinking and increase photostability. The fluorescence quantum yield is defined as the probability that a given excited fluorophore will produce a fluorescence photon and can be expressed as follows:41
| (3) |
| (4) |
An increase in the radiative decay rate near the metal is given by Γ + Γm, where Γm is the additional rate due to the metal and Γ and knr are the radiative and nonradiative decay rates of the dye molecule on an inert substrate. When a fluorophore is surrounded by an absorbing medium, energy is dissipated into heat through near-field coupling. The presence of an interface in the vicinity of the fluorophore alters the fluorescence processes through the modification of its local electromagnetic environment. Due to the higher radiative decay compared to nonradiative, the metal-induced change to Γ + Γm results in the reduction of the fluorescence lifetime and in an increase in the quantum efficiency of the fluorophore. The observed heterogeneity of brightness is likely due to site-to-site variations in local electromagnetic field between the fluorophore and the metallic nanoparticle.
In conclusion, the examples mentioned here show how the high signals from the single flavin molecules can be obtained using metallic nanostructures. The inherent roughness of the films gives rise to strong surface curvature, leading to a high electric field. In many cases, the proximity to SIF results in a preferential increase in intensity of low quantum yield fluorophores and lifetimes decrease as the intensity increases. Particularly important is the distribution of distances between a given flavin molecule and a metal nanoparticle. The strong energy transfer from the excited molecules to a nearby metallic nano-objective or an increase in the radiative decay rate of the fluorophore can dramatically shorten the lifetime of the excited state, leading to a fast de-excitation, which is consistent with our recorded data in this experiment. Proximity to metal nanostructures could induce changes in local electromagnetic field. Unusual effects are expected, and the increase in the radiative decay results in a decrease in lifetime. This effect increases the number of excitation cycles a molecule can survive until photobleaching. As a result, a dramatic increase in the number of photons is observed from a single fluorophore as described above. The main benefit of the results will then be used on studies of enzyme kinetics using intrinsic fluorescent cofactors which have been limited by photodamage and transitions to the triplet state.
ACKNOWLEDGMENT
This work was supported by NIH grants (HG002655, HG005090, and EB009509).
REFERENCES
- 1.Gershenson A. Curr. Opin. Chem. Biol. 2009;13(4):436–442. doi: 10.1016/j.cbpa.2009.06.011. [DOI] [PubMed] [Google Scholar]
- 2.Chen Q, Groote R, Schonherr H, Vancso GJ. Chem. Soc. Rev. 2009;38(9):2671–2683. doi: 10.1039/b903638e. [DOI] [PubMed] [Google Scholar]
- 3.Qian H. Biophys. J. 2008;95(1):10–17. doi: 10.1529/biophysj.108.131771. [DOI] [PMC free article] [PubMed] [Google Scholar]
- 4.Walter NG, Huang CY, Manzo AJ, Sobhy MA. Nat. Methods. 2008;5(6):475–489. doi: 10.1038/nmeth.1215. [DOI] [PMC free article] [PubMed] [Google Scholar]
- 5.Dan N. Curr. Opin. Colloid Interface Sci. 2007;12(6):314–321. doi: 10.1016/j.cocis.2007.08.014. [DOI] [PMC free article] [PubMed] [Google Scholar]
- 6.Ditzler MA, Aleman EA, Rueda D, Walter NG. Biopolymers. 2007;87(5–6):302–316. doi: 10.1002/bip.20819. [DOI] [PubMed] [Google Scholar]
- 7.Min W, English BP, Luo GB, Cherayil BJ, Kou SC, Xie XS. Acc. Chem. Res. 2005;38(12):923–931. doi: 10.1021/ar040133f. [DOI] [PubMed] [Google Scholar]
- 8.Xie XS, Lu HP. J. Biol. Chem. 1999;274(23):15967–15970. doi: 10.1074/jbc.274.23.15967. [DOI] [PubMed] [Google Scholar]
- 9.Xie XS, Trautman JK. Annu. Rev. Phys. Chem. 1998;49:441–480. doi: 10.1146/annurev.physchem.49.1.441. [DOI] [PubMed] [Google Scholar]
- 10.Vrielink A, Ghisla S. FEBS J. 2009;276(23):6826–6843. doi: 10.1111/j.1742-4658.2009.07377.x. [DOI] [PubMed] [Google Scholar]
- 11.Shi J, Dertouzos J, Gafni A, Steel D, Palfey BA. Proc. Natl. Acad. Sci. U.S.A. 2006;103(15):5775–5780. doi: 10.1073/pnas.0510482103. [DOI] [PMC free article] [PubMed] [Google Scholar]
- 12.Westphal AH, Matorin A, Hink MA, Borst JW, van Berkel WJH, Visser A. J. Biol. Chem. 2006;281(16):11074–11081. doi: 10.1074/jbc.M600609200. [DOI] [PubMed] [Google Scholar]
- 13.Rigby SE, Basran J, Combe JP, Mohsen AW, Toogood H, van Thiel A, Suitcliffe MJ, Leys D, Munro AW, Scrutton NS. Biochem. Soc. Trans. 2005;33:754–757. doi: 10.1042/BST0330754. [DOI] [PubMed] [Google Scholar]
- 14.Lennon BW, Williams CH. Biochemistry. 1997;36(31):9464–9477. doi: 10.1021/bi970307j. [DOI] [PubMed] [Google Scholar]
- 15.Williams CH. FASEB J. 1995;9(13):1267–1276. doi: 10.1096/fasebj.9.13.7557016. [DOI] [PubMed] [Google Scholar]
- 16.Berg P. A. W. v. d., Widergren J, Hink MA, Rigler R, Visser AJWG. Spectrochim. Acta, Part A. 2001;57:2135–2144. doi: 10.1016/s1386-1425(01)00494-2. [DOI] [PubMed] [Google Scholar]
- 17.Li H-W, Yeung ES. J. Photochem. Photobiol., A. 2005;172:73–79. [Google Scholar]
- 18.Visser AJWG, Berg P. A. W. v. d., Visser NV, Hoek A. v., Berg H. A. v. d., Parsonage D, Claiborne A. J. Phys. Chem. B. 1998;102:10431–10439. [Google Scholar]
- 19.Lu HP, Xun L, Xie XS. Science. 1998;282:1877–1882. doi: 10.1126/science.282.5395.1877. [DOI] [PubMed] [Google Scholar]
- 20.Pawley JB. Handbook of Biological Confocal Microscopy. 3rd ed. Vol. 13. Springer-Verlag; New York: 2006. p. 988. [Google Scholar]
- 21.Lakowicz JR, Ray K, Chowdhury M, Szmacinski H, Fu Y, Zhang J, Nowaczyk K. Analyst. 2008;133(10):1308–1346. doi: 10.1039/b802918k. [DOI] [PMC free article] [PubMed] [Google Scholar]
- 22.Lakowicz JR. Anal. Biochem. 2005;337(2):171–194. doi: 10.1016/j.ab.2004.11.026. [DOI] [PMC free article] [PubMed] [Google Scholar]
- 23.Lakowicz JR, Malicka J, Gryczynski I, Gryczynski Z, Geddes CD. J. Phys. D: Appl. Phys. 2003;36(14):R240–R249. doi: 10.1088/0022-3727/36/14/203. [DOI] [PMC free article] [PubMed] [Google Scholar]
- 24.Chowdhury MH, Ray K, Johnson ML, Gray SK, Pond J, Lakowicz JR. J. Phys. Chem. C. 2010;114(16):7448–7461. doi: 10.1021/jp911229c. [DOI] [PMC free article] [PubMed] [Google Scholar]
- 25.Fu Y, Lakowicz JR. J. Phys. Chem. C. 2010;114(16):7492–7495. doi: 10.1021/jp911407c. [DOI] [PMC free article] [PubMed] [Google Scholar]
- 26.Smacinski H, Ray K, Lakowicz JR. Anal. Biochem. 2009;385(2):358–364. doi: 10.1016/j.ab.2008.11.025. [DOI] [PMC free article] [PubMed] [Google Scholar]
- 27.Zhang J, Fu Y, Liang D, Zhao RY, Lakowicz JR. Langmuir. 2008;24(21):12452–12457. doi: 10.1021/la801749f. [DOI] [PMC free article] [PubMed] [Google Scholar]
- 28.Fu Y, Zhang J, Lakowicz JR. J. Am. Chem. Soc. 2010;132(16):5540–5541. doi: 10.1021/ja9096237. [DOI] [PMC free article] [PubMed] [Google Scholar]
- 29.Fu Y, Lakowicz JR. Laser Photonics Rev. 2009;3(1–2):221–232. doi: 10.1002/lpor.200810035. [DOI] [PMC free article] [PubMed] [Google Scholar]
- 30.Fu Y, Zhang J, Lakowicz JR. Chem. Commun. 2009;3:313–315. doi: 10.1039/b816736b. [DOI] [PMC free article] [PubMed] [Google Scholar]
- 31.Fu Y, Zhang J, Lakowicz JR. Biochem. Biophys. Res. Commun. 2008;376(4):712–717. doi: 10.1016/j.bbrc.2008.09.062. [DOI] [PMC free article] [PubMed] [Google Scholar]
- 32.Fu Y, Zhang J, Lakowicz JR. Langmuir. 2008;24(7):3429–3433. doi: 10.1021/la702673p. [DOI] [PMC free article] [PubMed] [Google Scholar]
- 33.Mannervik B. Biochem. Soc. Trans. 1987;15(4):717–718. doi: 10.1042/bst0150717. [DOI] [PubMed] [Google Scholar]
- 34.Bastiaens PIH, Vanhoek A, Wolkers WF, Brochon JC, Visser A. Biochemistry. 1992;31(31):7050–7060. doi: 10.1021/bi00146a005. [DOI] [PubMed] [Google Scholar]
- 35.Krauth-Siegel RL, Arscott LD, Schonleben-Janas A, Schirmer RH, Williams CH. Biochemistry. 1998;37(40):13968–13977. doi: 10.1021/bi980637j. [DOI] [PubMed] [Google Scholar]
- 36.Veine DM, Arscott LD, Williams CH. Biochemistry. 1998;37(44):15575–15582. doi: 10.1021/bi9811314. [DOI] [PubMed] [Google Scholar]
- 37.Posokhov YO, Ladokhin AS. Anal. Biochem. 2006;348:87–93. doi: 10.1016/j.ab.2005.10.023. [DOI] [PubMed] [Google Scholar]
- 38.Lakowicz JR. Principles of Fluorescence Spectroscopy. 3rd ed. Springer Science+Business Media, LLC; New York: 2006. [Google Scholar]
- 39.Berg P. A. W. v. d., Feenstra KA, Mark AE, Berendsen HJC, Visser AJWG. J. Phys. Chem. B. 2002;106:8858–8869. [Google Scholar]
- 40.Wlodarczyk J, Kierdaszuk B. Biophys. J. 2003;85(1):589–598. doi: 10.1016/S0006-3495(03)74503-2. [DOI] [PMC free article] [PubMed] [Google Scholar]
- 41.Aslan K, Gryczynski I, Malicka J, Matveeva E, Lakowicz JR, Geddes CD. Curr. Opin. Biotechnol. 2005;16:55–62. doi: 10.1016/j.copbio.2005.01.001. [DOI] [PMC free article] [PubMed] [Google Scholar]


