The endoplasmic reticulum-localized transmembrane kinase PERK is one of three major ER stress transducers. The crystal structure of PERK’s kinase domain has been determined to 2.8 Å resolution.
Keywords: UPR, PERK, kinase domains, endoplasmic reticulum, eIF2α kinase, protein translation
Abstract
The endoplasmic reticulum (ER) unfolded protein response (UPR) is comprised of several intracellular signaling pathways that alleviate ER stress. The ER-localized transmembrane kinase PERK is one of three major ER stress transducers. Oligomerization of PERK’s N-terminal ER luminal domain by ER stress promotes PERK trans-autophosphorylation of the C-terminal cytoplasmic kinase domain at multiple residues including Thr980 on the kinase activation loop. Activated PERK phosphorylates Ser51 of the α-subunit of translation initiation factor 2 (eIF2α), which inhibits initiation of protein synthesis and reduces the load of unfolded proteins entering the ER. The crystal structure of PERK’s kinase domain has been determined to 2.8 Å resolution. The structure resembles the back-to-back dimer observed in the related eIF2α kinase PKR. Phosphorylation of Thr980 stabilizes both the activation loop and helix αG in the C-terminal lobe, preparing the latter for eIF2α binding. The structure suggests conservation in the mode of activation of eIF2α kinases and is consistent with a ‘line-up’ model for PERK activation triggered by oligomerization of its luminal domain.
1. Introduction
Folding of secreted and transmembrane proteins takes place in the lumen of the endoplasmic reticulum (ER). To ensure that only properly folded proteins are delivered to their destinations, the ER possesses a quality-control mechanism to match the capacity of the ER folding machinery to the unfolded protein load in the ER lumen. Perturbation of the folding environment in the ER caused by endogenous or exogenous factors is associated with ER stress and induces an unfolded protein response (UPR) aimed at restoring balance to the ER. UPR is activated in and affects the outcome of various pathophysiological conditions such as viral infections (Zheng et al., 2005 ▶), cancers (Koong et al., 2006 ▶; Ma & Hendershot, 2004 ▶) and protein-folding diseases (Bartoszewski et al., 2008 ▶; Kudo et al., 2002 ▶).
The UPR promotes protein folding in the ER lumen by two separate strands: increasing ER folding capacity and reducing unfolded-protein load (Bernales et al., 2006 ▶; Ron & Walter, 2007 ▶). The first strand is regulated by the ER resident transmembrane proteins IRE1 and ATF6. Misfolded proteins in the ER lumen trigger activation of IRE1 and ATF6 and induce the expression of ER molecular chaperones and other folding enzymes (Cox & Walter, 1996 ▶; Korennykh et al., 2009 ▶; Lee et al., 2008 ▶; Papa et al., 2003 ▶). Structural studies on the luminal and cytoplasmic domains of IRE1 indicate that it can form oligomers in the crystal structure (Credle et al., 2005 ▶; Korennykh et al., 2009 ▶) and in vivo (Aragón et al., 2009 ▶; Kimata et al., 2007 ▶; Shamu & Walter, 1996 ▶).
The second strand of UPR is controlled by a different ER resident transmembrane protein: protein kinase RNA-like endoplasmic reticulum kinase or pancreatic ER kinase (PERK; Harding et al., 1999 ▶, 2000 ▶). PERK is found in all metazoans and shares the same domain organization as IRE1; both proteins have a structurally and functionally related luminal sensor domain (Bertolotti et al., 2000 ▶) and a divergent cytoplasmic effector domain.
The cytoplasmic domain of PERK has serine/threonine protein kinase activity and belongs to the eIF2α kinase subfamily. Three other members of this subfamily (PKR, GCN2 and HRI) have been discovered in mammalian cells and can be activated by different stimuli. PKR senses double-stranded viral RNA in infected cells (Nanduri et al., 2000 ▶; Ung et al., 2001 ▶; Zhang et al., 2001 ▶). The metabolic sensor GCN2 (general control non-repressible) is stimulated by uncharged tRNAs (Dong et al., 2000 ▶) or UV irradiation (Deng et al., 2002 ▶; Hao et al., 2005 ▶). Heme-regulated inhibitor (HRI) is triggered by hemin deprivation in erythroid cells (Chen et al., 1994 ▶).
The activation of PERK is followed by the autophosphorylation of its kinase domain (KD), which provides PERK with full catalytic activity (Harding et al., 1999 ▶; Marciniak et al., 2006 ▶). Activated PERK can specifically phosphorylate Ser51 of the α-subunit of the translation initiation factor eIF2 (eIF2α; Sood et al., 2000 ▶). Phosphorylated eIF2α can competitively bind eIF2β, a guanine nucleotide-exchange factor, to inhibit the exchange from eIF2α-GDP to eIF2α-GTP; eIF2α-GTP is a key component for translation initiation complex formation (Dever, 2002 ▶). The final outcome of PERK pathway activation is to attenuate protein synthesis at the initiation stage.
X-ray crystallographic studies on two eIF2α kinase family members, PKR and GCN2, have revealed the structures of these eIF2α kinases and their complexes with the substrate eIF2α (Dar et al., 2005 ▶; Padyana et al., 2005 ▶); however, the two structures are very different, raising important questions about the similarities and differences between the active conformations of eIF2α kinases. To study the activation mechanism of the PERK pathway and expand our knowledge of the eIF2α kinase family, we have determined the crystal structure of mouse PERK kinase domain (mPERK KD) to 2.8 Å resolution. In our structure, the activation loop has been phosphorylated at Thr980. The conformation revealed in this structure may represent the state of PERK which is ready for eIF2α binding. We also proposed a ‘line-up’ model for PERK kinase domain autophosphorylation which could also be used to explain the activation of the PERK pathway.
2. Materials and methods
2.1. Construction of mPERK KD
mPERK KD (Arg584–Asn1114) with a segment deletion (ΔLys702–Thr866) was amplified from full-length mPERK cDNA using PCR and cloned into pET28b. Escherichia coli BL21 (DE3) Codon Plus strain was used for the expression of recombinant protein. Ni–NTA beads were used to purify the His-tagged recombinant protein from the clarified cell lysate. Further purification was carried out by size-exclusion chromatography.
2.2. Crystallization of mPERK KD
The protein samples used for crystallization were concentrated to 17 mg ml−1 in a buffer consisting of 20 mM Tris pH 7.5, 150 mM NaCl. Diamond-shaped crystals of mPERK KD were obtained by the hanging-drop vapor-diffusion method under conditions consisting of 1.1 M sodium citrate pH 7.5 at 293 K. mPERK KD crystals were soaked in cryoprotectant consisting of 20% ethylene glycol, 1.1 M sodium citrate pH 7.5 and immediately frozen in liquid nitrogen.
2.3. Data collection and structure determination of mPERK KD
Diffraction data from mPERK KD crystals were collected on the SER-CAT 22-ID beamline at APS. The crystals diffracted X-rays to 2.8 Å resolution and belonged to space group P41212, with unit-cell parameters a = 97.89, c = 116.71 Å. The mPERK KD structure was determined by the molecular-replacement (MR) method using the program Phaser. Atomic coordinates of human PKR in the PKR–eIF2α complex structure (PDB entry 2a1a; Dar et al., 2005 ▶) were used as the search model. The model of mPERK KD was manually built using Coot and further refined using REFMAC5 (Table 1 ▶). The relatively large difference between R work and R free is probably a consequence of the present resolution. The Ramachandran plot of this structure showed that 92.2% of nonglycine residues are in the preferred region and 7.8% of nonglycine residues are in the allowed region. No residues are in the disallowed region. The coordinates of mPERK KD have been deposited in the PDB under accession code 3qd2.
Table 1. Statistics of mPERK KD structure determination and refinement.
Values in parentheses are for the highest resolution shell.
| Data collection | |
| Space group | P41212 |
| Unit-cell parameters (Å, °) | a = b = 97.89, c = 116.71, α = β = γ = 90 |
| Resolution (Å) | 2.80 (2.85–2.80) |
| Rmerge | 0.056 (0.675) |
| 〈I/σ(I)〉 | 44.6 (2.3) |
| Completeness (%) | 97.1 (78.5) |
| Multiplicity | 7.3 (5.2) |
| Refinement | |
| Resolution (Å) | 44.6–2.80 |
| No. of reflections | 13283 |
| Rwork/Rfree | 0.272 (0.397)/0.328 (0.451) |
| No. of atoms | |
| Protein | 2267 |
| Water | 21 |
| B factors (Å2) | |
| Protein | 93.52 |
| Water | 86.40 |
| R.m.s. deviations | |
| Bond lengths (Å) | 0.007 |
| Bond angles (°) | 1.052 |
3. Results and disscussion
3.1. Crystal structure of mPERK KD
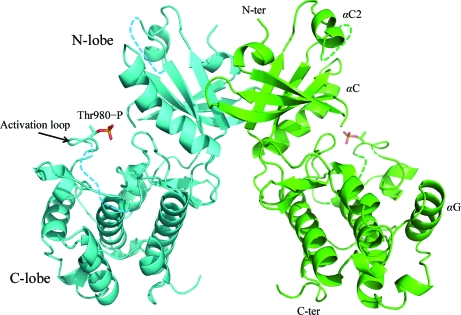
To reveal the structure of mPERK KD, we cloned the mPERK fragment Arg584–Asn1114 with the deletion of the large heavily phosphorylated N-terminal kinase insert loop (Lys702–Thr866). A similar deletion was performed in the crystallographic studies of PKR and GCN2 to facilitate crystallization because this segment is highly disordered. Crystals of mPERK KD diffracted X-rays to 2.8 Å resolution and the recombinant mPERK KD forms a homodimer in the structure (Fig. 1 ▶).
Figure 1.
Overall structure of the mPERK KD dimer. Ribbon drawings of two mPERK KD protomers are colored cyan and green, respectively. mPERK KD dimerizes through its N-terminal lobe. Thr980 residues are phosphorylated in this dimer structure and are shown as ball-and-stick models. Regions missing from the electron-density map are indicated by dotted lines.
The overall structure is that of a typical protein kinase with two distinct subdomains, a smaller N-terminal lobe (N-lobe) and a larger C-terminal lobe (C-lobe), linked by a short hinge loop. The N-lobe is constituted by three α-helices (α0, αC and αC2) and five β-strands (β1–β5). (The helices and strands are named in the similar manner as in the PKR structure.) The loop connecting αC2 and β5 cannot be visualized in the electron-density map. This flexible region corresponds to the deleted segment in our construct. The N-lobe provides the interfaces for mPERK KD dimerization. The C-lobe of mPERK KD is formed by one long activation loop (residues 953–990), two short β-strands (β6–β7) and seven α-helices (αD–αJ). A phosphate moiety was discovered in the electron-density map at the position of Thr980, indicating the phosphorylation state of this residue. 15 residues (residues 964–977 and 984) in the activation loop are not visible in the electron-density map. This means the activation loop is still partially disordered. 36 residues at the C-terminus of mPERK KD are also missing in the structure that we have determined.
3.2. Structural comparison betwen mPERK KD and PKR KD
In the complex structure of human PKR and eIF2α (PDB entry 2a19), the two PKR monomers in each dimer represent two different conformations. One monomer contains a phosphorylated activation loop and binds the substrate eIF2α, and may represent the active conformation. The other PKR monomer within the homodimer contains an unphosphorylated activation loop and may represent the inactive conformation. The primary sequence identity between PERK and PRK is 23%. We have compared our structure of mPERK KD with these two structures.
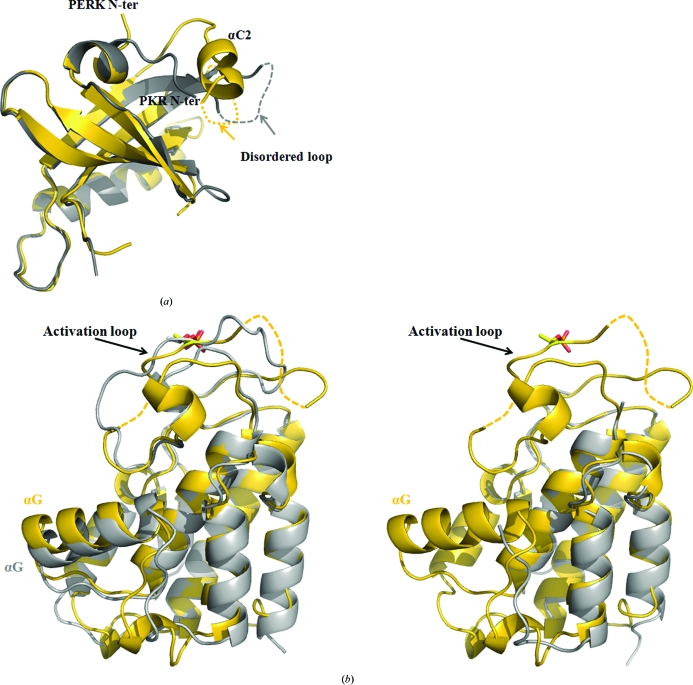
Two major differences were found in the structure of the PERK N-lobe compared with that of PKR (Fig. 2a ▶), which result in a root-mean-square deviation (r.m.s.d.) of 0.979 Å for main-chain atoms on superimposition of 64 residues. The N-terminus of PERK KD points in a different direction, which is ∼150° away from the N-terminus of PKR KD. Moreover, a short helix (αC2) is observed in the mPERK KD N-terminal lobe just before the flexible region. No such helix is apparent in the PKR KD structure (Fig. 2 ▶ a). In the crystal structures of PERK KD and PKR KD the N-terminal lobes are responsible for dimerization and the dimer interfaces are very similar in PERK and PKR. Both PERK and PKR form homodimers constituted by two back-to-back monomers. In contrast, GCN2, another eIF2α kinase family member, forms a homodimer from two monomers in an upside-down fashion (Padyana et al., 2005 ▶).
Figure 2.
Structural comparisons between mPERK KD and PKR KD. (a) Superimposition of the mPERK KD N-lobe (gold) with the active PKR KD N-lobe (silver). The N-termini of mPERK KD and PKR KD are labeled. Helix αC2 in mPERK KD is also labeled. The disordered regions are represented by dashed lines. (b) Superimposition of mPERK KD C-lobe with active PKR KD C-lobe (left) and inactive PKR KD C-lobe (right). mPERK molecules are colored gold and PKR molecules are colored silver. Phosphorylated Thr residues are shown as ball-and-stick models. The missing parts of the mPERK activation loop are indicated by dashed lines.
The C-lobe structure of mPERK KD is similar to that of the active PKR monomer in the crystal structure (Fig. 2b ▶), with an r.m.s.d. of 1.404 Å for main-chain atoms on superimposition of 155 residues. The activation loops from both structures were phosphorylated at the conserved Thr residue. However, the activation loop of PERK KD is less ordered than that of the active PKR KD in complex with eIF2α. 15 residues (residues 964–977 and 984) in the activation loop of PERK KD are missing in the electron-density map, while the activation loop in the active PKR is ordered in the structure. Helix αG in PERK KD has the same position and orientation as helix αG in PKR KD, which provides the docking site for eIF2α binding. Comparison between the C-lobes of mPERK KD and inactive PKR KD revealed significant differences (Fig. 2b ▶). The activation loop is fully disordered in the inactive PKR KD. Helix αG is also disordered and missing from the electron-density map. In the inactive conformation, the activation loop and helix αG of PERK (or αG of PKR) are disordered. Upon autophosphorylation at the activation loop, the activation loop is partially stabilized and helix αG of PERK (or αG of PKR) becomes ordered and ready for eIF2α binding. eIF2α binding may further stabilize the activation loop.
3.3. The role of phosphorylated Thr980 in mPERK
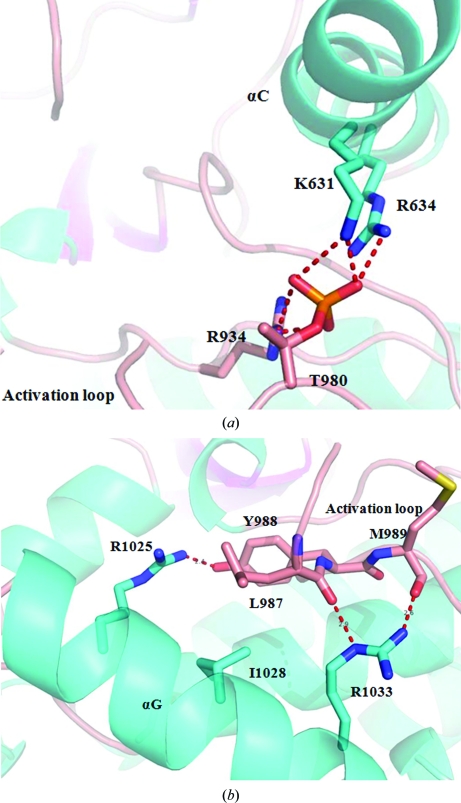
It has been reported that phosphorylation of Thr446 is essential for substrate recognition by PKR (Dey et al., 2005 ▶). The structure of the PERK kinase domain provided strong evidence that phosphorylation of the homologous residue Thr980 also contributes to the stability of the activation loop and the putative substrate-binding helix αG in PERK. The important contacts of PERK pThr980 and PKR pThr446 are conserved. The phosphate moiety of Thr980 forms charge–charge interactions with the side chains of two residues Lys631 and Arg634 from helix αC and the side chain of Arg934 from the C-lobe (Fig. 3 ▶ a). These interactions can partially stabilize the activation loop. The stabilized activation loop may subsequently fix the position and orientation of helix αG, which is the docking site for eIF2α, through a number of interactions (Fig. 3 ▶ b). These interactions include charge–charge interactions between Arg1025 from helix αG and Tyr988 from the activation loop, hydrogen bonds between Arg1033 in helix αG and the backbone carbonyl groups of Leu987 and Met989 from the activation loop, and hydrophobic interactions among Leu987, Tyr988 and Ile1028 (Fig. 3 ▶ b).
Figure 3.
Stabilization of the activation loop and helix αG by the phosphorylated Thr980. Ribbon representations of loops and helices are colored pink and cyan, respectively. (a) The activation loop can be stabilized by the charged interactions formed by the phosphate moiety of Thr980 and three basic residues: Lys631, Arg634 and Arg934. All residues involved in the interactions are shown as ball-and-stick models. (b) Helix αG is stabilized by its interactions with the activation loop. All residues involved in the interactions are shown as ball-and-stick models.
3.4. Model for mPERK KD autophosphorylation and PERK pathway activation
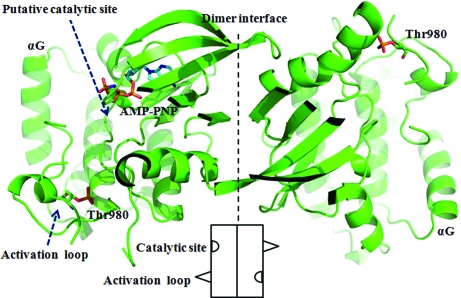
Studies of PKR catalytic activity indicate that autophosphorylation of the activation loop in PKR may occur in an intermolecular manner (Kostura & Mathews, 1989 ▶; Lemaire et al., 2005 ▶; Ortega et al., 1996 ▶; Thomis & Samuel, 1995 ▶). This mechanism may be shared amongst all eIF2α family members, including PERK. Based on the known PKR–AMP-PNP complex structure (Dar et al., 2005 ▶), we manually modeled an AMP-PNP molecule into the structure of mPERK KD. The binding site for AMP-PNP in mPERK might represent the putative catalytic site (Fig. 4 ▶). The back-to-back dimer structure of PERK KD that we have determined indicates that intradimer phosphorylation of the activation loop is unlikely. Instead, two PERK homodimers may approach each other and interdimer transphosphorylation could then take place. One PERK homodimer can insert its flexible activation loop into the catalytic site of the adjacent homodimer. A similar transphosphorylation mechanism has been proposed based on structural studies of IRE1 (Korennykh et al., 2009 ▶).
Figure 4.
mPERK KD may use interdimer interactions to perform autophosphorylation. The catalytic C-lobes within the PERK homodimer are shown in this figure. One AMP-PNP molecule has been manually modeled into one mPERK protomer and is shown as a ball-and-stick model. The putative catalytic site is indicated by the arrow. A cartoon drawing of the mPERK KD dimer is also shown at the bottom of the figure.
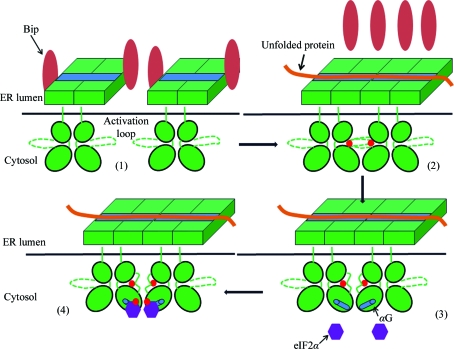
This model can be utilized to explain the activation mechanism of the PERK pathway by combining knowledge of the PERK luminal domain and PERK KD. The PERK luminal domain may associate with the ER chaperone Bip under nonstressed conditions and this association can be disrupted by ER stress (Bertolotti et al., 2000 ▶; Ma et al., 2002 ▶). The misfolded protein can bind multiple PERK luminal domains through the MHC-like groove on the surface of the luminal domain dimer and trigger the stacking of PERK dimers. The misfolded protein can therefore ‘line up’ the PERK dimers along the polypeptide. This lining up of PERK dimers will bring the flexible activation loop of one dimer close to the catalytic site of the adjacent dimer and cause phosphorylation of Thr980 (Fig. 5 ▶).
Figure 5.
The ‘line-up’ model for PERK pathway activation. (1) Inactive PERK dimers associate with the ER chaperone Bip under nonstressed conditions. (2) Unfolded protein (solid red line) binds the PERK luminal domain dimers through the MHC-like grooves (blue bars) and lines them up. Bip molecules are released from PERK and the activation loops within PERK KD are phosphorylated in a trans-interdimer fashion. The phosphate group is indicated by the solid red circle. (3) Phosphorylation of the activation loop stabilizes both the loop itself and helix αG in the C-lobe. The active PERKs are ready for substrate binding. (4) eIF2α is recruited by the activated PERK and phosphorylated at the Ser51 position by PERK KD.
eIF2α kinase-family members such as PERK, PKR and GCN2 may form stable homodimers in solution. ER stress may induce oligomerization of the PERK homodimers for signal transduction in vivo. In contrast, the other ER stress sensor IRE1 cytosolic domain may form an equilibrium between monomers, dimers and higher oligomers in solution. It has been suggested that ER stress may drive dimer formation of the IRE1 cytosolic kinase/RNAse domain to initiate the signaling pathway (Credle et al., 2005 ▶; Korennykh et al., 2009 ▶).
Supplementary Material
PDB reference: PERK kinase domain, 3qd2
Acknowledgments
We are grateful to the staff scientists at the APS SER-CAT and GM-CAT beamlines for their help in data collection. This work was supported by grants from NIH (R01 GM65959) and the Army Research Office (51894LS) to BS.
References
- Aragón, T., van Anken, E., Pincus, D., Serafimova, I. M., Korennykh, A. V., Rubio, C. A. & Walter, P. (2009). Nature (London), 457, 736–740. [DOI] [PMC free article] [PubMed]
- Bartoszewski, R., Rab, A., Jurkuvenaite, A., Mazur, M., Wakefield, J., Collawn, J. F. & Bebok, Z. (2008). Am. J. Respir. Cell Mol. Biol. 39, 448–457. [DOI] [PMC free article] [PubMed]
- Bernales, S., Papa, F. R. & Walter, P. (2006). Annu. Rev. Cell Dev. Biol. 22, 487–508. [DOI] [PubMed]
- Bertolotti, A., Zhang, Y., Hendershot, L. M., Harding, H. P. & Ron, D. (2000). Nature Cell Biol. 2, 326–332. [DOI] [PubMed]
- Chen, J. J., Crosby, J. S. & London, I. M. (1994). Biochimie, 76, 761–769. [DOI] [PubMed]
- Cox, J. S. & Walter, P. (1996). Cell, 87, 391–404. [DOI] [PubMed]
- Credle, J. J., Finer-Moore, J. S., Papa, F. R., Stroud, R. M. & Walter, P. (2005). Proc. Natl Acad. Sci. USA, 102, 18773–18784. [DOI] [PMC free article] [PubMed]
- Dar, A. C., Dever, T. E. & Sicheri, F. (2005). Cell, 122, 887–900. [DOI] [PubMed]
- Deng, J., Harding, H. P., Raught, B., Gingras, A. C., Berlanga, J. J., Scheuner, D., Kaufman, R. J., Ron, D. & Sonenberg, N. (2002). Curr. Biol. 12, 1279–1286. [DOI] [PubMed]
- Dever, T. E. (2002). Cell, 108, 545–556. [DOI] [PubMed]
- Dey, M., Cao, C., Dar, A. C., Tamura, T., Ozato, K., Sicheri, F. & Dever, T. E. (2005). Cell, 122, 901–913. [DOI] [PubMed]
- Dong, J., Qiu, H., Garcia-Barrio, M., Anderson, J. & Hinnebusch, A. G. (2000). Mol. Cell, 6, 269–279. [DOI] [PubMed]
- Hao, S., Sharp, J. W., Ross-Inta, C. M., McDaniel, B. J., Anthony, T. G., Wek, R. C., Cavener, D. R., McGrath, B. C., Rudell, J. B., Koehnle, T. J. & Gietzen, D. W. (2005). Science, 307, 1776–1778. [DOI] [PubMed]
- Harding, H. P., Zhang, Y., Bertolotti, A., Zeng, H. & Ron, D. (2000). Mol. Cell, 5, 897–904. [DOI] [PubMed]
- Harding, H. P., Zhang, Y. & Ron, D. (1999). Nature (London), 397, 271–274. [DOI] [PubMed]
- Kimata, Y., Ishiwata-Kimata, Y., Ito, T., Hirata, A., Suzuki, T., Oikawa, D., Takeuchi, M. & Kohno, K. (2007). J. Cell Biol. 179, 75–86. [DOI] [PMC free article] [PubMed]
- Koong, A. C., Chauhan, V. & Romero-Ramirez, L. (2006). Cancer Biol. Ther. 5, 756–759. [DOI] [PubMed]
- Korennykh, A. V., Egea, P. F., Korostelev, A. A., Finer-Moore, J., Zhang, C., Shokat, K. M., Stroud, R. M. & Walter, P. (2009). Nature (London), 457, 687–693. [DOI] [PMC free article] [PubMed]
- Kostura, M. & Mathews, M. B. (1989). Mol. Cell. Biol. 9, 1576–1586. [DOI] [PMC free article] [PubMed]
- Kudo, T., Katayama, T., Imaizumi, K., Yasuda, Y., Yatera, M., Okochi, M., Tohyama, M. & Takeda, M. (2002). Ann. N. Y. Acad. Sci. 977, 349–355. [DOI] [PubMed]
- Lee, K. P., Dey, M., Neculai, D., Cao, C., Dever, T. E. & Sicheri, F. (2008). Cell, 132, 89–100. [DOI] [PMC free article] [PubMed]
- Lemaire, P. A., Lary, J. & Cole, J. L. (2005). J. Mol. Biol. 345, 81–90. [DOI] [PubMed]
- Ma, K., Vattem, K. M. & Wek, R. C. (2002). J. Biol. Chem. 277, 18728–18735. [DOI] [PubMed]
- Ma, Y. & Hendershot, L. M. (2004). Nature Rev. Cancer, 4, 966–977. [DOI] [PubMed]
- Marciniak, S. J., Garcia-Bonilla, L., Hu, J., Harding, H. P. & Ron, D. (2006). J. Cell Biol. 172, 201–209. [DOI] [PMC free article] [PubMed]
- Nanduri, S., Rahman, F., Williams, B. R. & Qin, J. (2000). EMBO J. 19, 5567–5574. [DOI] [PMC free article] [PubMed]
- Ortega, L. G., McCotter, M. D., Henry, G. L., McCormack, S. J., Thomis, D. C. & Samuel, C. E. (1996). Virology, 215, 31–39. [DOI] [PubMed]
- Padyana, A. K., Qiu, H., Roll-Mecak, A., Hinnebusch, A. G. & Burley, S. K. (2005). J. Biol. Chem. 280, 29289–29299. [DOI] [PubMed]
- Papa, F. R., Zhang, C., Shokat, K. & Walter, P. (2003). Science, 302, 1533–1537. [DOI] [PubMed]
- Ron, D. & Walter, P. (2007). Nature Rev. Mol. Cell Biol. 8, 519–529. [DOI] [PubMed]
- Shamu, C. E. & Walter, P. (1996). EMBO J. 15, 3028–3039. [PMC free article] [PubMed]
- Sood, R., Porter, A. C., Ma, K., Quilliam, L. A. & Wek, R. C. (2000). Biochem. J. 346, 281–293. [PMC free article] [PubMed]
- Thomis, D. C. & Samuel, C. E. (1995). J. Virol. 69, 5195–5198. [DOI] [PMC free article] [PubMed]
- Ung, T. L., Cao, C., Lu, J., Ozato, K. & Dever, T. E. (2001). EMBO J. 20, 3728–3737. [DOI] [PMC free article] [PubMed]
- Zhang, F., Romano, P. R., Nagamura-Inoue, T., Tian, B., Dever, T. E., Mathews, M. B., Ozato, K. & Hinnebusch, A. G. (2001). J. Biol. Chem. 276, 24946–24958. [DOI] [PubMed]
- Zheng, Y., Gao, B., Ye, L., Kong, L., Jing, W., Yang, X., Wu, Z. & Ye, L. (2005). J. Microbiol. 43, 529–536. [PubMed]
Associated Data
This section collects any data citations, data availability statements, or supplementary materials included in this article.
Supplementary Materials
PDB reference: PERK kinase domain, 3qd2


