A crystal of a swine MHC class I molecule diffracted to 2.2 Å resolution and belonged to space group P212121, with unit-cell parameters a = 66.1, b = 74.1, c = 98.6 Å; it contained one molecule in the asymmetric unit. The Matthews coefficient and the solvent content were calculated to be 2.74 Å3 Da−1 and 55.17%, respectively.
Keywords: MHC class I molecules, swine, SLA-I, SLA-1*1502
Abstract
In order to illustrate the structure of the swine MHC class I (SLA-I) molecule and to evaluate the cytotoxic T lymphocyte (CTL) response against porcine reproductive and respiratory syndrome virus (PRRSV), the ternary complex of the SLA-I molecule termed SLA-1*1502 with β2-microglobulin and the CTL epitope TMPPGFELY (PRRSV-NSP9TY9) derived from PRRSV nonstructural protein 9 (residues 198–206) was assembled and crystallized. The crystal diffracted X-rays to 2.2 Å resolution and belonged to space group P212121, with unit-cell parameters a = 66.1, b = 74.1, c = 98.6 Å; it contained one molecule in the asymmetric unit. The Matthews coefficient and the solvent content were calculated to be 2.74 Å3 Da−1 and 55.17%, respectively. The results will be helpful in obtaining insight into the structural basis of the presentation of viral epitopes by SLA-I.
1. Introduction
Major histocompatibility complex (MHC) class I molecules play an important role in the elimination of intracellular pathogens (Klein et al., 1993 ▶). MHC class I molecules are membrane-surface proteins and their main function is defined as the binding and presentation of viral epitopes on the surface of virally infected cells. Subsequently, cytotoxic T lymphocytes (CTLs) first recognize the viral epitopes via specific T-cell receptors (TCRs) and then lyse the infected cells (Garboczi et al., 1996 ▶). The MHC class I molecule consists of three components: a polymorphic heavy chain (α chain), a monomorphic light chain (β2-microglobulin; β2m) and an epitope of 8–11 amino-acid residues positioned in a cleft formed by the α1 and α2 domains of the heavy chain (Madden, 1995 ▶). Analysis of MHC class I structures is essential in order to understand the details of antigen presentation in CTL immunity. Swine MHC class I genes termed swine leukocyte antigen class I (SLA-I) are located in the 7p1.1 band of the short arm of chromosome 7 (Smith et al., 1995 ▶). There are three constitutively expressed classical swine MHC class I genes in the genome, namely SLA-1, SLA-2 and SLA-3. As in humans and mice, MHC class I molecules and SLA-I molecules are critical to antiviral responses in swine (Ho et al., 2009 ▶).
PRRSV is a single-stranded positive RNA virus of the Arteriviridae family which can result in reproductive failure in pregnant sows or respiratory complications. Porcine reproductive and respiratory syndrome (PRRS) emerged in North America in 1987 (Elazhary et al., 1991 ▶) and the disease was subsequently found in Europe and Asia. Currently, PRRS is spreading worldwide in swine-cultivating countries and has resulted in devastating economic losses (Tian et al., 2007 ▶). Previous research on PRRSV suggested that CTL immunity may play a central role in viral clearance (Lamontagne et al., 2003 ▶). However, little is known about the three-dimensional structure of SLA-I and antiviral studies for viruses such as PRRSV in swine are limited. In this article, we report the refolding, purification and crystallization of SLA-I (SLA-1*1502) with a CTL epitope.
2. Materials and methods
2.1. Preparation of SLA-1*1502 and β2m proteins
SLA-1*1502 heavy-chain cDNA (GenBank accession No. HQ909439, residues 1–275) was amplified by RT-PCR from a specific pathogen-free (SPF) swine. The SLA-1*1502 gene was ligated into the pET21a expression vector and transformed into Escherichia coli strain BL21 (DE3). The expression vector pET21a/swine β2m (sβ2m; residues 1–98; GenBank accession No. BAG32341) was constructed previously in our laboratory and was also transformed into E. coli strain BL21 (DE3). The recombinant proteins were both expressed as inclusion bodies (Zhang et al., 2010 ▶). The bacteria were harvested and suspended in cold phosphate-buffered saline (PBS). After sonication, the samples were centrifuged at 16 000g and the pellets were washed three times with a solution consisting of 20 mM Tris–HCl pH 8.0, 100 mM NaCl, 1 mM EDTA, 1 mM DTT and 0.5% Triton X-100. SLA-1*1502 heavy chain and sβ2m inclusion bodies were dissolved in guanidinium chloride (Gua–HCl) buffer [6 M Gua–HCl, 50 mM Tris–HCl pH 8.0, 10 mM EDTA, 100 mM NaCl, 10%(v/v) glycerine, 10 mM DTT].
2.2. Preparation of the SLA-1*1502 complex
The SLA-1*1502–PRRSV-NSP9TY9 complex was prepared essentially as described previously by Garboczi et al. (1992 ▶) with modifications introduced in our laboratory (Zhang et al., 2010 ▶). Firstly, the eptitope PRRSV-NSP9TY9 (TMPPGFELY) derived from PRRSV nonstructural protein 9 (PRRSV-NSP9) residues 198–206 was dissolved in dimethyl sulfoxide (DMSO). The PRRSV-NSP9TY9 eptitope and the SLA-1*1502 and sβ2m inclusion bodies were then refolded in a 3:1:1 molar ratio using the gradual solution method. After incubation for 24 h at 277 K, the soluble portion was concentrated and purified by chromatography on a Superdex 200 16/60 HiLoad (GE Healthcare) size-exclusion column followed by Resource Q (GE Healthcare) anion-exchange chromatography.
2.3. Crystallization of the SLA-1*1502 complex
The purified complex (∼44 kDa) was dialyzed against crystallization buffer (20 mM Tris–HCl pH 8.0, 50 mM NaCl) and concentrated to 12 mg ml−1. Crystallization trials were set up with Index and Crystal Screen (Hampton Research) at 277 and 291 K using the hanging-drop method (Zhang et al., 2010 ▶). Two drops containing equal volumes of protein solution (at 6 and 12 mg ml−1) and reservoir crystallization buffer (1 µl each) were placed over a well containing 200 ml reservoir solution using a VDX plate (HR3-142, Hampton Research). Using a protein concentration of 12 mg ml−1, crystals were obtained in 10–14 d using Index solution No. 65 (0.1 M ammonium acetate, 0.1 M Bis-Tris pH 5.5, 17% PEG 10 000) at 277 K.
2.4. Data collection and processing
Diffraction data were collected to 2.2 Å resolution using an in-house X-ray source (Rigaku MicroMax-007 desktop rotating-anode X-ray generator with a Cu target operated at 40 kV and 30 mA) and an R-AXIS IV++ imaging-plate detector at a wavelength of 1.5418 Å. The crystal was first soaked in reservoir solution containing 25% glycerol as a cryoprotectant for several seconds and then flash-cooled in a stream of gaseous nitrogen at 100 K (Parkin & Hope, 1998 ▶). The collected intensities were indexed, integrated, corrected for absorption, scaled and merged using HKL-2000 (Otwinowski & Minor, 1997 ▶).
2.5. Alignment of SLA-1*1502 with human and mouse MHC class I molecules
The amino-acid sequence of SLA-1*1502 was aligned with those of typical SLA-1, SLA-2, SLA-3, human and mouse MHC class I molecules. The GenBank accession Nos. are as follows: SLA-1*1502, HQ909439; SLA-1*0101, FJ952938; SLA-2*0201, EU432086; SLA-3*0302, EU432097; HLA-A2, U56825; H-2Kb, V00746. Alignment was performed using the DNAMAN v.5.2.2 program (Lynnon Biosoft).
3. Results and discussion
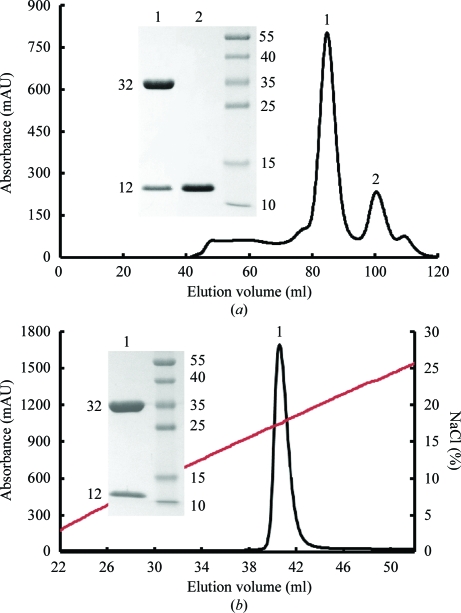
Based on the NetMHCpan 2.0 server (http://www.cbs.dtu.dk/services/NetMHCpan; Hoof et al., 2009 ▶), we synthesized a series of potential epitopes for the SLA-1*1502 allele and validated the CTL function of PRRSV-NSP9TY9. SLA-1*1502 could be refolded in the presence of sβ2m and PRRSV-NSP9TY9. Refolding resulted in an approximately 12% yield of the correctly folded complex (∼44 kDa), which could be purified to homogeneity by Superdex 200 16/60 HiLoad size-exclusion chromatography and Resource Q anion-exchange chromatography (Fig. 1 ▶). The chromatographic elution profile showed two peaks corresponding to the refolded complex (peak 1, ∼44 kDa) and sβ2m (peak 2) (Fig. 1 ▶ a). The refolded complex was further purified by Resource Q anion-exchange chromatography and eluted at an NaCl concentration of 16.6–20.2% (Fig. 1 ▶ b). The refolded complex was confirmed by SDS–PAGE (see inset in Fig. 1 ▶). SDS–PAGE analysis showed two bands corresponding to the expected molecular weights of SLA-1*1502 (∼32 kDa) and sβ2m (∼12 kDa).
Figure 1.
Purification of the refolded SLA-I complex (SLA-1*1502, sβ2m and the epitope PRRSV-NSP9TY9) by FPLC Superdex 200 16/60 Hi-Load gel-filtration and Resource Q anion-exchange chromatography (GE Healthcare). (a) Gel-filtration profile of the refolded products. Peak 1 represents the correctly refolded complex (∼44 kDa) and peak 2 represents sβ2m. Inset: reduced SDS–PAGE gel (15%) for peak 1 and peak 2. The right column contains molecular-weight markers (kDa). (b) Results of further purification of the refolded products by anion-exchange chromatography. Peak 1 represents the SLA-I complex, which was eluted at an NaCl concentration of 16.6–20.2%. Inset: reduced SDS–PAGE gel (15%) for peak 1.
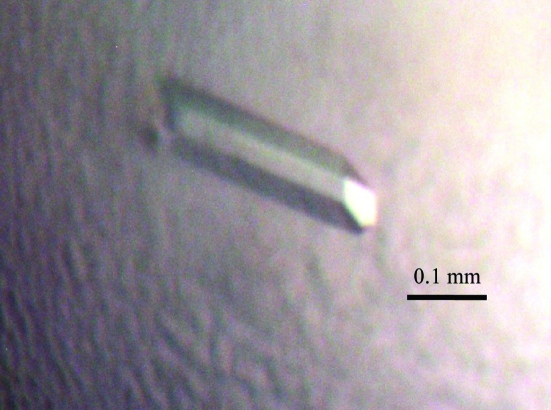
After purification and concentration, the SLA-1*1502–PRRSV-NSP9TY9 complex was set up for crystal screening. A large single crystal (Fig. 2 ▶) appeared in 10–14 d under the initial conditions. The crystal belonged to space group P212121, with unit-cell parameters a = 66.1, b = 74.1, c = 98.6 Å, and diffracted to 2.2 Å resolution. The crystal was estimated to contain one molecule in the asymmetric unit and the Matthews coefficient value V M was 2.74 Å3 Da−1, with a calculated solvent content of 55.17%. Selected data statistics are shown in Table 1 ▶.
Figure 2.
Photograph of the crystal used in the diffraction analysis.
Table 1. X-ray diffraction data and processing statistics.
Values in parentheses are for the highest resolution shell.
| Space group | P212121 |
| Unit-cell parameters (Å) | a = 66.1, b = 74.1, c = 98.6 |
| Resolution range (Å) | 50.00–2.20 (2.28–2.20) |
| Total No. of reflections | 197524 |
| No. of unique reflections | 24678 |
| Completeness (%) | 99.5 (98.9) |
| Average I/σ(I) | 27.4 (7.5) |
| Rmerge† (%) | 8.3 (28.6) |
| Average multiplicity | 7.9 (7.9) |
R
merge = 
 , where Ii(hkl) is the observed intensity and 〈I(hkl)〉 is the average intensity from multiple measurements.
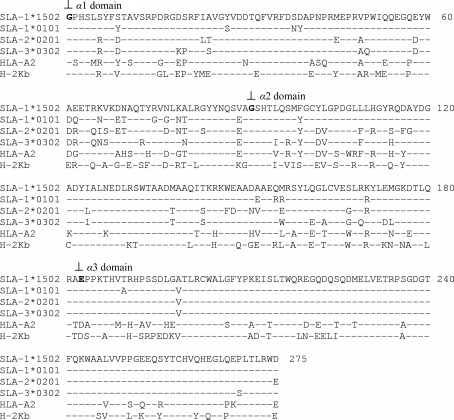
A multiple amino-acid sequence alignment of SLA-1*1502 with other known swine, human and mouse class I MHCs is shown in Fig. 3 ▶. SLA-1*1502 has 92.36, 85.82 and 87.27% sequence identity to the other SLA-Is (SLA-1, SLA-2 and SLA-3, respectively) and has 72.73 and 66.18% sequence identity to human and mouse class I MHCs, respectively. The sequence identities show that there is an obvious species difference between the swine, human and mouse molecules.
Figure 3.
Amino-acid alignment of SLA-1*1502 and other MHC class I molecules. GenBank accession Nos. are as follows: SLA-1*1502, HQ909439; SLA-1*0101, FJ952938; SLA-2*0201, EU432086; SLA-3*0302, EU432097; HLA-A2, U56825; H-2Kb, V00746. ‘–’ indicates identity with SLA-1*1502 and ‘⊥’ indicates the starting locations of the α1, α2 and α3 domains.
Acknowledgments
This work was supported by grants from the Ministry of Science and Technology of China (grant No. 2009ZX08009-150B) and the National Key Basic Research Program of China (973 Program, 2007CB815805). We thank Professor George F. Gao (Institute of Microbiology, Chinese Academy of Sciences) for helpful suggestions. The authors declare no competing financial interests.
References
- Elazhary, Y., Weber, J., Bikour, H., Morin, M. & Girard, C. (1991). Vet. Rec. 129, 495–496. [DOI] [PubMed]
- Garboczi, D. N., Ghosh, P., Utz, U., Fan, Q. R., Biddison, W. E. & Wiley, D. C. (1996). Nature (London), 384, 134–141.
- Garboczi, D. N., Hung, D. T. & Wiley, D. C. (1992). Proc. Natl Acad. Sci. USA, 89, 3429–3433. [DOI] [PMC free article] [PubMed]
- Ho, C.-S., Lunney, J. K., Ando, A., Rogel-Gaillard, C., Lee, J.-H., Schook, L. B. & Smith, D. M. (2009). Tissue Antigens, 73, 307–315. [DOI] [PubMed]
- Hoof, I., Peters, B., Sidney, J., Pedersen, L. E., Sette, A., Lund, O., Buus, S. & Nielsen, M. (2009). Immunogenetics, 61, 1–13. [DOI] [PMC free article] [PubMed]
- Klein, J., Satta, Y., O’hUigin, C. & Takahata, N. (1993). Annu. Rev. Immunol. 11, 269–295. [DOI] [PubMed]
- Lamontagne, L., Pagé, C., Larochelle, R. & Magar, R. (2003). Viral Immunol. 16, 395–406. [DOI] [PubMed]
- Madden, D. R. (1995). Annu. Rev. Immunol. 13, 587–622. [DOI] [PubMed]
- Otwinowski, Z. & Minor, W. (1997). Methods Enzymol. 276, 307–326. [DOI] [PubMed]
- Parkin, S. & Hope, H. (1998). J. Appl. Cryst. 31, 945–953.
- Smith, T. P., Rohrer, G. A., Alexander, L. J., Troyer, D. L., Kirby-Dobbels, K. R., Janzen, M. A., Cornwell, D. L., Louis, C. F., Schook, L. B. & Beattie, C. W. (1995). Genome Res. 5, 259–271. [DOI] [PubMed]
- Tian, K. et al. (2007). PLoS One, 2, e526. [DOI] [PMC free article] [PubMed]
- Zhang, J., Chen, Y., Gao, F., Chen, W., Qi, J. & Xia, C. (2010). Acta Cryst. F66, 99–101. [DOI] [PMC free article] [PubMed]


