

Abstract
Purpose
In this study, we investigated the labeling efficiency and magnetic resonance imaging (MRI) signal sensitivity of a newly synthesized, nano-sized iron oxide particle (IOP) coated with polyethylene glycol (PEG), designed by Industrial Technology Research Institute (ITRI).
Procedures
Macrophages, bone-marrow-derived dendritic cells, and mesenchymal stem cells (MSCs) were isolated from rats and labeled by incubating with ITRI-IOP, along with three other iron oxide particles in different sizes and coatings as reference. These labeled cells were characterized with transmission electron microscopy (TEM), light and fluorescence microscopy, phantom MRI, and finally in vivo MRI and ex vivo magnetic resonance microscopy (MRM) of transplanted hearts in rats infused with labeled macrophages.
Results
The longitudinal (r1) and transverse (r2) relaxivities of ITRI-IOP are 22.71 and 319.2 s−1 mM−1, respectively. TEM and microscopic images indicate the uptake of multiple ITRI-IOP particles per cell for all cell types. ITRI-IOP provides sensitivity comparable or higher than the other three particles shown in phantom MRI. In vivo MRI and ex vivo MRM detect punctate spots of hypointensity in rejecting hearts, most likely caused by the accumulation of macrophages labeled by ITRI-IOP.
Conclusion
ITRI-IOP, the nano-sized iron oxide particle, shows high efficiency in cell labeling, including both phagocytic and non-phagocytic cells. Furthermore, it provides excellent sensitivity in T2*-weighted MRI, and thus can serve as a promising contrast agent for in vivo cellular MRI.
Keywords: Iron oxide particles, ITRI-IOP, Cells, In vitro labeling, Cellular MRI, Rat heart transplant model
Introduction
Cellular magnetic resonance imaging (MRI) is a rapidly growing field that aims to visualize and track cells in living organisms [1–3]. Iron-oxide-based cellular MRI is one of the most sensitive techniques for tracking cells and monitoring cell therapies [4–7]. Because of the high-magnetic susceptibility effect induced by iron, labeled cells can be distinguished from the surrounding tissues as areas of hypointensity or dark spots on T2*-weighted magnetic resonance (MR) images. The hypointense image contrast, or the susceptibility effect, is dependent on the amount of iron in each labeled cell, as well as the number and distribution of labeled cells.
There have been numerous studies using a variety of iron oxide particles to label and track cells in vivo by MRI. Dendritic cells [6], progenitor cells [7], stem cells [8], tumor cells [9], and macrophages [10–14], have all been labeled with nano-sized ultrasmall superparamagnetic iron oxide (USPIO; ≤30 nm in diameter) or superparamagnetic iron oxide (SPIO; 30–200 nm in diameter) particles to monitor their migration and bio-distribution after implantation or intravenous infusion in animals or humans. Recently, micron-sized superparamagnetic iron oxide (MPIO) particles have gained attention for detecting single cells in vivo by MRI, because each MPIO has a high iron content, and phagocytic cells can be efficiently labeled and distinguished by ingesting much fewer MPIO compared with smaller size particles [2, 15, 16].
There are two strategies to label cells for MRI detection. One is clinical convenient in vivo or in situ labeling of direct intravenous infusing of iron oxide particles, which mainly labels the phagocytic cells in the reticuloendothelial system (RES). The other one is in vitro labeling, namely, isolates target cells, labels them in culture, and implants them back. The latter fits all kind of cell types, particularly for these non-phagocytic cells, such as stem cells, that cannot be readily labeled in the RES system in situ. In vitro labeling also ensures high cell specificity, high iron internalization in single cells and thus more sensitive for MRI, because each cell is exposed to more intense iron concentration compared with the in vivo labeling environment. Furthermore, in vitro labeling can provide straightforward information on labeling efficiency and the quantitative iron content in each cell.
The labeling efficiency and intracellular iron content are determined by the cell types and the properties of iron oxide particles including the size, surface coating, and charge. For the commonly used and clinically applicable USPIO or SPIO, it is still relatively difficult to obtain a high-enough intracellular iron content to visualize labeled cells in vivo, especially for the non-phagocytic cells and the in vivo labeling strategy. To increase the sensitivity of MRI in detecting both phagocytic and non-phagocytic cells, a lot of efforts have been devoted to amplify the intracellular iron uptake through in vitro labeling. Extra procedures, such as HIV-TAT peptide [17], transfection agents [8, 18], receptor-mediated endocytosis [19], or electroporation [20, 21], have been applied to facilitate the cell labeling. It is highly desirable to have an iron oxide particle that can readily label different cell types by simple co-incubation and also provide sensitive cellular MRI signal.
In this study, we have investigated the labeling efficiency and MR signal sensitivity of a newly synthesized, poly-ethylene glycol (PEG)-coated, nano-sized iron oxide particle (IOP) [22], which exhibits high transverse relaxivity and can serve as a very promising T2* contrast agent for cellular MRI. Both phagocytic macrophages and dendritic cells, as well as non-phagocytic bone-marrow-derived mesenchymal stem cells (MSCs) isolated from rat were labeled in vitro with ITRI-IOP without the use of transfection agents or electroporation. The labeling efficiency and MRI signal sensitivity were compared with cells labeled with other commonly used iron oxide particles. Furthermore, using a rat heart transplantation model of acute rejection, the accumulation of macrophages labeled with ITRI-IOP was detected at the rejecting sites by in vivo MRI, providing image sensitivity comparable to that of MPIO.
Materials and Methods
Iron Oxide Particles
PEG-coated ITRI-IOP was designed and synthesized at the Industrial Technology Research Institute (ITRI), Taiwan [22]. Briefly, 0.056 mol of FeCl2·4H2O plus 0.11 mol of FeCl3·6H2O and 400 mL of deionized water were stirred in a three-necked flask at 300 rpm and 25°C. 1 N (500 mL) NaOH solution was added. When the pH value reached 11–12, oleic acid was added and stirred for 30 min. A 6 N–HCl solution was then slowly added to adjust the pH value to about 1, precipitating oleic-acid-encapsulated iron oxide particles. The precipitate was collected, washed with deionized water eight to ten times to remove excess oleic acid, and dried under vacuum. The dried solid was redissolved in toluene and centrifuged at 6,000 rpm for 15 min. The dark solution was collected, and the residual solid was discarded. The oleic acid–iron-oxide solution was transferred into a 1,000-mL round bottom flask. Then, methoxy-PEG (molecular weight of 2 kDa, 0.4 mol) and N-methyl–2-pyrrolidone (250 mL) were put in, and the flask was placed under vacuum (20 Torr) for more than 2 h. Next, 0.48 mol of succinic anhydride and 0.159 mol of 4-dimethylamino-pyridine were added for reaction at 30°C for 2 days. After being cooled to room temperature, 0.48 mol of thionyl chloride was added, and the mixture was stirred for 2–3 h. Triethylamine (0.96 mol) was added to the solution, followed by 0.4 mol of 3-aminopropyl triethoxysilane, and the mixture was reacted overnight. The mixture was filtered to remove the precipitates, and the filtrate was precipitated with cold ether. The solid was dried under vacuum to produce a light brownish powder of ITRI-IOP.
The micron-sized MPIO particles (Catalog No. MC05F, labeled as 0.9 μm) were purchased from Bangs Laboratories (Fishers, IN). These particles consist of a styrene-divinyl benzene inert polymer microsphere containing a magnetite core as well as a fluorescent dye (Dragon Green). The SPIO particle, Feridex, was purchased from either Berlex (Montville, NJ) or Bayer HealthCare Pharmaceuticals Inc. (Wayne, NJ). The dextran-coated USPIO particles were synthesized in our laboratory as described previously [23]. The particles were prepared for cell labeling by washing with phosphate-buffered saline (PBS) followed by re-suspension in PBS at 1.0 mg Fe/mL.
Measurement of Particle Size
The iron core size of ITRI-IOP was determined by transmission electron microscopy (TEM; JEOL, 2100F, Japan). The hydrodynamic diameters of the iron oxide particles were measured using a Zetasizer Nano-z (Malvern Instruments, Malvern, UK) through dynamic light scattering (DLS). The iron concentration of all four types of particles was adjusted to approximately 0.01 mg/mL for the DLS measurements. Particularly, MPIO particles were measured immediately after being mixed by vortex. The size of ITRI-IOP particles was obtained in the same manner, but diluted in distilled water instead of PBS. The values reported for all samples are the peak intensity values.
Magnetic Resonance Relaxometry
The longitudinal relaxation time (T1) and transverse relaxation time (T2) were measured using a Bruker Minispec mq20 NMR Analyzer (20 MHz) at iron concentrations of 5–40 μg/mL for ITRI-IOP, 10–100 μg/mL for Feridex and USPIO, and 20–180 μg/mL for MPIO (measured immediately after vortexing) in water solution. The T1 and T2 values of pure water were also measured and included into the two-variable linear fit of relaxivity to generate very similar fitting intercepts (close to the relaxation rates of pure water) for all four types of iron oxide particles. The MR probe temperature was set at 25°C. T1 measurements were performed by collecting 13-data points with inversion time starting from 2 ms using inversion recovery prepared spin-echo sequence. T2 measurements were made by spin-echo sequence with the echo spacing of 0.12 ms. Both T1 and T2 were calculated by a mono-exponential fit. All T1 and T2 values were measured three times and averaged. The longitudinal (r1) and transverse (r2) relaxivities of the iron oxide particles were obtained as the slopes of the linear regression of the longitudinal relaxation rate R1 (1/T1) or transverse relaxation rate R2 (1/T2) versus iron concentration, with the intercepts as close to the relaxation rates of free water as possible, while maintaining the best correlation coefficient at the same time given the systematic and random errors in the T1 and T2 measurements.
Animals
Inbred Brown Norway (BN; RT1n) and Dark Agouti (DA; RT1a) rats were obtained from Harlan Laboratories Inc. (Indianapolis, IN). All rats used in the experiments were male, 2 to 3 months of age, and weighed 270–280 g. Animals were housed individually and provided food and water ad libitum. Animal protocols were approved by the Institutional Animal Care and Use Committee of Carnegie Mellon University. All animals received humane care in compliance with the Guide for the Care and Use of Laboratory Animals, published by the National Institutes of Health (publication No. 96-03, revised 1996).
Cell Culture, Flow Cytometry Analysis, and Cell Labeling
Macrophages, dendritic cells, and MSCs were isolated from BN rats. For macrophages, the splenocytes were isolated by repeated division and perfusion of the spleens in a Petri dish. After the cells were separated from tissue using nylon mesh, the cell suspensions were initially centrifuged at 1,200 rpm for 6 min. Erythrocytes were then lysed by mixing the pellets with 2 mL of ACK (Hybri-Max® Sigma–Aldrich, St. Louis, MO) at room temperature for 3 min. The cells were then washed twice with PBS, re-suspended in RPMI complete medium (Gibco, LosAngeles, CA) at a concentration of 2 × 10⁶ cells/mL, and then plated on plastic culture flasks at 37°C, 5% CO2, and 85% humidity for 1 h. Macrophages were isolated by decanting the culture medium and non-adherent cells, washed three times with fresh culture medium, and then harvested by gentle dislodging using a plastic cell scraper in fresh culture medium.
Bone marrow cells were flushed from femurs and tibias of the rats and subjected to red blood cell lysis. The cells were then plated at a density of 2×10⁶ cells/mL in Petri dishes. Dendritic cells were generated in 10 mL of RPMI complete medium, supplemented with GM-CSF (1,000 U/mL), IL-4 (20 ng/mL), and TGF (20 ng/mL). Fresh medium and cytokines were added on day 4. On day 7, the non-adherent cells were collected, washed with PBS, and then continued to culture. We started the particles labeling for dendritic cells on day 9. MSCs that adhered to Petri dishes gradually proliferated to form colonies in Iscove’s modified Dulbecco’s medium (IMDM; Sigma–Aldrich Chemicals, St. Louis, MO), with 10% fetal bovine serum (Invitrogen, Carlsbad, CA), 100 U/mL penicillin G, 100 μg/mL streptomycin sulphate, and 0.25 μg/mL amphotericin B until they reached 80–90% confluence. The cells were then detached from the flasks by trypsinization, centrifuged at 1,600 rpm for 8 min and re-suspended in the medium for continuous culture until day 9.
Fluorescent-activated cell sorting (FACS) analysis was performed by flow cytometry (FACSCalibur, Becton Dickinson, Franklin Lakes, NJ) to examine the purity and phenotype of the cells studied. The cell suspension was adjusted to a concentration of 1×10⁶ cells/mL in PBS solutions containing 1% fetal bovine serum and 0.1% sodium azide. After adding monoclonal antibodies at a concentration recommended by the manufacture, 30 min of incubation at room temperature, and two washing steps, the samples were subjected to FACS analysis. The following fluorochrome-conjugated monoclonal antibodies were used: anti-rat ED1 (Cat#BM4000; Acris Antibodies GmbH, Herford, Germany) for macrophages; anti-CD11c (Becton Dickinson, Franklin Lakes, NJ) with anti-rat IgG isotype as control (Q5/13, Becton Dickinson, Franklin Lakes, NJ) for dendritic cells; and anti-CD166 (MAB1172), anti-CD105 (FAB1320P), anti-CD44 (FAB3660F), anti-CD29 Ab (FAB2405P), anti-MHC class I (FAB6118F), and anti-CD34 (FAB3346P) or an isotype-matched control (all from R&D system, Minneapolis, MN) for MSCs cells. The FACS for dendritic cells was performed on days 1, 3, 6, and 9 after plating and day 9 for MSCs.
The isolated macrophages, dendritic cells, and MSCs were each labeled with MPIO, Feridex, USPIO or ITRI-IOP iron oxide particles, respectively. 250 μg iron of various iron oxide particles was added to 10 mL of complete RPMI cell culture medium with a cell concentration of 2 × 10⁶ cells/mL and incubated overnight at 37°C, 5% CO2, and 85% humidity. The culture medium was then removed, and the labeled cells were gently rinsed three times with additional medium to remove the free particles. The cells were dislodged under medium, washed three times with PBS and re-suspended in PBS at designated concentrations for future experiments.
To determine the effect of culture time on the cell uptake of iron oxide particles, cells were incubated under otherwise identical culture conditions for periods of 2, 6, 12, 24, or 48 h with all four types of iron oxide particles. At each time point, approximately 2×10⁶ cells diluted in 1-mL culture medium were extracted for quantitative determination of iron content inside the cells using ferrozine-based spectrophotometry [24]. To further examine the cell characteristics after iron labeling, we have performed cell apoptosis analysis by propidium iodide staining [25] for macrophages labeled 24 or 48 h with ITRI-IOP. The viability of labeled and unlabeled (control) cells was evaluated by visible optical microscopy using trypan blue exclusion. Additionally, MTT assay of the macrophages and MSCs after being labeled with ITRI-IOP or any other three types of iron oxide particles at the determined optimal labeling time was also performed to test the cell viability and cytotoxicity of the contrast agents at iron concentrations of 25, 50, and 100 μg/mL, respectively [26]. At the same time, the cell labeling efficiency by all types of iron oxide particles was scrutinized under the light microscope. Perl’s Prussian blue staining for iron was also performed to examine the presence of iron in the labeled cells.
Light and Fluorescence Microscopy of the Labeled Cells
To further investigate the cell labeling efficiency of ITRI-IOP, anti-PEG staining was also performed for the ITRI-IOP labeled cells as follows. Cells labeled with ITRI-IOP were washed twice and incubated overnight with a 1:200 dilution of primary anti-PEG AGP3 antibody (SR-66, courtesy of Dr. Steve R. Roffler). The cells were then washed twice with PBS, followed by staining with a fluorescence-conjugated goat anti-mouse IgG (FITC conjugated) under a 30-min incubation for immunofluorescence microscopy. These slides were then examined with light and fluorescence microscope (Leica DM IRE2 and TRB; Leica, Wetzlar, Germany) under the same field of view.
Transmission Electron Microscopy of the Labeled Cells
To determine the incorporation and location of iron particles in the labeled cells, 2.5 × 10⁶ cells were pelleted, re-suspended, and fixed for at least 30 min in 500 μL 4% paraformaldehyde at room temperature. The cells were washed three times with PBS, postfixed in 0.5% OsO4 for 15 min, and followed by three times washing with distilled water. The samples were then dehydrated using a gradient series of ethanol and infiltrated with Epon-Araldite resin. The samples for TEM images were sectioned at a 100-nm thickness on a Reichert-Jung Ultracut-E ultramicrotome. The sections were viewed on a Hitachi 7,100 transmission electron microscope at 50 keV. Images were recorded with an AMT Advantage 10 Image Acquisition System using a Kodak Megaplus 1.6i CCD camera system (1,024×1,024 TIFF format).
Ferrozine-Based Spectrophotometric Assay
To quantitatively determine the iron content in labeled cells, ferrozine-based spectrophotometry array was performed [24]. Approximately 2 × 10⁶ macrophages, dendritic cells, or MSCs labeled with iron oxide particles were placed in Eppendorf tubes and mixed with 100 μL of 10 mM HCl. Then, 100 μL of a freshly mixed solution of 1.4 M HCl and 4.5% (w/v) KMnO4 (volume 1:1) was added as iron-releasing reagent. The mixture was incubated for 2 h at 60°C within a fume hood. After the mixture had cooled to room temperature, 30 μL of the iron-detection reagent (6.5 mM ferrozine, 6.5 mM neocuproine, 2.5 M ammonium acetate, and 1 M ascorbic acid dissolved in water) was added to each tube for further incubation. After 30 min, 280 μL of the solution in each tube was transferred into a 96-well plate and the absorbance was measured at 550 nm on a microplate reader. Using a calibration curve of the absorbance vs. iron concentration, the iron concentration in the cell pellets was determined. The iron concentrations in the labeled cells were finally expressed as pg of iron per cell.
Magnetic Resonance Imaging Phantom Study
A total of 2 × 10⁵ cells labeled with iron oxide particles and an equal number of control cells were suspended in 1 mL 1% agarose gel for MRI with a 11.7 T scanner, equipped with a Micro 2.5 gradient set (Biospec, Avance-DBX, Bruker, Billerica, MA). Gradient-echo imaging was acquired with the following parameters: repetition time (TR)=600 ms, Echo time (TE) = 8.1 ms; flip angle =Ernst angle; field of view (FOV) = 10 × 10 mm; matrix size 1283 128; 8 averages and a final voxel resolution of 78 × 78 × 130 μm.
In Vivo MRI
The heterotopic rat heart transplantation model and animal preparation for MR imaging were the same as previously reported [2]. Rats were prepared for MRI on post-operation days (POD) 5 and 6 because we found that for our rat model, grade 2 rejection emerges on POD 5, and moderate to severe (grade 3A) rejection develops on POD 6 [2]. A femoral vein catheter was surgically inserted for the infusion of labeled macrophages on POD 5. Electrocardiography (ECG) leads were placed on the abdominal area to pick up the heart beat from the transplanted heart more effectively. ECG and respiration gated, single slice, short-axis view, gradient-echo MR images of the transplanted hearts at the mid-ventricular level were performed at baseline before, immediately after (both on POD 5), and 24 h after (on POD 6) the infusion of 28 × 106 ITRI-IOP- or MPIO-labeled macrophages suspended in 800-μL PBS into the rat femoral vein via a PE10 tubing. We selected the injection of 28 million cells to demonstrate that the labeled macrophages can be detected in vivo in rejecting allograft heart with a pattern similar to that of MPIO labeling. A detailed report of additional in vivo studies will be published elsewhere. MRI studies were performed on a 4.7T, 40-cm bore Bruker AVANCE AV system (Bruker, Billerica, MA) equipped with a 12-cm diameter shielded gradient insert and a homebuilt surface coil. T2*-weighted gradient-echo images were acquired with the following parameters: TR =~ 1 s; TE = 8.1 ms; flip angle = Ernst angle; FOV = 40 × 40 mm; slice thickness = 1.5 mm; 8 averages; and 256 × 256 matrix; with an in3plane resolution of 156 × 156 μm.
Ex Vivo Magnetic Resonance Microscopy (MRM)
Immediately after the in vivo MRI, the transplanted hearts were perfused and fixed in 4% paraformaldehyde for 24 h. The fixed hearts were then imaged in PBS at 11.7 T (Biospec Avance-DBX, Bruker, Billerica, MA). High-resolution 3D images were acquired with the following parameters: TR = 500 ms; TE = 5.0 ms; flip angle = Ernst angle; FOV = 13 × 13 × 13 mm; 2 averages; and matrix size = 256 × 256 × 256; with an isotropic resolution of 51 μm.
Histopathological Analysis
After ex vivo MRM, the transplanted hearts were re-fixed in 4% paraformaldehyde and sent to the Transplantation Pathology Laboratory of the University of Pittsburgh Medical Center for histopathological analysis. The hearts were embedded in paraffin and sectioned into 5-μm slices in the short-axis view. The neighboring sections at the mid-ventricular level were stained with Hematoxylin-eosin (H&E) for examining the rejection status, Perl’s Prussian blue for iron detection, and monoclonal anti-rat macrophage antibody ED1 (Serotec Ltd, Oxford, UK) for macrophages.
Results
Particle Size and MR Relaxivity
TEM shows the iron core of ITRI-IOP is around 10–15 nm (Fig. 1a). DLS analysis of the peak intensity distribution for the USPIO, ITRI-IOP, Feridex, and MPIO particles indicates their average hydrodynamic diameters are 30.4, 62.5, 127, and 1,094 nm, respectively (Fig. 1b). Relaxivity measurements at 0.47 T show that ITRI-IOP has much higher transverse relaxivity than the other particles studied: the longitudinal r1 and transverse r2 relaxivities are 22.71 and 319.2 s−1 mM−1, respectively, compared with those of: MPIO, 1.441 and 35.19 s−1 mM−1; Feridex, 21.91 and 126.0 s−1 mM−1; and USPIO, 28.99 and 74.85 s−1 mM−1 (Fig. 1c). It should be noted that the deviation of the intercept from the relaxation rate of free water when fitting the transverse relaxivity for MPIO could be caused by possible precipitation of the large particles, whereas the other small particles could form homogeneous suspension in water solution.
Fig. 1.

Characterization of ITRI-IOP: a Schematic drawing of the PEG-coated ITRI-IOP, and the TEM image of the iron core of the ITRI-IOP particles. b DLS analysis of the hydrodynamic diameter of iron oxide particles. c r1 and r2 relaxivity measurements of four iron oxide particles. The estimated relaxivity values for MPIO are r1=1.441 s−1 mM−1 (correlation coefficient of 0.98), r2=35.19 s−1 mM−1 (correlation coefficient of 0.99); for Feridex, r1=21.91 s−1 mM−1 (correlation coefficient of 0.99), r2=126.0 s−1 mM−1 (correlation coefficient of 0.99); for USPIO, r1=28.99 s−1 mM−1 (correlation coefficient of 0.999), r2=74.85 s−1 mM−1 (correlation coefficient of 0.999); and for ITRI-IOP, r1=22.71 s−1 mM−1 (correlation coefficient of 0.997), r2=319.2 s−1 mM−1 (correlation coefficient of 0.998).
Cell Phenotype, Labeling Efficiency, and Particle Location in the Labeled Cells
Flow cytometry results show that the purities for macrophages, mature dendritic cells and MSCs cells were 99%, 88–92%, and 92–95%, respectively (Fig. 2). The incorporation of multiple ITRI-IOP particles (the electron-dense areas in the images) into the phagocytic vacuoles of cultured macrophages is clearly illustrated in the TEM image (Fig. 3d). The insert Fig. 3e shows a single lysosome (13,500× magnification), where the electron-dense inclusions represent iron loading. The labeling efficiency of ITRI-IOP for macrophages was nearly 100%, and the diameter of individual particle was found to be consistent with the expected size range of the PEG-coated ITRI-IOP. It should be noted that the 100-nm slice of the cell undergoing TEM imaging represents only a small portion of the total volume of a single macrophage (diameter of 20 μm). Hence, an entire cultured macrophage is expected to have incorporated a much greater number of particles than are seen in the TEM image.
Fig. 2.

Flow cytometry results showing the purity and phenotype of the three types of cells studied. The purities for a macrophages, b dendritic cells on day 9, and c MSCs cells on day 9 were 99%, 88–92%, and 92–95%, respectively. MSCs were tested with CD166+, CD105+, CD44+, CD29+, MHC-I+, CD34−, Isotypecontrol by flow cytometry.
Fig. 3.
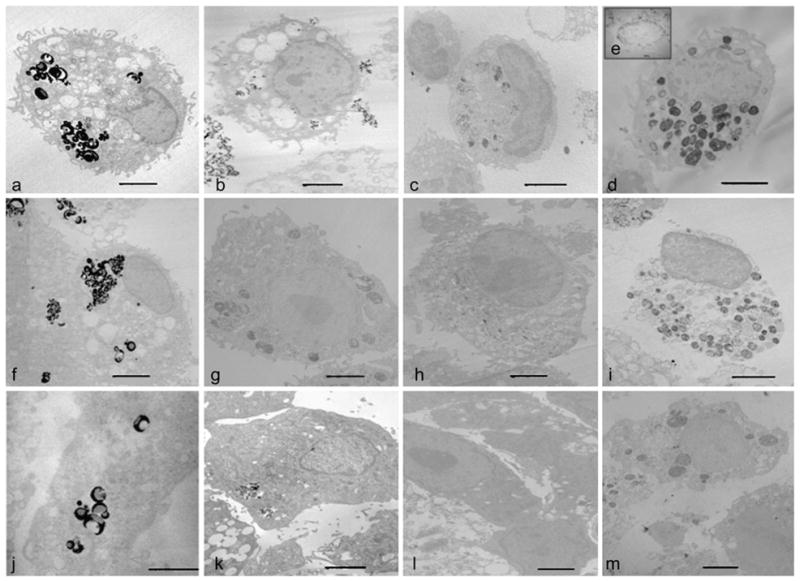
TEM images of cells labeled with iron oxide particles. The upper row shows a single macrophage labeled with a MPIO, b Feridex, c USPIO, and d ITRI-IOP, respectively. Multiple iron oxide particles are incorporated into the cytoplasm of the macrophages. e The insert image of a lysosomal vesicle (×13,500) shows the distribution of ITRI-IOP in sub-cellular compartments of macrophages. Dendritic cells labeled with f MPIO, g Feridex, h USPIO, and i ITRI-IOP are shown in the middle row. For MSCs labeled with j MPIO, k Feridex, l USPIO, and m ITRI-IOP, a similar distribution pattern of the iron oxide particles also appears. The scale bar is 2 μm.
Among the other three iron oxide particles studied, MPIO shows a comparable amount of iron oxide particles uptaken into the vacuoles of macrophages (Fig. 3a). In contrast, similar-sized dextran-coated USPIO (Fig. 3c) show a much smaller amount of iron oxide particles, according to the electron density in the vacuoles of the macrophage. For the dendritic cells, similarly, MPIO (Fig. 3f) provided the densest lysosomal vesicles, indicating the most iron oxide particles incorporated; followed in order by ITRI-IOP (Fig. 3i), Feridex (Fig. 3g), and USPIO (Fig. 3h). With regard to the non-phagocytic MSCs, MPIO (Fig. 3j) provided the most efficient iron incorporation, followed by ITRI-IOP (Fig. 3m), Feridex (Fig. 3k), and USPIO (Fig. 3l). Though MPIO is the most effective particle in labeling MSCs, the cell viability of MSCs dropped to 88% after 24-hour incubation with MPIO at an iron concentration of 25 μg/mL. In contrast, the cell viability of MSCs was maintained at 96% after 24-h incubation with ITRI-IOP with the same iron concentration based on our MTT assay results (Fig. 4b).
Fig. 4.

MTT assay of the a macrophages and b MSCs after being labeled with ITRI-IOP, MPIO, Feridex or USPIO for 24 h. Iron concentrations were varied at 25, 50, and 100 μg/ ml; 2 × 10⁵ cells were used in each well of the 96-well tissue culture plate. The dashed red line indicates 90% of cell viability.
A systematic MTT assay of the viability of macrophages and MSCs after being labeled with ITRI-IOP and the other three types of iron oxide particles are shown (Fig. 4). For macrophages labeled by ITRI-IOP, the viability was maintained above 90% for iron concentration up to 100 μg/mL (Fig. 4a). In contrast, for the non-phagocytic MSCs, 90% or higher viability was only achieved under an iron concentration of 50 μg/mL for ITRI-IOP (Fig. 4b). Generally, for the commonly used iron concentration of 25 μg/mL in cell labeling, ITRI-IOP and Feridex could achieve cell viability greater than 90% for both macrophages and MSCs; whereas the cell viability dropped below 90% when labeling with MPIO or USPIO (Fig. 4).
After simple co-incubation with ITRI-IOP, the significant amount of iron uptake into cells can also be observed under light microscopy (Fig. 5). Dark brown color indicates the heavy uptake of iron oxide particles by macrophages (Fig. 5a). A light brown color is observed from the dendritic cells labeled by ITRI-IOP (Fig. 5b), and an even lighter brown color is also shown in MSCs (Fig. 5c). Light microscopy of macrophages stained with Prussian blue show that macrophages labeled with ITRI-IOP have very strong iron staining in the cytoplasm (Fig. 5d, iron is shown in blue color). Similarly, the blue staining for iron is also shown in the cytoplasm of dendritic cells (Fig. 5e) and MSCs (Fig. 5f) labeled with ITRI-IOP.
Fig. 5.

Light microscopy of cells labeled with ITRI-IOP. Light microscopy of a macrophages, b dendritic cells, and c MSCs co-cultured with ITRI-IOP for 24 h, where the brown or light brown color indicates the incorporation of iron oxide particles inside cells. Light microscope images of d macrophages, e dendritic cells, and f MSCs after Prussian blue staining also show the presence of iron in the cell cytoplasm (iron shown as blue).
ITRI-IOP is coated with a PEG layer. Fluorescent anti-PEG mAb was also used to monitor the distribution and location of particles inside the cellular compartment. A representative image of the iron-laden macrophages exhibits bright green fluorescence (Fig. 6a), indicating the uptake of the PEG-coated ITRI-IOP. The differences in the intensity of the fluorescence signal illustrate the variation of the number of ITRI-IOP taken up by each individual cell. By comparing the visible light (Fig. 6b) and fluorescence (Fig. 6a) microscopy of the macrophages under the same field of view, it is clear that nearly every macrophage observed under visible light microscope has the corresponding fluorescence signals, implying the labeling efficiency of macrophages by ITRI-IOP is close to 100%.
Fig. 6.
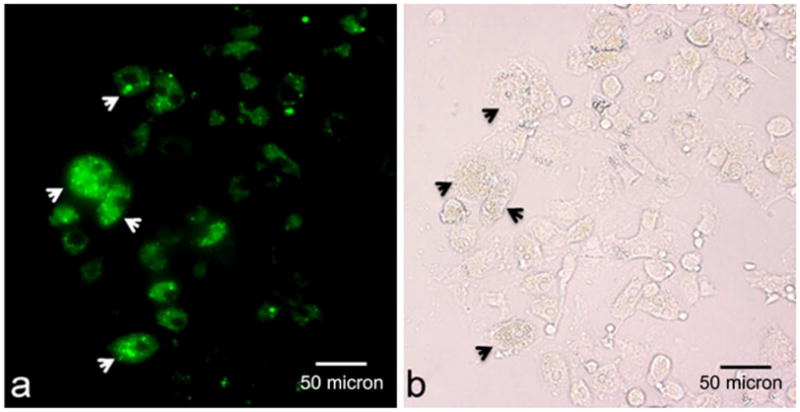
Representative microscopy shows a fluorescence and b visible light images of macrophages following treatment with anti-PEG mAb, under the same field of view. Arrows in (a) indicate the PEG positive fluorescence signal, implying the presence of PEG-coated ITRI-IOP particles, which is illustrated correspondingly by arrows in (b). Difference in fluorescence signal intensity in (a) indicates the variations of the number of ITRI-IOP taken up by each individual cell.
Optimal Labeling Time with ITRI-IOP
To determine the effect of culture time on the uptake of iron oxide particles, cells were incubated with all four types of iron oxide particles (MPIO, Feridex, USPIO, and ITRI-IOP) under otherwise identical culture conditions for periods of 2, 6, 12, 24, or 48 h (Fig. 7). At 6 h, the macrophages already showed a significant increase of the iron uptake (Fig. 7a). At 12 h, the maximum level of incorporation was achieved for all four types of particles. The similarly high iron uptake in macrophages can be maintained over a 24-h period of time for ITRI-IOP. After that, at the 48-h time point, the level of incorporation rapidly went down to 20–25% of the 24-h level (Fig. 7a). Flow cytometry results of propidium iodide staining show that the cell apoptosis of macrophages has increased from 6.8% to 29.0% when the labeling time of ITRI-IOP was changed from 24 to 48 h (Fig. 7d). Therefore, we have selected 24 h as the optimal labeling time of ITRI-IOP for macrophages. The average iron uptake in macrophages at 24-h labeling was calculated to be 5.725 pg/cell for ITRI-IOP. According to the density of iron oxide (5.17 g/cm3) and the radius of the ITRI-IOP (10–15 nm), we estimated that 370,000 ITRI-IOP particles encapsulate approximately 1 pg of iron. Hence, the average ITRI-IOP loading is estimated to be 2.1 × 10⁶ particles per macrophage. Likewise, after 24-h co-incubation with ITRI-IOP, optimal cell labeling was also achieved for both dendritic cells (Fig. 7b) and MSCs (Fig. 7c).
Fig. 7.

Iron uptake curves of a macrophages, b dendritic cells, and c MSCs along the labeling time of MPIO, Feridex, USPIO, and ITRI-IOP, assessed by Ferrozine-based spectrophotometric assay. For macrophages, the maximal level of uptake was achieved after 12-h incubation with ITRI-IOP (a). Relatively high level of iron uptake could be maintained at 24 h of labeling with ITRI-IOP. For dendritic cells and MSCs, the highest incorporation level was also achieved or maintained after 24-h incubation with ITRI-IOP. Propidium iodide staining of DNA show that the apoptosis of macrophages has increased from 6.8% to 29.0% when the labeling time of ITRI-IOP was increased from 24 to 48 h (d).
Signal Sensitivity Evaluated by Phantom MRI
We investigated the MRI signal sensitivity of ITRI-IOP, compared with the other three types of commercially available or commonly used iron-oxide particles, by labeling cells in vitro and then performing MRI of the labeled cells suspended in agarose gel. No hypointense regions were observed in the MRI images of the unlabeled macrophages (Fig. 8a). Hypointensity spots (in a strong to weak degree) can be clearly seen in the MRI images of macrophages labeled with MPIO (Fig. 8b), ITRI-IOP (Fig. 8e), and Feridex (Fig. 8c). However, it is barely seen with USPIO (Fig. 8d). We have found that ITRI-IOP-labeled macrophages exhibit larger and more significant areas of signal hypointensity than those labeled by Feridex and USPIO, and less cell aggregation is found compared with those labeled by MPIO. Each spot of hypointensity in the MRI images is believed to represent a single macrophage containing multiple iron oxide particles. The variations of the hypointensity in the MRI image of the ITRI-IOP labeled macrophages (Fig. 8e) might result from different amounts of iron oxide particles taken up by each individual macrophage, which is also reflected by the heterogeneous signal intensity seen on the green fluorescence microscopy (Fig. 6a).
Fig. 8.

Gradient-echo based T2*-weighted MRI images of 2×10⁵ cells labeled in vitro by iron oxide particles. Top, a Unlabeled macrophages and macrophages labeled by b MPIO, c Feridex, d USPIO, and e ITRI-IOP. Middle, f Unlabeled dendritic cells and dendritic cells labeled by g MPIO, h Feridex, i USPIO, and j ITRI-IOP. Bottom, k Unlabeled MSCs and MSCs labeled by l MPIO, m Feridex, n USPIO, and o ITRI-IOP. The presence of iron in all three types of cells is indicated by the signal loss and hypointensity. Major imaging parameters: TR=600 ms, TE=8.1 ms, and final voxel resolution of 78×78×130 μm.
For the phagocytic dendritic cells (Fig. 8f–j) and non-phagocytic MSCs (Fig. 8k–o), again, only MPIO achieved a degree of image hypointensities comparable with those of ITRI-IOP in the labeled cells; Feridex and USPIO provided much weaker and less significant hypointensities in the MRI images, probably due to the lower sensitivity or smaller amounts of iron oxide particles incorporated into the cells. These phantom MRI images indicate that ITRI-IOP is a sensitive contrast agent for T2*-weighted cellular MRI.
In vivo MRI and Ex vivo MRM After Infusion of MPIO- or ITRI-IOP-Labeled Macrophages into Rats with Transplanted Hearts
Compared with the uniform signal intensity of the left ventricle wall in the pre-scan images on POD 5 (Fig. 9a, d), the in vivo MRI images on POD 6 show multiple punctate, hypointense spots (the arrows show a few representative spots among them) on the rejecting allograft myocardium after infusing either MPIO-labeled (Fig. 9b) or ITRI-IOP-labeled (Fig. 9e) macrophages. High-resolution ex vivo MRM images at 11.7 T with an isotropic resolution of 51 μm show clearer and more punctate spots of hypointensity, most likely due to the accumulation of macrophages labeled by the MPIO (Fig. 9c) or ITRI-IOP (Fig. 9f). From the high-resolution MRM images, we have found that the diameters of hypointensity spots are approximately 100–150 μm (2–3 pixels) in both MPIO and ITRI-IOP-treated-macrophage-containing rats (Fig. 9b, d). We have not directly measured whether the hypointensity spots in Fig. 9 were caused by single cells or collections of cells. However, previous results from our laboratory and other research group show that a single particle of the 0.96 μm MPIO (same as the one we used) or a single cell labeled by the MPIO induced a hypointensity spot with a diameter of 100–200 μm [2, 15, 27]. Therefore, it is reasonable to conclude that these 100–150 μm diameter hypointense spots could be induced by a single labeled macrophage.
Fig. 9.

In vivo allograft heart MRI at 4.7 T and ex vivo high-resolution magnetic resonance microscopy (MRM) at 11.7 T. In vivo MRI of the allograft heart before (a and d, pre-scan) and approximately 24 h after infusing the b MPIO- and e ITRI-IOP-labeled macrophages. For the pre-scan MR images, the myocardium of the allograft heart is quite uniform in signal. After cell transplantation, both in vivo images show punctuate hypointensity in the rejecting allograft heart myocardium (representative arrows pointing a few among them). High-resolution MRM of the same transplanted hearts infused with c MPIO- and f ITRI-IOP-labeled macrophages more clearly demonstrate the punctuate hypointense spots, compared with the corresponding in vivo ones. LV left ventricle cavity, RV right ventricle cavity.
Histopathological Analysis
The iron-containing cells revealed by Prussian blue staining (Fig. 10a, iron shown as blue) correlate well with the ED1+ macrophages (Fig. 10b, macrophages shown as brown) in the areas with massive immune cell infiltration, disrupting the myocardial integrity as revealed by the H&E staining (Fig. 10c). We have also observed that approximately all iron positive locations correspond with the locations of ED1+ macrophages in the pathology slides, implying that the iron is most likely incorporated in macrophages, not in myocytes or in random interstitial space; nor any free iron particle released from the cell (Fig. 10a, b). These results again indicate that the modulated hypointense MR signal of the allograft heart is caused by the macrophages containing iron oxide particles. However, solely from the histopathological slides, we cannot distinguish whether the hypointensity of contrasts shown in the MRI images is caused by single cell because a cluster of ED1+ macrophages or a cluster of iron is commonly revealed depending on the cross-section of the cutting tissue (Fig. 10a, b).
Fig. 10.
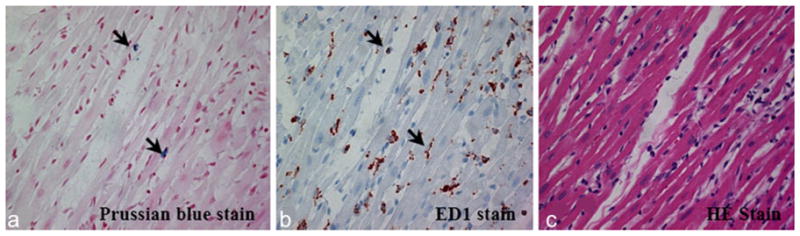
Histopathological analysis of the allograft heart tissue, after intravenously infusing macrophages labeled by ITRI-IOP into the rat: a Prussian blue staining shows the presence of iron (arrows indicating iron, shown as blue) in the myocardial tissue. b ED1+ staining shows multiple macrophages (arrows, shown as brown) at the corresponding locations of the myocardial tissue where the iron was present. c H&E staining shows massive mononuclear cell infiltration into the corresponding section of a rejecting allograft heart tissue.
Discussion
In this study, we have characterized ITRI-IOP, a newly synthesized, nano-sized iron oxide particle, which has demonstrated a very high transverse relaxivity and is suitable for labeling both phagocytic and non-phagocytic cell types. The signal sensitivity of ITRI-IOP is superior or comparable to a variety of commonly used iron oxide particles, demonstrated by phantom MRI. Labeling the target cells is the first and the most important step in cellular MRI. Generally, phagocytic cells can be effectively labeled by various iron oxide particles, ranging from USPIO to MPIO. Upon systemic infusion, nano- or micron-sized iron oxide particles are preferentially internalized by phagocytic macrophages or dendritic cells in the RES system. For non-phagocytic stem cells, in vitro labeling with an assisting transfection agent is usually employed [28, 29]. In our study, efficient labeling and excellent MR images of MSCs (Fig. 8o) are accomplished by simply co-incubating the stem cells with ITRI-IOP, without the need of transfection agents or other supplementary procedures, probably due to the nano-size, the PEG coating, and the higher r2 relaxivity that ITRI-IOP provides.
Sufficient intracellular iron content in a single cell and strong susceptibility effect are the prerequisites for detecting a small number of cells in vivo by MRI. To achieve in vivo MRI detectability and sufficiently label the resident macrophages in the RES system, a high dose of iron oxide particles is required. Feridex, for example, a dextran-coated SPIO, and the only iron oxide particle approved by the Food and Drug Administration (FDA), was injected intravenously at a concentration of approximately 14 mg of iron/kg in order to detect the iron-loaded macrophages in atherosclerotic plaque in rabbits by in vivo MRI [30]. In contrast, the FDA-approved dosage of Feridex is 0.56 mg of iron/kg in detecting liver tumors by labeling cells in the RES system during clinical studies. On the other hand, the newly synthesized PEG-coated ITRI-IOP provides a higher r2 relaxivity than currently available dextran-coated nano-sized USPIO, and a higher r2 relaxivity than Feridex, which is larger. In addition, a hydrophilic PEG coating, as has been added to ITRI-IOP, has been shown to enhance cell uptake and to lengthen the circulation time in the blood stream [31, 32]. An average iron uptake of 5.725 pg per macrophage was achieved in our study by directly co-incubating macrophages with microgram of ITRI-IOP particles in the culture medium for a period equals to or less than 24 h. Although much higher intracellular iron uptakes have been obtained in macrophages, dendritic cells or MSCs labeled with Feridex or with MPIO, we have found that cells labeled with ITRI-IOP demonstrate more significant MRI signal loss (hypo-intensity) than Feridex, and comparable with the micron-sized MPIO in our phantom MRI study (Fig. 8). The high MRI sensitivity of ITRI-IOP circumvents the necessity of using transfection agents [8] or extra procedures, such as electroporation [20] or magnetic enrichment [33], to incorporate a large number of nanometer-sized particles for in vivo detection. Thus, ITRI-IOP can facilitate cell labeling and provide improved sensitivity in detecting a small number of cells accumulated at regions of interest, such as the sites of inflammation, tumor, and targets of stem cells in tissue regeneration.
Cellular uptake of iron oxide particles and the metabolic pathways of particles are affected by particle size, coating, and surface charge [34–36]. The nano-sized dextran-coated USPIO particles have a long blood half-life on the order of several hours, sufficient to be phagocytosed by macrophages or monocytes in the RES system [10, 37, 38]; SPIO has a blood half-life in tens of minutes [8, 39, 40], and MPIO particles in a couple of minutes [16, 41]. While both are coated by dextran, large-sized SPIO Feridex can achieve higher efficiency than the nano-sized USPIO in labeling monocytes [42], which is demonstrated in our results as well. Interestingly, another study has shown that the improvement of in vitro cellular uptake of larger carboxy-dextran-coated SPIOs is rather due to surface properties than particle size, which may have large impacts on monocyte phagocytosis [31]. Studies have also shown that cationic surfaces facilitate cellular internalization [43, 44]. Accordingly, polycationic protamine sulfate was reported to bind on the dextran coating of iron oxide particles and modify the distribution of positive and negative surface charges, making these particles easily adhere to the cell membrane and facilitating uptake by the cell [45]. The uptake of negatively charged particles is also illustrated, which might be in the form of nanoparticle clusters secondary to non-specific particle adsorption on the cell membrane [46]. As demonstrated in our case, the improved cell internalization of ITRI-IOP in both phagocytic and non-phagocytic cell types is probably because PEG is solvable in both polar and non-polar solvents and has a high solubility in cell membranes [47]. However, the actual size of PEG, which is potentially relevant for RES clearance time or the relativity of the iron oxide particles, is difficult to determine after coating it on the iron oxide particles. On the other hand, the applications of polymer-coated, non-biodegradable MPIO might be restricted to phagocytic cell types [48]. For the non-phagocytic cell types, the incorporation of MPIO might require additional procedures, such as an antibody-mediated approach [49], which limits its usefulness in cell therapy studies.
Cytotoxicity and pre-activation of cells are other concerns in cell labeling by iron oxide particles. The pharmacokinetics and toxicity of dextran-coated USPIO or SPIO particles have been well studied [50–52]. Excessive particles in the circulation or in dead cells are cleared by the RES system, such as Kupffer cells. The particles are then degraded in the microenvironment of lysosomes, and the iron is released into the normal iron pool of the body. These studies have also shown that iron oxide particles do not cause long-term changes of the liver enzyme levels or induce oxidative stress. We believe that ITRI-IOP follows similar metabolic pathway as USPIO and SPIO particles, though their clearance by the RES is slower because of the PEG coating [53]. We have found that the blood half-life of ITRI-IOP is approximately 20 min in rats (results not shown). The in vivo bio-distribution of ITRI-IOP is very similar with the clinically approved Resovist [54], i.e., mostly in liver, spleen, and bone marrow (details not shown). The effect of iron oxide particles on labeled cells have also been studied previously [8, 9]. Normally, labeling cells with SPIO or USPIO particles is well tolerated in vitro and does not inhibit differentiation or block cell migration in vivo [55]. Our MTT-based toxicity and proliferation assay also demonstrates that there is no significant decrease of cell viability compared with unlabeled macrophages or MSCs cells under an iron concentration of 50 μg/mL. In our study, the high viability rate (96%) and the 95% or higher incorporation for all three types of cells co-culturing with of ITRI-IOP for 24 h suggests that ITRI-IOP does not significantly affect cell viability and induce cell toxicity under an iron concentration of 25 μg/mL. The slight decrease of the iron content found in MSCs labeled longer than 24 h (80% of the optimal labeling rate, Fig. 7c) may be due to the small percentage of cell apoptosis (6–8%, measured by the trypan blue exclusion test), or division of the labeled cells. However, the dramatic decrease of iron from 24 to 48 h (20–50% of the optimal labeling concentration) found in the macrophage and dendritic cells labeled by ITRI-IOP (Fig. 7a, b) is surprising and might be due to the fact that macrophages and dendritic cells are powerful phagocytic cells, and they could have reached their limit of internalizing foreign iron oxide particles in lysosomal vesicles by 48 h of co-culturing. The incorporated iron might be accumulated in the cells in different forms, possibly depending on the iron oxide particles used. Flow cytometry results of the macrophages have confirmed that the cell apoptosis has increased from 6.8% to 29.0% when the labeling time of ITRI-IOP was increased from 24 to 48 h. Studies have found that apoptosis could trigger cells to shed the iron-containing vesicles into the extracellular environment, producing vesicles in various sizes and probably various composition of iron [56]. Another possible reason could be that some of PEG-coated ITRI-IOP or the small dextran-coated USPIO could have been digested by hydrolytic enzymes in lysosome. Additionally, iron loss resulted from common cell death is also a factor need to be considered. The variations in iron digestion or cell death could be affected by the characteristics of the iron oxide particles, which need to be studied in the future. Therefore, we think all of the factors mentioned herein might contribute essentially to the variations of iron concentrations in the cells (Fig. 7). On the other hand, MSCs are not phagocytic, and are relatively large cells, thus facilitating a slow yet continued incorporation of ITRI-IOP particles during 48 h of incubation. In addition, we have also found that multiple cell types, including macrophages and dendritic cells, co-cultured with ITRI-IOP for 24 h do not induce detectable or significant pro-inflammatory cytokines, such as IL-1β, IL-6, or TNF-α. This indicates that the immunological profiles of the labeled cells are not altered by the labeling (results not shown). Of course, to better understand the long-term fate of iron incorporated into cells or the mechanism of iron metabolism in cells, further studies need to be performed, which is beyond the scope of this manuscript.
Conclusions
We have investigated a newly synthesized iron oxide particle, ITRI-IOP, and have evaluated its potential usefulness for cellular MRI. We have found that the r2 relaxivity of ITRI-IOP is much higher than that of a variety of commonly used iron oxide particles, thus providing a potential advantage in T2*-weighted cellular MRI. ITRI-IOP readily undergoes efficient and non-toxic uptake by both phagocytic and non-phagocytic cells in culture medium without extra procedures and is highly sensitive for in vivo cellular MRI. Further studies with different immune cells specifically labeled with this particle may help monitor the migration of cells and interpret the role that a specific type of cells plays in immune responses, such as organ rejection, and help understand the mechanisms of organ rejection and other inflammatory processes.
Acknowledgments
We thank Mr. Joseph P. Suhan, Department of Biological Sciences, Carnegie Mellon University, for excellent technical assistance in the TEM measurements. We also thank Dr. Steve R. Roffler of the Institute of Biomedical Sciences, Academia Sinica, Taiwan for kindly providing us with his anti-PEG AGP3 antibody (SR-66). C.-L. Chen, W.-Y. Hsieh, H.-H. Shen, and S.-J. Wang are supported by the Industrial Technology Research Institute, Taiwan. We also acknowledge the research support from NIH grants (R01HL-081349 and P41EB-00197 to C. Ho).
Abbreviations
- BN rat
Brown Norway rat
- DA rat
Dark Agouti rat
- DLS
Dynamic light scattering
- ECG
Electrocardiography
- FACS
Fluorescent-activated cell sorting
- FDA
Food and Drug Administration
- MR
Magnetic resonance
- MRI
Magnetic resonance imaging
- MRM
Magnetic resonance microscopy
- MPIO
Micron-sized superparamagnetic iron oxide particles
- MSCs
Mesenchymal stem cells
- PBS
Phosphate-buffered saline
- PEG
Polyethylene glycol
- POD
Post-operation day
- r1
Longitudinal relaxivity
- r2
Transverse relaxivity
- RES
Reticuloendothelial system
- SPIO
Superparamagnetic iron oxide particles
- T1
Longitudinal relaxation time
- T2
Transverse relaxation time
- TEM
Transmission electron microscopy
- TE
Echo time
- TR
Repetition time
- USPIO
Ultrasmall superparamagnetic iron oxide particles
Footnotes
Conflicts of Interest The authors declare that they have no conflict of interest.
References
- 1.Yeh TC, Zhang W, Ildstad ST, Ho C. In vivo dynamic MRI tracking of rat T-cells labeled with superparamagnetic iron-oxide particles. Magn Reson Med. 1995;33(2):200–208. doi: 10.1002/mrm.1910330209. [DOI] [PubMed] [Google Scholar]
- 2.Wu YL, Ye Q, Foley LM, Hitchens TK, Sato K, Williams JB, Ho C. In situ labeling of immune cells with iron oxide particles: an approach to detect organ rejection by cellular MRI. Proc Natl Acad Sci USA. 2006;103(6):1852–1857. doi: 10.1073/pnas.0507198103. [DOI] [PMC free article] [PubMed] [Google Scholar]
- 3.Kiessling F. Noninvasive cell tracking. Handb Exp Pharmacol. 2008;185(Pt 2):305–321. doi: 10.1007/978-3-540-77496-9_13. [DOI] [PubMed] [Google Scholar]
- 4.Bulte JW, Kraitchman DL. Iron oxide MR contrast agents for molecular and cellular imaging. NMR Biomed. 2004;17(7):484–499. doi: 10.1002/nbm.924. [DOI] [PubMed] [Google Scholar]
- 5.Smirnov P. Cellular magnetic resonance imaging using super-paramagnetic anionic iron oxide nanoparticles: applications to in vivo trafficking of lymphocytes and cell-based anticancer therapy. Methods Mol Biol. 2009;512:333–353. doi: 10.1007/978-1-60327-530-9_19. [DOI] [PubMed] [Google Scholar]
- 6.Baumjohann D, Hess A, Budinsky L, Brune K, Schuler G, Lutz MB. In vivo magnetic resonance imaging of dendritic cell migration into the draining lymph nodes of mice. Eur J Immunol. 2006;36(9):2544–2555. doi: 10.1002/eji.200535742. [DOI] [PubMed] [Google Scholar]
- 7.Daldrup-Link HE, Rudelius M, Piontek G, Metz S, Brauer R, Debus G, Corot C, Schlegel J, Link TM, Peschel C, Rummeny EJ, Oostendorp RA. Migration of iron oxide-labeled human hematopoietic progenitor cells in a mouse model: in vivo monitoring with 1.5-T MR imaging equipment. Radiology. 2005;234(1):197–205. doi: 10.1148/radiol.2341031236. [DOI] [PubMed] [Google Scholar]
- 8.Frank JA, Miller BR, Arbab AS, Zywicke HA, Jordan EK, Lewis BK, Bryant LH, Jr, Bulte JW. Clinically applicable labeling of mammalian and stem cells by combining superparamagnetic iron oxides and transfection agents. Radiology. 2003;228(2):480–487. doi: 10.1148/radiol.2281020638. [DOI] [PubMed] [Google Scholar]
- 9.Arbab AS, Bashaw LA, Miller BR, Jordan EK, Bulte JW, Frank JA. Intracytoplasmic tagging of cells with ferumoxides and transfection agent for cellular magnetic resonance imaging after cell transplantation: methods and techniques. Transplantation. 2003;76(7):1123–1130. doi: 10.1097/01.TP.0000089237.39220.83. [DOI] [PubMed] [Google Scholar]
- 10.Kanno S, Wu YJ, Lee PC, Dodd SJ, Williams M, Griffith BP, Ho C. Macrophage accumulation associated with rat cardiac allograft rejection detected by magnetic resonance imaging with ultrasmall superparamagnetic iron oxide particles. Circulation. 2001;104(8):934–938. doi: 10.1161/hc3401.093148. [DOI] [PubMed] [Google Scholar]
- 11.Ye Q, Yang D, Williams M, Williams DS, Pluempitiwiriyawej C, Moura JM, Ho C. In vivo detection of acute rat renal allograft rejection by MRI with USPIO particles. Kidney Int. 2002;61(3):1124–1135. doi: 10.1046/j.1523-1755.2002.00195.x. [DOI] [PubMed] [Google Scholar]
- 12.Ho C, Hitchens TK. A non-invasive approach to detecting organ rejection by MRI: monitoring the accumulation of immune cells at the transplanted organ. Curr Pharm Biotechnol. 2004;5(6):551–566. doi: 10.2174/1389201043376535. [DOI] [PubMed] [Google Scholar]
- 13.Penno E, Johnsson C, Johansson L, Ahlstrom H. Macrophage uptake of ultra-small iron oxide particles for magnetic resonance imaging in experimental acute cardiac transplant rejection. Acta Radiol. 2006;47(3):264–271. doi: 10.1080/02841850500539041. [DOI] [PubMed] [Google Scholar]
- 14.Hauger O, Grenier N, Deminere C, Lasseur C, Delmas Y, Merville P, Combe C. USPIO-enhanced MR imaging of macrophage infiltration in native and transplanted kidneys: initial results in humans. Eur Radiol. 2007;17(11):2898–2907. doi: 10.1007/s00330-007-0660-8. [DOI] [PubMed] [Google Scholar]
- 15.Shapiro EM, Skrtic S, Sharer K, Hill JM, Dunbar CE, Koretsky AP. MRI detection of single particles for cellular imaging. Proc Natl Acad Sci USA. 2004;101(30):10901–10906. doi: 10.1073/pnas.0403918101. [DOI] [PMC free article] [PubMed] [Google Scholar]
- 16.Shapiro EM, Skrtic S, Koretsky AP. Sizing it up: cellular MRI using micron-sized iron oxide particles. Magn Reson Med. 2005;53(2):329–338. doi: 10.1002/mrm.20342. [DOI] [PubMed] [Google Scholar]
- 17.Josephson L, Tung CH, Moore A, Weissleder R. High-efficiency intracellular magnetic labeling with novel superparamagnetic-Tat peptide conjugates. Bioconjug Chem. 1999;10(2):186–191. doi: 10.1021/bc980125h. [DOI] [PubMed] [Google Scholar]
- 18.Montet-Abou K, Montet X, Weissleder R, Josephson L. Cell internalization of magnetic nanoparticles using transfection agents. Mol Imaging. 2007;6(1):1–9. [PubMed] [Google Scholar]
- 19.Ahrens ET, Feili-Hariri M, Xu H, Genove G, Morel PA. Receptor-mediated endocytosis of iron-oxide particles provides efficient labeling of dendritic cells for in vivo MR imaging. Magn Reson Med. 2003;49 (6):1006–1013. doi: 10.1002/mrm.10465. [DOI] [PubMed] [Google Scholar]
- 20.Tai JH, Foster P, Rosales A, Feng B, Hasilo C, Martinez V, Ramadan S, Snir J, Melling CW, Dhanvantari S, Rutt B, White DJ. Imaging islets labeled with magnetic nanoparticles at 1.5 Tesla. Diabetes. 2006;55 (11):2931–2938. doi: 10.2337/db06-0393. [DOI] [PubMed] [Google Scholar]
- 21.Walczak P, Ruiz-Cabello J, Kedziorek DA, Gilad AA, Lin S, Barnett B, Qin L, Levitsky H, Bulte JW. Magnetoelectroporation: improved labeling of neural stem cells and leukocytes for cellular magnetic resonance imaging using a single FDA-approved agent. Nanomedicine. 2006;2(2):89–94. doi: 10.1016/j.nano.2006.01.003. [DOI] [PubMed] [Google Scholar]
- 22.Chang W-H, Hsieh W-Y, Huang H-H, Wang S-J. Biocompatible polymer and magnetic nanoparticles with biocompatibility. P54960092WO. Patent Application Number. 2008 April 23; data of filing.
- 23.Dodd SJ, Williams M, Suhan JP, Williams DS, Koretsky AP, Ho C. Detection of single mammalian cells by high-resolution magnetic resonance imaging. Biophys J. 1999;76(1 Pt 1):103–109. doi: 10.1016/S0006-3495(99)77182-1. [DOI] [PMC free article] [PubMed] [Google Scholar]
- 24.Riemer J, Hoepken HH, Czerwinska H, Robinson SR, Dringen R. Colorimetric ferrozine-based assay for the quantitation of iron in cultured cells. Anal Biochem. 2004;331(2):370–375. doi: 10.1016/j.ab.2004.03.049. [DOI] [PubMed] [Google Scholar]
- 25.Riccardi C, Nicoletti I. Analysis of apoptosis by propidium iodide staining and flow cytometry. Nat Protoc. 2006;1(3):1458–1461. doi: 10.1038/nprot.2006.238. [DOI] [PubMed] [Google Scholar]
- 26.Mosmann T. Rapid colorimetric assay for cellular growth and survival: application to proliferation and cytotoxicity assays. J Immunol Methods. 1983;65(1–2):55–63. doi: 10.1016/0022-1759(83)90303-4. [DOI] [PubMed] [Google Scholar]
- 27.Shapiro EM, Sharer K, Skrtic S, Koretsky AP. In vivo detection of single cells by MRI. Magn Reson Med. 2006;55(2):242–249. doi: 10.1002/mrm.20718. [DOI] [PubMed] [Google Scholar]
- 28.Bulte JW, Douglas T, Witwer B, Zhang SC, Strable E, Lewis BK, Zywicke H, Miller B, van Gelderen P, Moskowitz BM, Duncan ID, Frank JA. Magnetodendrimers allow endosomal magnetic labeling and in vivo tracking of stem cells. Nat Biotechnol. 2001;19(12):1141–1147. doi: 10.1038/nbt1201-1141. [DOI] [PubMed] [Google Scholar]
- 29.Schafer R, Kehlbach R, Wiskirchen J, Bantleon R, Pintaske J, Brehm BR, Gerber A, Wolburg H, Claussen CD, Northoff H. Transferrin receptor upregulation: in vitro labeling of rat mesenchymal stem cells with superparamagnetic iron oxide. Radiology. 2007;244(2):514–523. doi: 10.1148/radiol.2442060599. [DOI] [PubMed] [Google Scholar]
- 30.Korosoglou G, Weiss RG, Kedziorek DA, Walczak P, Gilson WD, Schar M, Sosnovik DE, Kraitchman DL, Boston RC, Bulte JW, Weissleder R, Stuber M. Noninvasive detection of macrophage-rich atherosclerotic plaque in hyperlipidemic rabbits using “positive contrast” magnetic resonance imaging. J Am Coll Cardiol. 2008;52(6):483–491. doi: 10.1016/j.jacc.2008.03.063. [DOI] [PMC free article] [PubMed] [Google Scholar]
- 31.Gupta AK, Wells S. Surface-modified superparamagnetic nano-particles for drug delivery: preparation, characterization, and cytotox-icity studies. IEEE Trans Nanobioscience. 2004;3(1):66–73. doi: 10.1109/tnb.2003.820277. [DOI] [PubMed] [Google Scholar]
- 32.Zhang Y, Kohler N, Zhang M. Surface modification of super-paramagnetic magnetite nanoparticles and their intracellular uptake. Biomaterials. 2002;23(7):1553–1561. doi: 10.1016/s0142-9612(01)00267-8. [DOI] [PubMed] [Google Scholar]
- 33.Hamm J, Pulito R, Benedetto S, Barberis L, Hirsch E, Poli V, Silengo L. Magnetically enriched bone marrow-derived macrophages loaded in vitro with iron oxide can migrate to inflammation sites in mice. NMR Biomed. 2008;21(2):120–128. doi: 10.1002/nbm.1168. [DOI] [PubMed] [Google Scholar]
- 34.Pouliquen D, Le Jeune JJ, Perdrisot R, Ermias A, Jallet P. Iron oxide nanoparticles for use as an MRI contrast agent: pharmacokinetics and metabolism. Magn Reson Imaging. 1991;9(3):275–283. doi: 10.1016/0730-725x(91)90412-f. [DOI] [PubMed] [Google Scholar]
- 35.Majumdar S, Zoghbi SS, Gore JC. Pharmacokinetics of super-paramagnetic iron-oxide MR contrast agents in the rat. Invest Radiol. 1990;25 (7):771–777. doi: 10.1097/00004424-199007000-00004. [DOI] [PubMed] [Google Scholar]
- 36.Thorek DL, Tsourkas A. Size, charge and concentration dependent uptake of iron oxide particles by non-phagocytic cells. Biomaterials. 2008;29(26):3583–3590. doi: 10.1016/j.biomaterials.2008.05.015. [DOI] [PMC free article] [PubMed] [Google Scholar]
- 37.Choi H, Choi SR, Zhou R, Kung HF, Chen IW. Iron oxide nanoparticles as magnetic resonance contrast agent for tumor imaging via folate receptor-targeted delivery. Acad Radiol. 2004;11(9):996–1004. doi: 10.1016/j.acra.2004.04.018. [DOI] [PubMed] [Google Scholar]
- 38.Slotkin JR, Cahill KS, Tharin SA, Shapiro EM. Cellular magnetic resonance imaging: nanometer and micrometer size particles for noninvasive cell localization. Neurotherapeutics. 2007;4(3):428–433. doi: 10.1016/j.nurt.2007.05.010. [DOI] [PMC free article] [PubMed] [Google Scholar]
- 39.Yeh TC, Zhang W, Ildstad ST, Ho C. Intracellular labeling of T-cells with superparamagnetic contrast agents. Magn Reson Med. 1993;30 (5):617–625. doi: 10.1002/mrm.1910300513. [DOI] [PubMed] [Google Scholar]
- 40.Islam T, Wolf G. The pharmacokinetics of the lymphotropic nanoparticle MRI contrast agent ferumoxtran-10. Cancer Biomark. 2009;5 (2):69–73. doi: 10.3233/CBM-2009-0579. [DOI] [PubMed] [Google Scholar]
- 41.Ye Q, Wu YL, Foley LM, Hitchens TK, Eytan DF, Shirwan H, Ho C. Longitudinal tracking of recipient macrophages in a rat chronic cardiac allograft rejection model with noninvasive magnetic resonance imaging using micrometer-sized paramagnetic iron oxide particles. Circulation. 2008;118(2):149–156. doi: 10.1161/CIRCULATIONAHA.107.746354. [DOI] [PMC free article] [PubMed] [Google Scholar]
- 42.Oude Engberink RD, van der Pol SM, Dopp EA, de Vries HE, Blezer EL. Comparison of SPIO and USPIO for in vitro labeling of human monocytes: MR detection and cell function. Radiology. 2007;243(2):467–474. doi: 10.1148/radiol.2432060120. [DOI] [PubMed] [Google Scholar]
- 43.Salaklang J, Steitz B, Finka A, O’Neil CP, Moniatte M, van der Vlies AJ, Giorgio TD, Hofmann H, Hubbell JA, Petri-Fink A. Superparamagnetic nanoparticles as a powerful systems biology characterization tool in the physiological context. Angew Chem Int Ed Engl. 2008;47(41):7857–7860. doi: 10.1002/anie.200800357. [DOI] [PubMed] [Google Scholar]
- 44.Matuszewski L, Persigehl T, Wall A, Meier N, Bieker R, Kooijman H, Tombach B, Mesters R, Berdel WE, Heindel W, Bremer C. Assessment of bone marrow angiogenesis in patients with acute myeloid leukemia by using contrast-enhanced MR imaging with clinically approved iron oxides: initial experience. Radiology. 2007;242 (1):217–224. doi: 10.1148/radiol.2421051355. [DOI] [PubMed] [Google Scholar]
- 45.Arbab AS, Yocum GT, Kalish H, Jordan EK, Anderson SA, Khakoo AY, Read EJ, Frank JA. Efficient magnetic cell labeling with protamine sulfate complexed to ferumoxides for cellular MRI. Blood. 2004;104(4):1217–1223. doi: 10.1182/blood-2004-02-0655. [DOI] [PubMed] [Google Scholar]
- 46.Wilhelm C, Billotey C, Roger J, Pons JN, Bacri JC, Gazeau F. Intracellular uptake of anionic superparamagnetic nanoparticles as a function of their surface coating. Biomaterials. 2003;24(6):1001–1011. doi: 10.1016/s0142-9612(02)00440-4. [DOI] [PubMed] [Google Scholar]
- 47.Yamazaki M, Ito T. Deformation and instability in membrane structure of phospholipid vesicles caused by osmophobic association: mechanical stress model for the mechanism of poly(ethylene glycol)-induced membrane fusion. Biochemistry. 1990;29(5):1309–1314. doi: 10.1021/bi00457a029. [DOI] [PubMed] [Google Scholar]
- 48.de Vries IJ, Lesterhuis WJ, Barentsz JO, Verdijk P, van Krieken JH, Boerman OC, Oyen WJ, Bonenkamp JJ, Boezeman JB, Adema GJ, Bulte JW, Scheenen TW, Punt CJ, Heerschap A, Figdor CG. Magnetic resonance tracking of dendritic cells in melanoma patients for monitoring of cellular therapy. Nat Biotechnol. 2005;23(11):1407–1413. doi: 10.1038/nbt1154. [DOI] [PubMed] [Google Scholar]
- 49.Shapiro EM, Medford-Davis LN, Fahmy TM, Dunbar CE, Koretsky AP. Antibody-mediated cell labeling of peripheral T cells with micron-sized iron oxide particles (MPIOs) allows single cell detection by MRI. Contrast Media Mol Imaging. 2007;2(3):147–153. doi: 10.1002/cmmi.134. [DOI] [PMC free article] [PubMed] [Google Scholar]
- 50.Tavill AS, Bacon BR. Hemochromatosis: how much iron is too much? Hepatology. 1986;6(1):142–145. doi: 10.1002/hep.1840060128. [DOI] [PubMed] [Google Scholar]
- 51.Weissleder R, Stark DD, Engelstad BL, Bacon BR, Compton CC, White DL, Jacobs P, Lewis J. Superparamagnetic iron oxide: pharmacokinetics and toxicity. AJR Am J Roentgenol. 1989;152(1):167–173. doi: 10.2214/ajr.152.1.167. [DOI] [PubMed] [Google Scholar]
- 52.Jain TK, Reddy MK, Morales MA, Leslie-Pelecky DL, Labhasetwar V. Biodistribution, clearance, and biocompatibility of iron oxide magnetic nanoparticles in rats. Mol Pharm. 2008;5(2):316–327. doi: 10.1021/mp7001285. [DOI] [PubMed] [Google Scholar]
- 53.Moghimi SM, Szebeni J. Stealth liposomes and long circulating nanoparticles: critical issues in pharmacokinetics, opsonization and protein-binding properties. Prog Lipid Res. 2003;42(6):463–478. doi: 10.1016/s0163-7827(03)00033-x. [DOI] [PubMed] [Google Scholar]
- 54.Reimer P, Balzer T. Ferucarbotran (Resovist): a new clinically approved RES-specific contrast agent for contrast-enhanced MRI of the liver: properties, clinical development, and applications. Eur Radiol. 2003;13 (6):1266–1276. doi: 10.1007/s00330-002-1721-7. [DOI] [PubMed] [Google Scholar]
- 55.Di Marco M, Sadun C, Port M, Guilbert I, Couvreur P, Dubernet C. Physicochemical characterization of ultrasmall superparamagnetic iron oxide particles (USPIO) for biomedical application as MRI contrast agents. Int J Nanomedicine. 2007;2(4):609–622. [PMC free article] [PubMed] [Google Scholar]
- 56.Luciani N, Wilhelm C, Gazeau F. The role of cell-released microvesicles in the intercellular transfer of magnetic nanoparticles in the monocyte/macrophage system. Biomaterials. 2010;31(27):7061–7069. doi: 10.1016/j.biomaterials.2010.05.062. [DOI] [PubMed] [Google Scholar]