

Abstract
Deficiencies in many of the complement proteins and their regulatory molecules have been described and a variety of diseases, such as recurrent infections, systemic lupus erythematosus (SLE) and renal diseases, may be linked to deficiency in the complement system. Screening for complement defects is therefore of great importance. In this study, we present novel improved enzyme-linked immunosorbent assays for the functional assessment of the three individual pathways of the complement system. The method is applicable at high serum concentrations and we demonstrate that it minimizes both false negative as well as false positive results. In particular, for the functional mannose-binding lectin activity it represents an improvement on the existing assays. In this respect, the present assays represent novel improved diagnostic protocols for patients with suspected immunodeficiencies related to the complement system.
Keywords: alternative pathway, classical pathway, complement, ELISA, immunodeficiency, lectin pathway
Introduction
The complement system is an important immune surveillance system in vertebrates, and elements of complement functions have also been demonstrated in several invertebrate species [1]. The complement system in mammals is comprised of a large number of distinct plasma and cell-associated proteins. Activation of the complement system initiates a proteolytic cascade producing protein fragments that induce opsonization or direct killing of invading pathogens and altered host cells, and generates proinflammatory responses. Furthermore, complement is also an important link between the innate and adaptive immune responses [2,3]. There are three main pathways through which the complement system can be activated. These pathways, called the classical pathway (CP), the alternative pathway (AP) and the lectin pathway (LP), depend on different components of the complement system for their initiation. They all converge to generate the same central effector molecule, C3b, through the activity of C3-activating enzyme complexes, the C3-convertases [4,5]. The CP is initiated as a result of the binding of C1q to antibody–antigen complexes or to structures such as lipopolysaccharide (LPS) or C-reactive protein (CRP), and involves a complex of C1q with the serine proteases C1r and C1s [C1q–(C1s)2–(C1r)2]. Binding of the C1-complex leads to activation of C1s, which cleaves factors C4 and C2 yielding the CP C3-convertase C4bC2a. Initiation of the AP depends on a slow spontaneous hydrolysis of C3 and is amplified by the presence of, e.g. foreign carbohydrate surfaces (and the absence of cellular and humoral inhibitors) leading to formation of the AP C3-convertase C3bBb, stabilized by properdin. The LP is activated mainly when mannose-binding lectin (MBL) or ficolins bind to restricted patterns of non-self carbohydrate structures on target surfaces. This recognition leads to the activation of the MBL/ficolin-associated serine proteases (MASPs), of which MASP-2 has been shown to activate C4 and C2 leading to the LP C3-convertase C4bC2a [6].
With a prevalence of 5–10% in the Caucasian population, MBL deficiency is the most common immunodeficiency [7]. Functional MBL deficiency is explained largely by three single point mutations in codons 52, 54 and 57 of exon 1 in the MBL2 gene. These variants are referred to as variants D, B and C, respectively (often pooled into one O allele, while the wild-type is referred to as A). They result in unstable MBL variant proteins characterized by a low avidity towards ligands and an inability to initiate the MBL pathway [8,9]. Promoter polymorphisms, including the variants upstream of the MBL-2 gene, H/L (at position −550), X/Y variant (at position −221) and the P/Q variant (at position +4), are correlated with lower promoter activity in the order HY > LY > LX, leading to decreased amounts of an otherwise fully functional MBL [10].
Numerous studies have reported an association between MBL deficiency and increased susceptibility to different types of infection. In particular, these are infections caused by extracellular bacteria causing acute respiratory tract infections during early childhood [11–13]. However, studies have indicated that diseases correlated with MBL deficiency may require one or more co-existing immune malfunctions. For example, a study on meningitis caused by Neisseria meningitidis showed an increased probability of the disease when MBL deficiency was associated with properdin deficiency [14]. Another area where complement deficiencies may play an important pathogenic role is in various autoimmune diseases, where elimination of immune complexes is hampered. Thus, screening of patients suffering from frequent and/or opportunistic infections and suspected of an underlying immunodeficiency or screening of patients suffering from autoimmune diseases, especially type III diseases, often involves assessment and evaluation of functional complement activity. For autoimmune diseases, monitoring of complement function also allows for an assessment of actual disease activity.
In clinical laboratories the most commonly used method to measure functional complement activity is haemolysis of erythrocytes due to complement activation, either via the classical complement pathway in which sheep erythrocytes coated with antibodies are used as targets (CH50), or via the alternative complement pathway where rabbit erythrocytes are used as targets (AP50) [15]. Similar assays have been developed recently for the MBL pathway using mannan-coated erythrocytes [16,17]. However, these haemolytic assays are all cumbersome and difficult to standardize.
Several enzyme-linked immunosorbent assays (ELISA) for the assessment of the functional activity of the complement activation pathways have been described, but the use of these assays in routine clinical practice is limited. However, a well-described functional ELISA-based procedure for all the three pathways has been described recently and is available as a commercial kit (WIESLAB® Complement System Screen COMPL 300; Euro-Diagnostica, Malmö, Sweden). Although the Wielisa assay performs satisfactorily, it is subject to some major limitations related to the measurement of the MBL pathway. The main problem associated with assessment of MBL complement capacity on a mannan-coated surface is interference from the CP and the AP. In the Wielisa kit the CP activity is eliminated using an antibody that inhibits C1q binding, but a possible interference from the AP is not removed and the sample measurements must be performed with predetermined high serum dilution (1:101) to avoid this. This approach holds the potential pitfalls of inducing false negative results if the assay is performed at too high a serum dilution, or false positive results if the dilution is to low. Consequently, in light of the clinical relevance of MBL deficiencies, it is important for an MBL assay to measure MBL activity exclusively without any interference from the CP and the AP, and thus to also be applicable at low serum dilutions.
In the present study, we describe optimized ELISA-based assays for the measurements of the functional capacities of the three complement pathways. The assays are validated by analysis of serum samples from 150 healthy blood donors and from 30 patients with assorted deficiencies within complement components. For assessment of the MBL pathway we utilize a polyanion compound, sodium polyanethole sulphonate (SPS), which has been described recently to inhibit both the AP and the CP leaving the MBL pathway unaffected. Thus, it allows for a specific measurement of the functional capacity of the MBL pathway without the need for a high serum dilution [18]. Additionally, we have developed modified and optimized assays specific for the AP and the CP pathways to measure the functional capacity of these pathways.
Materials and methods
Serum samples
Serum samples were obtained from 150 healthy blood donors, 68 females with a mean age of 43·4 years (range 21–67 years) and 82 males with a mean age of 45·0 years (range 21–66 years). Blood was allowed to clot at room temperature for 2 h followed by centrifugation at 970 g at 4°C for 15 min. After centrifugation, serum was removed from the clot, aliquoted into 150-µl portions and stored at −80°C until further analysis. Sera from 30 patients with described complement deficiencies were collected and tested in the present assays.
Assessment of the functional capacity of the three complement pathways
The assays used to measure the activity of the complement capacity of the alternative, classical and MBL pathways were performed essentially as described previously [18], with a few modifications. In brief, in the assays used for the assessment of CP and AP activity, wells were precoated with immune complexes and LPS, respectively. Mannan-coated wells were used to activate the MBL pathway. To ensure that only the MBL pathway was activated, sera were preincubated with SPS (Sigma®, lot. 55963-78-5; Sigma, St Louis, MO, USA), 0·5 mg/ml (final concentration) [18]. SPS is a polymer molecule and due to potential batch-to-batch variation of SPS we suggest finding the optimal final concentration for LP analysis with each new SPS batch. Sera used in the CP and MBL pathway assays were applied to the wells in twofold serial dilutions starting with a 1:10 dilution and for the AP assay a 1:4 dilution. Specific buffers were used to ensure that only the pathway in question was activated. The depositions of C3 (measured by monoclonal anti-human C3, clone C3 F1–8 at 2 µg/ml, an antibody described previously [19] with an epitope on the β-chain of C3 that reacts with C3, C3b, iC3b and C3c) or the terminal complement complex (measured by anti-human C5b-9, DIA 011-0 at 2 µg/ml; Bioporto A/S, Gentofte, Denmark) were used to determine complement pathway capacity in these settings. In each assay, a pool of 12 sera from healthy individuals served as a serum calibrator. A high concentration of Tween 20 (0·5%) in serum dilution buffers was used to prevent unspecific complement deposition.
MBL pathway kit, WIESLAB® Complement System Screen COMPL 300, Euro-Diagnostica
MBL-deficient sera and samples, which showed reduced MBL activity in our assay in the present study, were analysed using the Wielisa kit. Samples were applied and the percentage of activity was calculated according to the instructions in the Wielisa package insert. With the purpose of illustrating the influence of the AP, MBL-deficient samples were diluted 1:10 instead of 1:101, as instructed in the protocol.
Assessment of MBL serum concentrations
Serum concentrations of MBL were determined using the applications in the MBL oligomer ELISA kit (Cat: KIT029CE; Bioporto A/S).
MBL genotyping
Polymorphisms of the MBL-2 gene were found by direct sequencing using ABI PRISM BigDye Terminator version 3·1 Cycle Sequencing Kit (Applied Biosystems, Carlsbad, CA, USA) and an ABI Prism 3100 Genetic Analyzer (Applied Biosystems).
Data analysis
The complement activity for each pathway was expressed as a percentage of the activity of the calibrator serum.
Optical density (OD) data were evaluated using regression analysis on logistically transformed values, an algorithm that comprised several steps, as illustrated in Fig. 1. Initially, the repeatability of the determination of OD of the duplicate data sets for each sample was evaluated. In all cases the data sets were very similar and, accordingly, all data points were pooled for each sample for further analysis.
Fig. 1.

(a–d) An example of a regression analysis on logistically transformed optical density (OD) values used to determine the complement activity as percentage of the activity of a positive standard serum. (a) Duplicate raw data of the lectin pathway (LP) C3 deposition of two serum samples: a calibrator serum (solid symbols) and a donor serum (open symbols), with OD as a function of the power of the repeated twofold dilutions from each dilution series. (b) Due to the maximum limit of the OD determination, only the last value of OD = 3·5 is maintained in each dilution series, while the prior maximum determinations are omitted. (c) OD values are divided by 3·6 to transform the OD data to values between 0 and 1, which are then logistically transformed, y' = ln[y/(1–y)]. (d) A background level of OD = 0·15 is observed, and values below the corresponding logistically transformed value of −3·135 are omitted. A linear regression is then fitted to the remaining data points and dilution factors are compared at 50% of the maximum OD of 3·5, i.e. at OD = 1·75, equal to a transformed value of −0·056.
Raw data for the C3 deposition of the MBL pathway of the calibrator serum (filled circles) and a donor serum (open circles) are given in Fig. 1a. Due to the maximum limit of the OD determination, a number of consecutive measurements of OD = 3·5 is often observed in each dilution series. Consequently, only the last value of OD = 3·5 was maintained in each dilution series, while the previous maximum determinations were omitted (Fig. 1b). Subsequently, all OD values were divided by 3·6, which is just higher than the maximum OD of 3·5. The value of 3·6 was chosen to transform the OD data to values above 0, but below 1, as required for the subsequent logistic transformation, y' = ln[y/(1–y)], as illustrated in Fig. 1c. A background level of OD = 0·15 was observed, and values below the corresponding logistically transformed value of −3·135 were omitted from further analysis. A linear regression was fitted to the remaining data points and dilution factors were compared at 50% of the maximum OD of 3·5, i.e. at OD = 1·75 (equal to a transformed value of −0·056), as indicated in Fig. 1d. In this example, the dilution factor of the calibrator serum was 24·911 = 30·1 while the dilution factor of the donor serum was 22·397 = 5·3, and hence the control serum was diluted 30·1/5·3 = 5·7 times more than the donor serum. Consequently, the functional activity of the MBL pathway of the donor was 100%/5·7 = 17·5% of the activity of the control serum.
Results
Distribution of functional complement activity in a panel of 150 healthy Danish blood donors
In order to determine the normal level of activity for the three pathways of complement, sera from 150 healthy Danish blood donors were analysed using the methods described in the Materials and methods section.
Complement activity of the AP and the CP was measured in all donors, and the activity data followed a normal distribution (AP: W = 0·99, P = 0·25; CP: W = 0·99, P = 0·17, Shapiro–Wilk test) (Fig. 2a). The mean percentage activity level for the AP was 91% (range 54·8–129·2%) and for the CP was 101% (range 57·4–161·9%) (Fig. 2b). The lower cut-off value of normal AP and CP functional pathway activity was defined as the mean – 1·96 × standard deviation (SD), resulting in a lower cut-off value of normal pathway activity for the AP at 59% and at 61% for CP, respectively.
Fig. 2.

(a) Normal activity of complement activity of the alternative, classical and mannose-binding lectin (MBL) pathway measured in 150 healthy blood donors. The quantile box-plot shows the median (line) and the quartiles (25th and 75th percentiles) defining the interquartile range. The ends of the whiskers are the outermost data points from their respective quartiles that fall within the distance computed as 1·5 × the interquartile range. (b) The distribution of the normal complement activity for the alternative, classical and MBL pathway measured in 150 healthy blood donors. The quantile box-plot shows the median (line) and the quartiles (25th and 75th percentiles) defining the interquartile range. The ends of the whiskers are the outermost data points from their respective quartiles that fall within the distance computed as 1·5 × the interquartile range. The mean diamond identifies the mean and the 95% confidence interval about the mean.
In contrast, the MBL pathway activity data did not follow a normal distribution (P = 0·003; Shapiro–Wilk test). The data showed a large variation with a bimodal distribution (Fig. 2a). The mean activity for the MBL pathway was 66·3% (range: 0–209·1%) (Fig. 2b). The MBL activity of the donor sera was correlated highly to the serum MBL concentration (r2 = 0·70, P < 0·0001) (Fig. 3). Given the relatively high frequency of individuals with MBL deficiency in the general population, it is somewhat troublesome to define a normal MBL activity range without taking into consideration individuals with somatic mutations in the MBL2 gene leading to MBL structures with very low binding avidities. In an attempt to define a meaningful cut-off value for normal MBL pathway activity, 22 donors with MBL pathway activities between 0 and 43% were MBL genotyped (Table 1). It was decided to define the cut-off activity level as the lowest activity level measured in a XA/D individual among these genotyped donors.
Fig. 3.

Relation between serum concentration of oligomerized mannose-binding lectin (MBL) (ng/ml) and MBL pathway activity (%) in healthy blood donors; linear regression: r2 = 0·70, P < 0·0001; n = 150.
Table 1.
Mannose-binding lectin (MBL) genotypes of 23 healthy blood donors with functional MBL pathway activity given as C3 deposition (0–43%) and C5b-C9 deposition (0–44%) as readout
| MBL pathway activity (%) | MBL pathway activity (%) | |
|---|---|---|
| Readout: C3 deposition | Readout: C5b-C9 | MBL genotype |
| 0 | 0 | LYPB/HYPD |
| 0 | 0 | LYPB/HYPD |
| 0 | 0 | LYPB/HYPD |
| 0 | 0 | LYPB/HYPD |
| 0 | 0 | LYPB/LYPB |
| 0 | 0 | LYPB/HYPD |
| 0 | 0 | LYPB/LYPB |
| 0 | 0 | HYPD/LYQC |
| 0 | 0 | LYPB/LYPB |
| 0 | 0 | LYPB/LXPA |
| 0 | 0 | LYPB/LXPA |
| 0 | 0 | LYPB/LXPA |
| 11 | 14 | LYPA/LYQC |
| 8 | 7 | LXPA/HYPD |
| 18 | 18 | LXPA/HYPD |
| 18 | 15 | LXPA/HYPD |
| 27 | 22 | LXPA/LXPA |
| 36 | 30 | LXPA/LXPA |
| 26 | 27 | LYPB/HYPA |
| 34 | 25 | LYPA/LYQC |
| 37 | 44 | LYPB/HYPA |
| 43 | 33 | LYPB/LYQA |
The lowest MBL pathway activity level measured in a XA/D individual among the genotyped donors was 8% (Table 1). Therefore, the cut-off activity for normal MBL pathway activity was set at 8%.
Comparison of measurement of MBL pathway functional activity with a commercially available assay kit (Wielisa)
The functional complement assay for the MBL pathway described here avoids interference from the CP and the AP due to the addition of SPS to the assay buffer, which in the concentration used completely inhibits the CP and the AP. The commercial Wielisa MBL kit requires a serum dilution of 1:101 to avoid interference from the AP. To demonstrate potential interference when assessing the MBL pathway activity with the Wielisa kit, seven MBL-deficient (O/O) samples were analysed using this Wielisa kit (Fig. 4a). Furthermore, 10 samples with reduced MBL pathway activity (8–43%) measured in our MBL pathway activity assay (with C3 deposition as readout) were also analysed using the Wielisa kit at the dilutions recommended by the manufacturer (1:101). All seven MBL-deficient samples (O/O) had measurable MBL pathway activities using the Wielisa kit (Fig. 4a, left panel) at serum dilutions of 1:10, while 60% (six of 10) of the samples, which showed low but measurable MBL pathway activities in our MBL pathway activity assay, showed no MBL pathway activity in the Wielisa kit at the dilutions recommended by the manufacturer (Fig. 4a, right panel). For a proper comparison we also measured the terminal complex C5b-9 deposition in our assay. The results showed that the seven samples, which were homozygous MBL-deficient, had no C5b-9 deposition (Fig. 4b, left panel) and those samples with reduced but measurable levels also showed measurable C5b-9 depositions (7–44%) (Fig. 4b, right panel). The C5b-9 data correlated to the C3 deposition results (Spearman's r: 0·99, P < 0·0001) and are displayed in Table 1.
Fig. 4.
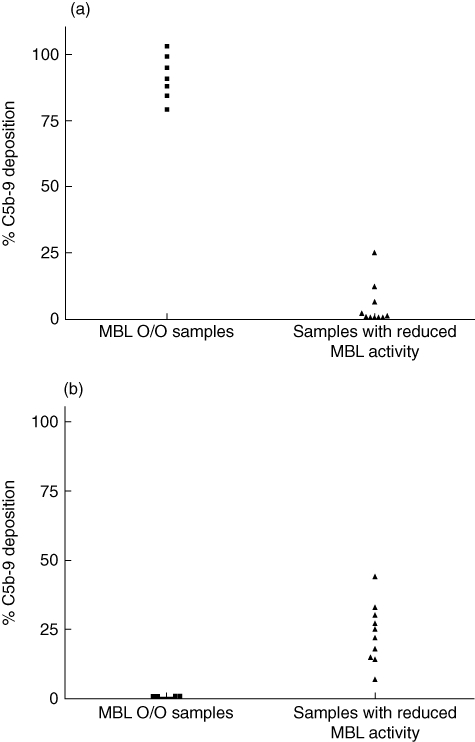
(a–b) Comparison of mannose-binding lectin (MBL) pathway assays. (a) % MBL pathway activity measured using the Wielisa MBL pathway kit (WIESLAB® Complement System Screen COMPL 300; Euro-Diagnostica). Seven homozygous MBL-deficient sera (O/O) diluted 1:10 (a, left panel) and 10 serum samples with reduced, but measurable MBL activity diluted 1:101 as instructed according to the accompanying Wielisa protocol (a, right panel) were analysed for MBL pathway activity using the Wielisa kit. Readout: C5b-9. (b) % MBL pathway activity measured using the MBL pathway assay described in this study. The same seven homozygous MBL-deficient sera (O/O) (b, left panel) and 10 serum samples with reduced MBL activity (a, right panel) as analysed with the Wielisa kit. Readout: C5b-9.
Complement functional activity in sera from individuals with known complement deficiencies
Thirty sera with well-defined complement deficiencies were assayed for the complement activity (Fig. 5a–c). Sera from C2-deficient samples showed normal alternative pathway activity and undetectable classical and MBL pathway activity. Serum samples from patients with factor I or factor H deficiency were tested. Both samples showed no functional AP activity and reduced CP and LP activities.
Fig. 5.

(a–c) Serum samples with well-defined defects in complement components were analysed in our assay for alternative (a), classical (b) and mannose-binding lectin (MBL) (c) pathway activity. The dotted lines indicate the lower cut-off values for normal activity for the different pathways.
C1 inhibitor deficiency leads to lack of control of the normal regulation of C1 esterase activity, which may cause a continuous consumption of C4 and/or C2. Sera from nine patients with this deficiency (causing the clinical manifestation hereditary angio-oedema; HAE) were analysed. All sera showed reduced CP activity and five samples showed reduced or no LP activity (Fig. 5a–c). In contrast, the AP activity was normal in all HAE samples. Finally, MBL-deficient individuals showed no MBL pathway activity but normal CP and AP activity.
Discussion
Assays measuring complement-mediated haemolysis of erythrocytes are used widely to assess the functional activity of the classical and alternative pathway in clinical laboratories. However, several ELISA-based assays for the assessment of complement capacity have been described recently, and compared to haemolytic assays these methods are easy to perform due to their simplicity and reproducibility, and furthermore they allow for a high throughput. Recently, a commercial complement kit containing standardized ELISA-based assays for the assessment of all three complement pathways in clinical laboratories has been released. In this kit the MBL LP pathway is measured in wells coated with mannan and the contribution from the CP is inhibited by the use of a blocking anti C1q antibody [20]. Contribution from the AP is avoided by a minimal dilution of sera 1:101. These assays were validated in three different laboratories and they demonstrated high stability and reproducibility. However, one major concern associated with these assays is the interference of the AP when assessing the functional capacity of the LP.
Using novel ELISA set-ups in the present study, the normal functional activity of the three complement activation pathways was determined using serum samples from 150 healthy Danish blood donors. The functional capacity of the CP, determined as deposition of C3 on immune complexes, showed a normal distribution with a mean activity of 101% (57·4–161·9%). The capacity for the AP was determined as the deposition of C3 on an LPS-coated surface and showed a range of to 54·8–129·2%, with a mean value of 91%. Because of the normal distribution of the AP and the CP functional pathway activity, the lower cut-off value of normal activity was defined as the mean –1·96 × SD, resulting in a lower cut-off value of normal complement activity for the AP at 63·5% and 61% for CP. As expected, and in agreement with Garred et al. [8] and Seelen et al. [21], the complement activation capacity for the MBL pathway among healthy blood donors showed a large variation range with a bimodal distribution. This is due mainly to the variations in degrees of oligomerization of MBL as the concentration of functional MBL is the primary limiting factor for the LP activity. This was confirmed by a strong positive correlation between the MBL serum concentration and the functional MBL pathway activity (r2 = 0·70, P < 0·0001).
Given the relatively high frequency of individuals with MBL deficiency in the general population, it is important to define a normal MBL activity range. In attempt to define a pathway activity, it was decided to define the meaningful cut-off value for normal MBL cut-off activity level as the lowest activity level measured in an XA/O individual (selected from genotyping of individuals with MBL pathway activities between 0 and 43%). The highest MBL pathway activity level measured in a XA/O individual among the genotyped donors was 8% (Table 1), while all O/O individuals among the genotyped donors had no functional MBL pathway activity.
The results also showed that 9·3% of the healthy donors had no (0%) MBL activation potential, all of which were either homozygous or compound heterozygous for structural MBL2 gene mutations. This is in agreement with previous observations, that 5–10% of the Caucasian population is MBL-deficient [7].
It is well known that mannan besides activating the MBL pathway also has the potential to trigger activation of the CP and the AP [22]. In assays that are not able to block the influence of the AP when measuring the MBL activity, it is necessary to dilute the serum up to a level where the contribution from the AP is minimal. This may result in false negative MBL measurements in samples where the MBL activity is only reduced. The results obtained by Seelen et al. [21] showed that 28% of the 120 sera from healthy donors had functional MBL activities below a normal threshold set at 10%, which is an unrealistically high proportion of MBL-deficient individuals in a normal population. This may be due to the fact that the serum samples were diluted 1:101 prior to analysis, and thus samples with low MBL activity will read out as negative. This present ELISA set-up using SPS for assessment of the MBL activity completely blocks the interference from the AP and the CP, allowing valid analysis of samples in high serum concentration. By analysing serum samples in twofold serial dilutions starting at a high serum concentration (10%), a more precise determination of MBL activity is obtained, which removes the risk of generating false negative measurements. Data were analysed using regression analysis on logistically transformed values taking the dilution factor into account. To illustrate the influence of the AP when measuring MBL pathway activity on a mannan-coated surface, seven samples with no MBL pathway activity (all either homozygous or compound heterozygous for the structural MBL-2 gene mutations) in our MBL activity assay were analysed using the commercial kit Wielisa for assessment of MBL pathway. Each sample was analysed using 1:10 dilutions. All samples, which should have no functional MBL pathway activity, showed measureable false positive MBL pathway activities. This clearly indicates interference from the AP and illustrates why it is necessary to dilute samples in order to minimize the influence of the AP using this commercial kit. The concerns regarding diluting samples at 1:101 prior to analysing MBL pathway activity, which may give false negative results, were also tested using the Wielisa kit. The results obtained from the kit showed that six of 10 samples (two XA/XA, four XA/O and four YA/O), which had measurable MBL activity in our assay, showed no MBL pathway activity using the Wielisa kit. Taken together, the data indicate a risk of both false negative and false positive results using MBL pathway assays that do not block the AP.
Although the terminal complement complex (C5b-9) is used as readout in the above-mentioned commercial assay, we recommend the use of the central complement factor C3 as readout in the assays presented in this study. C5b-9 (TCC) is a heterogeneous complex [23] that opposed to C3b does not attach covalently to the target surface. Readout of a neo-epitope on the TCC, which is dependent of hydrophobic interactions with the target, could thus be influenced by other factors than the upstream complement components.
The complement activity levels were analysed in patients with defined complement deficiencies. Serum samples deficient in C2 showed normal AP activity but undetectable CP and LP activity. This is due to a lack of formation of a functional CP and LP C3-convertase. Factor I and factor H deficiency leads to sustained consumption of complement, which explains the reduced complement activity in all the pathways. Sera from patients diagnosed with HAE, due to lack of the inhibitor of C1r/s (C1INH) were also tested. Lack of C1INH leads to consumption of components of the classical pathway [24], and consistent with this, a decreased functional activity of the classical pathway was demonstrated in nine of 10 of these sera.
These results demonstrate that by analysing and comparing the functional capacity of each complement pathway, it is possible to obtain reliable clues to which component(s) of the complement system that are functionally defect or present in insufficient amount to activate complement.
In summary, we have developed and analysed ELISA-based assays for the measurement of the functional activation capacity of the three complement pathways. These methods are applicable at high serum concentrations, which minimize false negative and represent – especially for the assessment of the MBL activity – an improvement on the existing assays.
Acknowledgments
This work was supported by the University of Southern Denmark and the John and Birthe Meyer Foundation.
Disclosures
A PCT application (PCT/DK2008/050221) has been submitted for the use of SPS in complement assays.
References
- 1.Fujita T. Evolution of the lectin-complement pathway and its role in innate immunity. Nat Rev Immunol. 2002;2:346–53. doi: 10.1038/nri800. [DOI] [PubMed] [Google Scholar]
- 2.Le Friec G, Kemper C. Complement: coming full circle. Arch Immunol Ther Exp (Warsz) 2009;57:393–407. doi: 10.1007/s00005-009-0047-4. [DOI] [PubMed] [Google Scholar]
- 3.Ricklin D, Hajishengallis G, Yang K, Lambris JD. Complement: a key system for immune surveillance and homeostasis. Nat Immunol. 2010;11:785–97. doi: 10.1038/ni.1923. [DOI] [PMC free article] [PubMed] [Google Scholar]
- 4.Walport MJ. Complement. Second of two parts. N Engl J Med. 2001;344:1140–4. doi: 10.1056/NEJM200104123441506. [DOI] [PubMed] [Google Scholar]
- 5.Walport MJ. Complement. First of two parts. N Engl J Med. 2001;344:1058–66. doi: 10.1056/NEJM200104053441406. [DOI] [PubMed] [Google Scholar]
- 6.Thiel S, Vorup-Jensen T, Stover CM, et al. A second serine protease associated with mannan-binding lectin that activates complement. Nature. 1997;386:506–10. doi: 10.1038/386506a0. [DOI] [PubMed] [Google Scholar]
- 7.Sjoholm AG, Jonsson G, Braconier JH, Sturfelt G, Truedsson L. Complement deficiency and disease: an update. Mol Immunol. 2006;43:78–85. doi: 10.1016/j.molimm.2005.06.025. [DOI] [PubMed] [Google Scholar]
- 8.Garred P, Larsen F, Madsen HO, Koch C. Mannose-binding lectin deficiency – revisited. Mol Immunol. 2003;40:73–84. doi: 10.1016/s0161-5890(03)00104-4. [DOI] [PubMed] [Google Scholar]
- 9.Madsen HO, Satz ML, Hogh B, Svejgaard A, Garred P. Different molecular events result in low protein levels of mannan-binding lectin in populations from southeast Africa and South America. J Immunol. 1998;161:3169–75. [PubMed] [Google Scholar]
- 10.Madsen HO, Garred P, Thiel S, et al. Interplay between promoter and structural gene variants control basal serum level of mannan-binding protein. J Immunol. 1995;155:3013–20. [PubMed] [Google Scholar]
- 11.Peterslund NA, Koch C, Jensenius JC, Thiel S. Association between deficiency of mannose-binding lectin and severe infections after chemotherapy. Lancet. 2001;358:637–8. doi: 10.1016/S0140-6736(01)05785-3. [DOI] [PubMed] [Google Scholar]
- 12.Roy S, Knox K, Segal S, et al. MBL genotype and risk of invasive pneumococcal disease: a case–control study. Lancet. 2002;359:1569–73. doi: 10.1016/S0140-6736(02)08516-1. [DOI] [PubMed] [Google Scholar]
- 13.Koch A, Melbye M, Sorensen P, et al. Acute respiratory tract infections and mannose-binding lectin insufficiency during early childhood. JAMA. 2001;285:1316–21. doi: 10.1001/jama.285.10.1316. [DOI] [PubMed] [Google Scholar]
- 14.Bathum L, Hansen H, Teisner B, et al. Association between combined properdin and mannose-binding lectin deficiency and infection with Neisseria meningitidis. Mol Immunol. 2006;43:473–9. doi: 10.1016/j.molimm.2005.02.017. [DOI] [PubMed] [Google Scholar]
- 15.Mayer M. Complement and complement fixation. In: Kabat EA, Mayer MM, editors. Experimental immunochemistry. Springfield, IL: Charles C. Thomas; 1961. pp. 133–240. [Google Scholar]
- 16.Kuipers S, Aerts PC, Sjoholm AG, Harmsen T, van Dijk H. A hemolytic assay for the estimation of functional mannose-binding lectin levels in human serum. J Immunol Methods. 2002;268:149–57. doi: 10.1016/s0022-1759(02)00192-8. [DOI] [PubMed] [Google Scholar]
- 17.Suankratay C, Zhang XH, Zhang Y, Lint TF, Gewurz H. Requirement for the alternative pathway as well as C4 and C2 in complement-dependent hemolysis via the lectin pathway. J Immunol. 1998;160:3006–13. [PubMed] [Google Scholar]
- 18.Skjoedt MO, Palarasah Y, Rasmussen K, et al. Two mannose-binding lectin homologues and an MBL-associated serine protease are expressed in the gut epithelia of the urochordate species Ciona intestinalis. Dev Comp Immunol. 2010;34:59–68. doi: 10.1016/j.dci.2009.08.004. [DOI] [PubMed] [Google Scholar]
- 19.Palarasah Y, Skjodt K, Brandt J, et al. Generation of a C3c specific monoclonal antibody and assessment of C3c as a putative inflammatory marker derived from complement factor C3. J Immunol Methods. 2010;362:142–50. doi: 10.1016/j.jim.2010.09.024. [DOI] [PubMed] [Google Scholar]
- 20.Roos A, Bouwman LH, Munoz J, et al. Functional characterization of the lectin pathway of complement in human serum. Mol Immunol. 2003;39:655–68. doi: 10.1016/s0161-5890(02)00254-7. [DOI] [PubMed] [Google Scholar]
- 21.Seelen MA, Roos A, Wieslander J, et al. Functional analysis of the classical, alternative, and MBL pathways of the complement system: standardization and validation of a simple ELISA. J Immunol Methods. 2005;296:187–98. doi: 10.1016/j.jim.2004.11.016. [DOI] [PubMed] [Google Scholar]
- 22.Roos A, Garred P, Wildenberg ME, et al. Antibody-mediated activation of the classical pathway of complement may compensate for mannose-binding lectin deficiency. Eur J Immunol. 2004;34:2589–98. doi: 10.1002/eji.200324401. [DOI] [PubMed] [Google Scholar]
- 23.Bhakdi S, Tranum-Jensen J. Terminal membrane C5b-9 complex of human complement: transition from an amphiphilic to a hydrophilic state through binding of the S protein from serum. J Cell Biol. 1982;94:755–9. doi: 10.1083/jcb.94.3.755. [DOI] [PMC free article] [PubMed] [Google Scholar]
- 24.Carugati A, Pappalardo E, Zingale LC, Cicardi M. C1-inhibitor deficiency and angioedema. Mol Immunol. 2001;38:161–73. doi: 10.1016/s0161-5890(01)00040-2. [DOI] [PubMed] [Google Scholar]