Abstract
In comparing open and closed economies, researchers often arrange shorter sessions under the former condition than under the latter. Several studies indicate that session length per se can affect performance and there are some data that indicate that this variable can influence demand functions. To provide further data, the present study exposed domestic hens to series of increasing fixed-ratio schedules with the length of the open-economy sessions varied over 10, 40, 60, and 120 min. Session time affected the total-session response rates and pause lengths. The shortest session gave the greatest response rates and shortest pauses and the longest gave the lowest response rates and longest pauses. The total-session demand functions also changed with session length: The shortest session gave steeper initial slopes (i.e., the functions were more elastic at small ratios) and smaller rates of change of elasticity than the longest session. Response rates, pauses, and demand functions were, however, similar for equivalent periods of responding taken from within sessions of different overall lengths (e.g., total-session data for 10-min sessions and the data for the first 10 min of 120-min sessions). These findings suggest that differences in session length can confound the results of studies comparing open and closed economies when those economies are arranged in sessions that differ substantially in length, hence data for equivalent-length periods of responding, rather than total-session data, should be of primary interest under these conditions.
Keywords: open economy, closed economy, behavioral economics, demand functions, session length, fixed-ratio schedule, domestic hens
Demand functions show the relation between the price of a commodity and the amount consumed. They have been used to assess the relative importance of commodities, such as different drugs, to animals (e.g., Ko, Terner, Hursh, Woods, & Winger, 2002). Such studies frequency use fixed-ratio (FR) schedules where the response requirement is taken as analogous to price. The FR is varied and the number of reinforcers obtained over a set time period for each FR is taken as the measure of consumption (Hursh, 1984). When price and consumption are plotted on a log–log scale with price, the dependent variable, on the x-axis, the slope of the resulting function can be used to assess the elasticity of demand (Hursh, 1980; 1984). Small changes in consumption relative to corresponding changes in price are evidence of inelastic demand (Hursh, 1980; 1984), and are demonstrated by a slope less steep than −1 (Hursh, 1980). Elastic demand refers to large changes in consumption relative to corresponding changes in price (Hursh, 1980; 1984). Elastic demand is demonstrated by a slope steeper than −1 (having a numeric value less than −1). Mixed elasticity is also possible, and is shown by curvilinear demand functions where the point slope, representing elasticity at a particular price point, changes as the price increases (Hursh, 1984).
Mixed elasticity is a frequent finding (e.g., Foltin, 1992; 1994; Foster, Sumpter, Temple, Flevill, & Poling, 2009; Hursh, 1984; Hursh, Raslear, Shurtleff, Bauman, & Simmons, 1988) and Hursh et al. (1988) proposed the following equation to describe such functions, in natural logarithms:
where Q refers to total consumption (e.g., the total number of reinforcers obtained or reinforcer amount consumed over the period of observation), P denotes price (e.g., the FR schedule value) and L, b, and a are free parameters. The parameter L estimates the initial level or intensity of consumption at the minimal price and reflects the height of the demand function above the origin. The parameter b is the initial slope of the demand function, and the parameter a is the rate of change in the slope of the function across price increases. When a is 0 the function reduces to a straight line in log–log coordinates. Demand functions are frequently inelastic at low prices and change to being elastic at higher prices. The change in elasticity occurs because responding increases over price changes at small prices (inelastic demand) and then starts to decrease with further increases in price; that is, response rates change bitonically as price increases. The price associated with the maximal response output is the point at which demand changes from inelastic to elastic. This has been termed Pmax (Hursh et al., 1988), and can be found from:
Although other equations have been proposed to describe mixed-elasticity data (e.g., Holm, Ritz, & Ladewig, 2007; Hursh & Silberberg, 2008), Equation 1 has been used frequently and has been found to describe such data well.
One variable that can influence the shape of the demand curve is the type of economy used. Hursh (1984) suggested that economies in typical experimental procedures can be defined as open or closed, and there may also be degrees of openness. In an open economy, the commodity is available both within and outside of the experimental session (Foster, Blackman & Temple, 1997; Hursh, 1984). In contrast, in a closed economy, the commodity (typically food) is available only within the experimental session (Foster et al., 1997; Hursh, 1984; Tsunematsu, 2000). Attempts to manipulate the types of economy often result in covariation in the type of economy and the length of the experimental sessions (Tsunematsu, 2000). Often, in order to provide an open economy, the amount of food available in a session is fixed so that supplementary food is needed outside of the experimental session. Therefore, sessions are often terminated after a fixed number of reinforcers, and so sessions vary in length depending on the size of the FR in effect. Sessions tend to be short with small FR schedules, and to increase as the FR increases. In contrast, to provide a closed economy requires that the subject receives its entire daily food requirement within the experimental session. This means sessions have to be long enough to allow the animals to gain their food within the time allowed even at larger FR values, and so sessions in closed economy experiments are generally longer than those in open economies (Posadas-Sanchez & Killeen, 2005). Foster et al. (1997) and Tsunematsu (2000) both suggested that differences in session length may contribute to the differences in response rates and patterns that have been seen both within and across experiments involving the two types of economies.
Research clearly shows that responding often changes both within and between sessions as a result of changes in session length (Dougan, Kuh, & Vink, 1993; McSweeney, 1992, 2004; McSweeney, Roll & Cannon, 1994; McSweeney & Swindell, 1999; Roll & McSweeney, 1997) and so it is possible that session length may contribute to the differences in findings from experiments using different length sessions. For example, McSweeney and Swindell investigated between- and within-session changes in rats' and pigeons' responding under FR schedules. During 60-min sessions with supplementary food available outside of the session the proportion of total-session responses over successive 5-min portions of the session either was bitonic or decreased monotonically over the session for a range of FR schedules. Because McSweeney and Swindell varied the FR values over a range, they could perform a demand analysis. They examined changes in demand within the sessions using data taken from each successive 5-min interval of the session and fitted Equation 1, with a set at 0. The initial level of demand (ln L) showed a statistically significant decrease across successive intervals of the session for both rats and pigeons. The elasticity of the linear demand function (b) changed over the session in the same direction for both species. For pigeons, it changed from near unit elasticity (b close to −1) to strongly inelastic (b near 0). For rats, it changed from elastic (b less than −1) to just inelastic (b just above −1). Based on these linear functions, for both rats and pigeons demand tended to be more elastic at the start of the session than at the end of the sessions and the level or intensity of demand decreased as the session progressed. McSweeney and Swindell's data show that the shape and elasticity of the demand functions change over the course of a session but they do not address whether they also change as a function of session length.
Tsunematsu (2000) addressed this question. He compared demand functions from pigeons under several FR schedules and under FI schedules matched in length to these FRs across 1.5-, 3-, and 4.5-hr closed-economy sessions. Tsunematsu reported greater consumption (measured as weight of food consumed) under the FI schedules than under the FR schedules. Mixed elasticity was evident across both FI and FR schedules. That is, demand was inelastic at low ratios and intervals, but elastic at high ratios and intervals. Using a time-based unit price (time equivalent per reinforcer duration) to allow comparisons of the data from both schedule types, and fitting Equation 1 to the total-session data, Tsunematsu found that initial consumption increased as session length increased, and b decreased as session length increased but remained greater than −1. His analysis revealed that neither a nor Pmax changed systematically with session length. It should be noted, however, that only 2 pigeons and four FR schedule values were used to obtain these data.
That the initial intensity of demand increased with session length is not surprising as longer sessions allow more time to acquire and consume food reinforcers. Although McSweeney and Swindell (1999) showed demand became less intense as the session progressed in 60-min open-economy sessions, any additional reinforcers earned in longer sessions under small FR schedules would result in increases in intensity of demand for the total-session data. The decreases in b found by Tsunematsu (2000) show that demand at the smallest FR values became more elastic with the longer sessions. For both of the pigeons, however, the b values remained larger than −1, showing that the functions were still inelastic under small FR schedules. No response rate data are presented so it is not clear how responding changed with session length. The finding of increasing initial elasticity (b) with increasing session length together with the shape of the demand functions shown, suggest that the response rate functions were bitonic under all FR schedules for the shorter sessions and were still bitonic but flatter for the longer sessions. Such response rate changes might arise if there were little change in response rates with session length for large FR values (which could result if responding persisted throughout a longer session for these FRs) and if there were changes in pausing at small FR values that resulted in lower response rates for the longer sessions. From the data provided, however, it is not clear how responding changed.
As Tsunematsu (2000) pointed out, more data are required to understand the relationship between session length and demand. Within-session patterns of behavior were not the focus of Tsunematsu's study and so are not reported. To understand the effects of session length it would be of interest to see, for example, how the first 1.5 hr of responding under the 3-hr session compared with responding in the 1.5-hr session. The changes in the parameters of the demand function seen with the total session data may be interpretable in the light of within-session data. Given these considerations, the present study assessed the effects of different-length sessions on both the within-session response patterns and the total-session responding of domestic hens responding under FR schedules that were increased each session using a similar procedure to Foster et al. (2009). The session lengths used in this study (10, 40, 60, and 120 min) covered the range found in most open and closed economy experiments. The economy was kept open in that supplementary food was provided when required to maintain body weight. Both total session and within-session data were examined.
METHOD
Subjects
The subjects were 6 Shaver Starcross hens, numbered 81 to 86. The hens were maintained at 85% (+ /−5%) of their free-feeding body weight through daily weighing and the provision of supplementary feed (commercial laying pellets) as required. Outside of the session they were individually housed in 300 mm × 450 mm × 430 mm wire cages where water was freely available. Grit and vitamins were supplied weekly. All hens had previous experience responding under simple schedules of reinforcement.
Apparatus
The experimental chamber was 620 mm long, 580 mm wide, and 540 mm high and was made of particleboard. The floor consisted of a wire mesh grid enclosed in a galvanized steel tray 35 mm high. On the right wall, situated centrally and 380 mm above the floor, was a translucent disc (response key) 30 mm in diameter, which required a minimum force of 0.1 N to operate. When operational, the key was illuminated from behind by a white 1-W bulb, and each effective response resulted in a brief audible feedback beep. An opening, 100 mm high × 70 mm wide, was situated 130 mm below the response key and provided access to the food magazine. Reinforcement consisted of 3-s access to wheat. During reinforcement, the magazine was raised and illuminated by a white light, and the key light was extinguished. The key and magazine lights were the only source of light in the experimental chamber. A computer, interfaced with a programmable control board (Med Associates) and using MED 2.0R software, was located in a separate room. It controlled and recorded all experimental events.
Procedure
At the start of each session a hen was placed in the experimental chamber and the program that controlled experimental events was started. During experimental sessions the key was illuminated and operative and pecks to it resulted in reinforcement according to the FR schedule in effect for that session, except during periods of reinforcement, during which food was presented and the key was dark and inoperative. Reinforcement consisted of 3-s access to wheat in the raised food hopper. Experimental sessions ended after 10, 40, 60 or 120 min of “key time” depending on which condition was in effect. Key time was counted as the accumulated time during which the key was lit, that is, it did not include the time the magazine was operative.
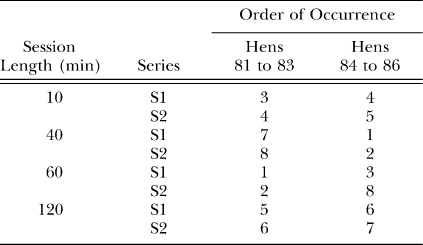
The session length in effect in each experimental condition is shown in Table 1. Each condition consisted two series of FR schedules; the orders in which these occurred for Hens 81 to 83 and Hens 84 to 86 are also shown in Table 1. The hens responded under an FR 20 schedule between FR series for at least 3 sessions when the session length was not changed and for at least 14 sessions after a change in session length. The first FR requirement in each series was FR 1, with the requirement doubling (i.e., FR 1, 2, 4, 8 etc.) in each subsequent session, provided the hen had obtained at least one reinforcer in the previous session. If the hen did not obtain a reinforcer in any session, she was reexposed to the same FR schedule during the next session. If at least one reinforcer was obtained in that session, the session-to-session increments in FR value continued for that hen. Following two consecutive sessions in which the hen received no reinforcers the FR series was deemed completed and the schedule in the next session was again FR 20. The highest FR under which at least one reinforcer was obtained in each series of each condition for each hen is shown in Table 2. Once all hens had completed an FR series, the session length was changed, if required, and the next series was started after completion of the required number of sessions at FR 20. Hens completed two FR series under each session length. The exception was the 40-min condition for Hen 83, where only one FR series was completed.
Table 1.
The session lengths in the experimental conditions and the order in which the two FR series (S1 and S2) in each condition occurred.
Table 2.
The highest FR reached in each of the two FR series in each session-length condition for each hen.
One session was normally conducted for each hen on each of 5 or 6 days a week. When session length was long and small FR values were in effect, however, then the additional time from the numerous magazine operations added to the actual session length making it difficult to fit all 6 hens' sessions into one day. When this happened, sessions for the remaining hens were conducted on the next day.
Hens were maintained at 85 +/− 5% of their free-feeding body weight by the provision of supplementary food after an experimental session. On any day when a hen was not tested, she was provided with 50 cc of commercial laying pellets in addition to any supplementary feed she received to maintain weight. Hens who were not receiving any supplementary post-session feed received 50 cc of commercial laying pellets after any session in which they received fewer than five reinforcers.
The following total-session data were recorded at the end of each session: the FR schedule in effect, the time to the first response, the total number of responses made and reinforcers obtained, the accumulated latency to the first response of a ratio from the time the magazine was lowered (the postreinforcement pause, or PRP), the accumulated time from the first to the last response of each FR requirement (run time), the total key time, and the total session time. In addition, every experimental event and the times at which it occurred was recorded by the computer, except that the data from the 40-min session length conditions for Hens 81 to 83 were lost due to a computer error.
RESULTS
Total-Session Data
The total-session data from both series for each session-length condition were compared and there was no consistent difference for any hen. Therefore, for ease of presentation, the data were averaged over the two series for each FR value and data from only FR values that were reached in both series for a given bird are included in the following analyses. Table 2 shows that for all hens the highest FR reached over the two series in a condition were either equal or differed by one FR. The averaging means that data from the highest FR in one FR series are not included for one condition for Hen 85, for two conditions for Hens 82, 83, 84 and 86, and for all four conditions for Hen 81.
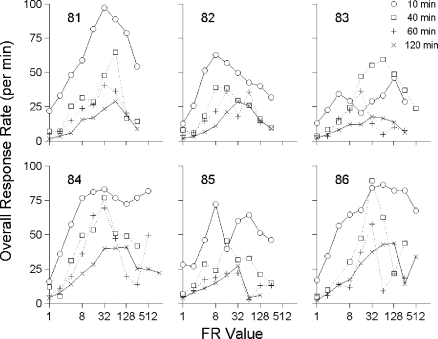
Figure 1 shows the average overall response rates, calculated as the total number of responses divided by key time, plotted against the FR value (on a logarithmic x-axis) for each session length. The data generally formed bitonic functions. The 10-min condition resulted in the fastest response rates at all FR values. At the smaller FR values there were only small differences in response rates for the 40-, 60-, and 120-min conditions, but rates in the 120-min condition were usually the lowest. As the FR increased, the 120-min condition usually had the slowest response rates, but the differences between the response rates from the three longer session lengths tended to decrease with the very largest FR sizes.
Fig 1.
The overall response rates, calculated as the total number of responses divided by key time, averaged over the two series in each condition, plotted against the FR value (on a logarithmic x-axis) for each condition and each hen.
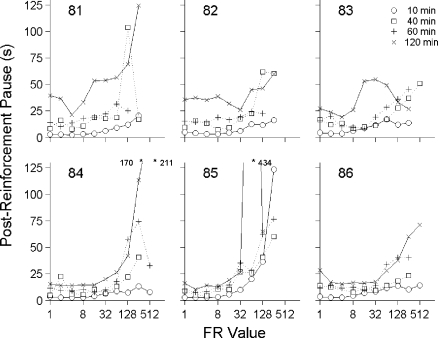
Figure 2 shows that the average PRP duration (the total PRP time divided by the number of reinforcers obtained) generally increased as the FR value increased. PRPs were short for the 10-min condition for all hens. The PRPs for Hens 81 to 83 tended to be longest in the 120-min condition. The differences in pause lengths across conditions for Hens 84 to 86 were not as large as those for the other hens but their longest pauses also usually occurred during the 120-min condition.
Fig 2.
The mean PRP durations (total PRP time divided by the number of reinforcers obtained) averaged over the two series in each condition, plotted against the FR value (on a logarithmic x-axis) for each condition and each hen. There are three data points beyond the scale of this figure and their values are indicted in the top of the relevant graphs.
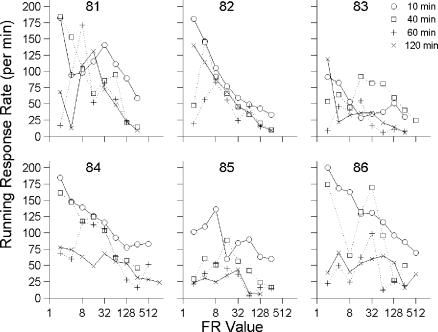
Figure 3 shows the average running-response rates (the total number of responses divided by the total run time). Note that running response rate cannot be calculated for FR 1. Response rates decreased as FR value increased for the 10-min condition, and rates from the 10-min condition tended to be higher than those from the other conditions for all hens except 83. Some of the running-response rates from the three longer session lengths also decreased with long FR values, but some increased at the smallest FRs then decreased with further increases in FR value. The running-response rates from the 60-min and the 120-min conditions were not consistently different for any hen.
Fig 3.
The running response rates (total number of responses divided by the total run time) averaged over the two series in each condition, plotted against the FR value (on a logarithmic x-axis) for each condition and each hen.
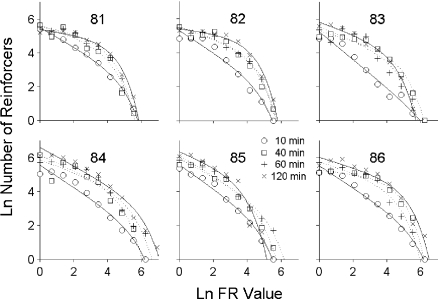
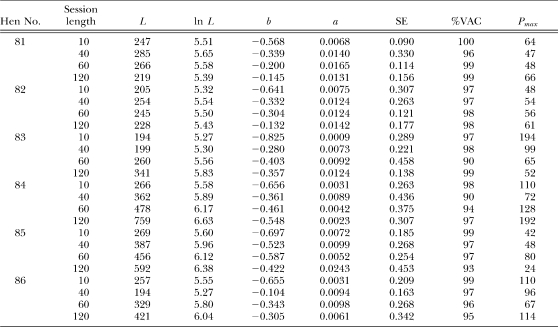
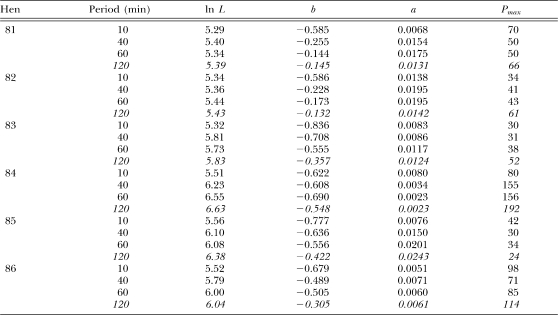
The natural logarithm of the average number of reinforcers obtained is shown in Figure 4, plotted against the natural logarithm of the FR value for each condition and each hen. Equation 1 was fitted to these data using curvilinear regression and the method of least squares. These functions are shown on the graphs and their parameter values and the measures of fit are shown in Table 3. The data generally showed mixed elasticity, with the 10-min condition functions lower than those from the three conditions with longer session lengths, and no consistent overall differences among the data from the 40-, 60-, and 120-min conditions. Table 3 shows that the functions fitted the data well, accounting for over 90% of the data variance and with small standard errors in all cases, and with no consistent differences for either measure over conditions for all hens. Table 3 shows that ln L increased with session length for Hens 83 to 86, but remained relatively constant for Hens 81 and 82. The elasticity at minimal price (b) was smallest for the 10-min condition (most elastic) and was substantially higher for the 120-min condition (indicating less elastic demand), but the change in b did not reflect a monotonic increase with session length for all hens. The rate of change of elasticity, a, was smallest for the 10-min condition for 4 hens (84 and 85 were the exceptions), and was smaller than that from the 120-min condition for 5 hens (84 was the exception). There were no consistent changes in a over the three longer session-length conditions. Table 3 also shows that Pmax did not change consistently over conditions. Thus, L changed systematically with session length, and there were differences in a and b from the shortest and longest sessions, but these variables did not change monotonically across conditions for all hens.
Fig 4.
The natural logarithm of the average number of reinforcers obtained plotted against the natural logarithm of the FR value, averaged over the two series in each condition, for each condition and each hen. The functions shown were obtained by fitting Equation 1 to these data using curvilinear regression and the method of least squares.
Table 3.
The parameter values obtained by fitting Equation 1 to the natural logarithms of the number of reinforcers and the natural logarithms of FR value for the total-session data for each hen for each session-length condition. The standard error of the fits (SE), the percentage of variance in the data the function account for (%VAC) and the Pmax obtained using Equation 2 are also shown.
Within-Session Data
The event data were used to obtain the overall response rates and consumption (number of reinforcers obtained) across portions of the various length sessions. The aim was to compare data from portions of longer sessions equal in length to shorter sessions with data from those shorter sessions. Thus the data from the first 10 min of all session lengths, the first 40 min of the 40-, 60- and 120-min long sessions, and the first 60 min of the 60- and 120-min long sessions were extracted from the event data for all FR values in the first series of each condition. The time base excluded time the magazine was operative. Initially the data from the first 10, 20, 30, 40 and 60 min of the sessions were examined, but the 20- and 30-min data followed the patterns reported here and did not add new information, so they are not presented in these figures.
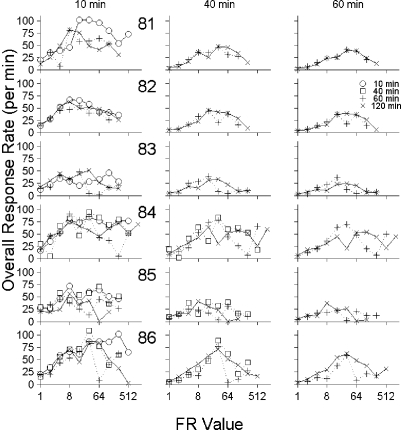
Figure 5 presents overall response rate data from the first FR series for the 10-, 60- and 120-min conditions for Hens 81 to 83 and for the 10-, 40-, 60- and 120-min conditions for Hens 84 to 86, plotted against the FR value. The resulting functions are generally bitonic and the only consistent difference between the response rates over any of the three periods for the various conditions was for the first 10-min period. Here, the 10-min condition response rates were generally higher for the larger FR values than for the same FRs in the first 10-min period of the 40-, 60-, and 120-min sessions. Note that the data for the first 10-min period for the 10-min sessions, the first 40-min period for the 40-min sessions, and the first 60-min period for the 60-min sessions are actually the total-session data for those conditions, but now derived from the event records from the first FR series only. The data paths for these are very similar to those in Figure 1, which are based on both FR series in each condition.
Fig 5.
The overall response rates from the first 10 min (left column), first 40 min (center column) and first 60 min (right column) of each session in Series 1 plotted against the FR value (on a logarithmic x-axis) for each hen. The different symbols indicate the total session durations.
The overall response rate functions for the first 20- and 30-min periods (not shown in Figure 5) were similar in shape to the first 40-min period data. The first 20-min rates were lower than the first 10-min rates, and the first 30-min rates were lower again, but both the first 20- and 30-min period response rates were higher than those of the first 40-min period for all hens and FR values.
Analyses of the PRPs and running-response rates for the same conditions and periods of the session were conducted. They revealed similar values for PRPs and running-response rates within a period of the session regardless of session length and showed that values for portions of sessions were comparable to total-session values. The data paths relating PRPs and running-response rates to FR value for any period of the session were similar in shape to those from sessions of that length. Thus, PRPs tended to be larger and running-response rates tended to be lower the longer the period of the session included in the analysis. The higher overall response rates for the first 10-min period of the 10-min sessions for some of the larger FR values seen in Figure 5 were reflected in higher running-response rates for those same FR values in the same period but not in shorter PRPs. The cumulative records of all sessions were examined and these showed that all hens started responding immediately when the session started regardless of session length. In some cases with the larger FR schedules and longer sessions, there was some within-ratio pausing during the first 10-min period. Pausing was not observed with these same FR values in the 10-min sessions.
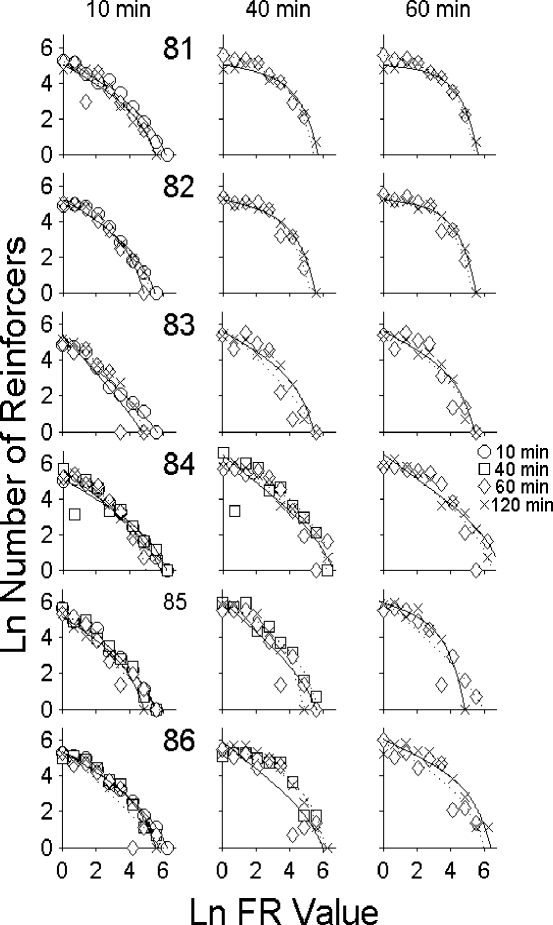
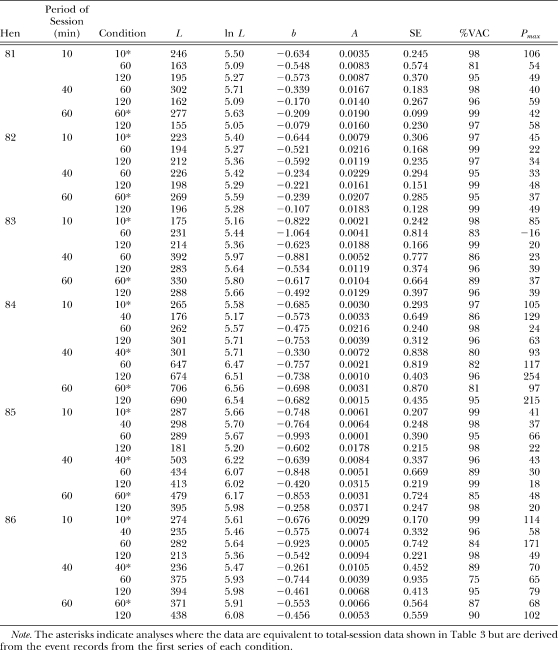
The natural logarithms of the number of reinforcers obtained over the first 10-, 40- and 60-min period of each session are plotted against the natural logarithms of FR value in Figure 6. Again, there were no consistent differences within any period, except consumption at larger FR values was typically higher for the 10-min condition as compared to the other length sessions over the same period. This reflects the higher overall response rates at larger FR values obtained in 10-min conditions. Equation 1 was fitted to these data and the parameter values and measures of fit are given in Table 4. The data were reasonably well described by the functions but the fits were not all as good as those for the mean total-session data (Table 3), with 14 of the 48 fits having %VAC less than 90% (the smallest was 75%). Eleven of the 14 lowest %VAC values were from the 60-min condition. Examination of the parameter values for each session length within any of the three periods of the session shows no consistent trends. Where the data represent the total session (indicated by the asterisks) the values are similar to those for that condition in Table 3.
Fig 6.
The natural logarithm of the average number of reinforcers obtained from the first 10 min (left column), first 40 min (center column) and first 60 min (right column) of each session in Series 1, plotted against the natural logarithm of the FR value for each hen. The different symbols indicate the total session durations. The functions shown were obtained by fitting Equation 1 to these data using curvilinear regression and the method of least squares.
Table 4.
The parameter values obtained by fitting Equation 1 to the natural logarithms of the number of reinforcers and the natural logarithms of FR value for the data from the first 10-, 40- and 60-min periods of the sessions for the first series of FR schedules for the 10-, 60-, and 120-min conditions for Hens 81 to 83 and for the 10-, 40-, 60-, and 120-min conditions for Hens 84 to 86. Also shown are the standard errors of the fits (SE), the percentages of variance in the data the functions account for (%VAC), and the Pmax values (obtained using Equation 2).
The mean values of each parameter for each period of the session and each hen are shown in Table 5. As was the case for total-session data, as the period of the session included in the analysis increased, the mean ln L value also usually increased. The average ln L for the 10-sec period was smaller than the average for the 60-sec period in all cases. The mean b values were smallest for the 10-min period and these means were smaller than the mean b values from the 60-min period for 5 hens (Hen 84 was the exception). The mean a values were also smallest for the 10-min periods. For 4 hens, a for the 40-min period was between the values for the 10- and 60-min periods. For Hen 82 the 40- and 60-min a values were the same, and for Hen 84, a decreased with increased session length. The mean Pmax values did not change consistently with the period of the session included in the analysis. The 120-min condition data are represented in Table 5 for comparison. For these data, ln L values were generally larger than those from the 60-min period, b values were larger than those from the 60-min period for all hens, a values were larger than those from the 10-min period for all hens, and a values were larger than or similar to those from the 60-min period for 5 hens.
Table 5.
DISCUSSION
The remarkable feature of the present data is the similarity between response rates and PRPs in a session of fixed length and those in the same portion of a longer session. Given the similarity of response rates over the same-length period from a range of session lengths, it is not surprising that the demand functions also are very similar. Fitting Equation 1 to the present total-session data showed the initial levels of consumption (L) increased as session length increased, initial elasticities (b) increased as session length increased (but the initial slopes remained inelastic, i.e., greater than −1), and the rates of change of elasticity (a) and the FR values corresponding to the maximum output (Pmax) did not change systematically with session length.
The results for initial intensity (L) are the same as those reported by Tsunematsu (2000), that is, L increased with session length, confirming his finding and also extending it to shorter sessions with open economies. In the present study consumption was measured by number of reinforcers obtained, while Tsunematsu used the weight of food consumed. Both measures changed similarly as session length increased. Results of the two studies were also similar in that neither found a or Pmax changed systematically with session length.
The present finding that initial elasticity, b, tended to increase with session length contrasts with that of Tsunematsu (2000), who found that b decreased with session length. Both studies obtained b values that were all greater than −1, i.e., inelastic, and in this way their results are similar. The demand functions from Tsunematsu's 2 pigeons were somewhat flat or increasing and thus inelastic at small FR values, with b from the FR conditions changing from 0.287 to −0.019 and from 0.116 to −0.246 as session length increased. One difficulty for the present comparison is that Tsunematsu, because of the focus of his study, converted all the FR values to a time-based unit price (i.e., time equivalent per reinforcement duration) prior to assessing demand. This transformation affected the data differently for each session length and bird. So, for example, FR 3 resulted in time-based unit prices of 0.5, 1.0, and 2.4 for the 1.5-, 3- and 4.5-hr sessions, respectively, for 1 bird. For this bird the time-based unit price for the 4.5-hr session differs by 1.6 natural log units from that for FR 3 in the 1.5-hr session. It is not clear what effects the price differences for this and for the other three FR values had on the shape of the resulting demand functions, but it is noteworthy that the derived time-base unit prices did not change monotonically for any one FR with session length increases and the FRs in the 3-hr session were generally associated with lower unit prices than they were in the 1.5- and 4.5-hr sessions. Such a relation was not obtained in the present analysis, thus the two studies must be compared with caution.
In the present study, the demand functions were much steeper over the small FR values for the shorter sessions than for the longer sessions (Figure 4) and for shorter segments of longer session than for longer segments (Figure 6). Table 3 shows that although the 10-min condition gave the smallest b values and these were smaller than those from the 120-min condition, the b values did not change monotonically over the longer sessions for all hens. For Hens 83 to 86 there was at least one reversal in b value as session length increased and, for 3 of these hens, the largest b values were from the 40-min condition. Comparisons of the 40- and 60-min condition b values for these 4 hens would lead to the conclusion that b decreases as session length increases, as found by Tsunematsu (2000). However, the overall trend from both the total-session and the within-session data presented here is for b to increase with session length. The present results do not rule out the possibility of bitonic functions relating b to session length had even longer sessions been included. Session length needs to be varied over an even larger range than used here to clarify this.
McSweeney and Swindell's (1999) within-session demand analysis was based on responses and reinforcers in each 5-min period of their 60-min sessions. They found that the initial level of demand decreased across successive intervals of the session. The present within-session demand analysis was based on data cumulated over different periods of the session by including a larger portion of the session in each analysis. The data in Figure 6 and Tables 4 and 5 show that, as larger portions of the session are included in the demand analysis, the initial level of demand rises but it does not do so in direct proportion to the amount of time included in the analysis. Smaller increases in L as more of the session is included would give decreases in L, similar to those found by McSweeney and Swindell, if the data from successive intervals of the sessions were used rather than the cumulated data. Thus, the present result supports McSweeney and Swindell's finding.
McSweeney and Swindell (1999) set a in Equation 1 to 0 in their demand analysis. Because their functions were almost linear over the early parts of the session it would be expected that a would have been close to 0 anyway for these functions, and so the elasticity would be reflected mostly by b. McSweeney and Swindell found b increased as the session progressed with the functions becoming more inelastic (less steep). This is similar to the present results, which indicated that as more of the session was included, b increased. These results extend the findings of McSweeney and Swindell to other session lengths and to hens. McSweeney and Swindell did not examine changes in a, but their demand functions appeared to become more curved as the session progressed, which might suggest increases in a. For the present data a was smaller for the first 10 min of the sessions than for the first 60 min of the sessions for most hens. In addition, the 10-min condition gave a values smaller than those from the 120-min condition. The changes in a with the amount of the session included in the analysis and with session length were not monotonic, however, and for 1 hen a tended to decrease as more of the session was included in the analysis. Thus, a did not change systematically across hens either within the session or over different session lengths.
The present data show that with an open economy there is a tendency for demand functions to be move curved and to be more inelastic initially for longer than for shorter sessions. This finding supports a suggestion by Foster et al. (1997), who proposed that such results might be a function of the time available for pausing within a session. In the present study the PRPs in the short sessions were shorter on average for any one FR value than were the PRPs for that FR in the longer sessions (see Figure 3). Also, running- response rates were fastest in the short sessions for any FR value (see Figure 2). These differences could be products of systematic increases in response rate and in PRP or they could be a product of a change in the distribution of pause time. Be that as it may, within-session analyses of the present data suggest that these differences are not the result of an overall effect of session length on responding but are most likely the result of changes in response patterns and pausing across the session.
In the present study the total-session data were very similar to the data from the same period of a longer session in most cases. However, the 10-min sessions resulted in higher overall response rates at the larger FR values for some hens than were seen in the first 10-min of longer sessions. Inspection of the cumulative records showed that where these differences occurred, they were the product of consistent responding with those FR values in the 10-min sessions but some (albeit short) within-ratio pausing in the first 10 min of the longer sessions. Most studies of FR performance report the PRPs and few discuss within-ratio pausing, but Ferster and Skinner (1957) reported within-ratio pausing with larger FR values. However, these data came within ongoing sessions and it is not clear what happened at the very start of these sessions. Nevertheless, they do suggest that it was the consistent responding over the full 10-min of the 10-min sessions at the larger FR values that was unusual rather than the pausing in these FR schedules in longer sessions.
All the data presented here were from sessions in which at least one reinforcer was earned. Therefore if hens responded so slowly that they did not receive a reinforcer within a 10-min session, then those data were not included in this analysis. It could be that this selection process resulted in only those 10-min sessions with fast, steady responding being included here. Table 2 shows that the highest FR values reached in the 10-min condition were similar to those reached the other conditions, so it was not the case that the hens could not obtain a reinforcer within this period with FR values of 256 and 512. However, often only one reinforcer was obtained at these values in the 10-min sessions and the cumulative records showed that this was often obtained towards the end of the 10 min. In the longer sessions reinforcers could still be obtained after the 10-min period and some within-ratio pausing would not exclude this. On the other hand, any pausing within the 10-min sessions with the larger FR values would reduce the chances of obtaining a reinforcer at all in that session. It may be this provided a contingency that reduced within-ratio pausing in the 10-min sessions, keeping running-response rates high. If so, this would be a separate effect of session length and could account for why there are some differences between the 10-min condition and the first 10-min of the longer sessions.
Experimental sessions are typically longer in studies involving open economies than in studies involving closed economies, and Foster et al. (1997) and Tsunematsu (2000) both suggested the possibility that differences in session length may contribute to the differences in response rates and patterns that have been seen both within and across experiments involving the two types of economies. The present study provided data relevant to this suggestion. These data suggest that session length does affect responding as reflected in demand functions. They also suggest, however, that demand functions during comparable-length periods taken from sessions of different overall lengths are similar. Therefore, when session lengths differ, it is most appropriate to base conclusions about the effects of open versus closed economies on a period of responding equal in length to the total-session time of the shortest condition of interest. If, for example, sessions under the open-economy condition ended after 30 min and those under the closed-economy condition ended after 2 hr, we suggest that demand functions based on total-session data for the open economy should be compared to data for the first 30 min of responding for the closed economy. Such a comparison would require comparable response requirements to be arranged, but this would not be problematic. To our knowledge, no one has taken this tack, but it appears to be a useful adjunct to, and perhaps even a better alternative than, total-session comparisons.
Acknowledgments
We thank Jennifer Chandler for her technical assistance in conducting this research, and the research students at the Learning, Behaviour and Welfare Research Unit, who helped run the experimental conditions.
REFERENCES
- Dougan J.D, Kuh J.A, Vink K.L. Session duration and the VI response function: Within-session prospective and retrospective effects. Journal of the Experimental Analysis of Behavior. 1993;60:543–557. doi: 10.1901/jeab.1993.60-543. [DOI] [PMC free article] [PubMed] [Google Scholar]
- Ferster C.B, Skinner B.F. Schedules of reinforcement. New York: Appleton-Century-Crofts; 1957. [Google Scholar]
- Foltin R.W. Economic analysis of caloric alternatives and reinforcer magnitude on “demand” for food in baboons. Appetite. 1992;19:255–271. doi: 10.1016/0195-6663(92)90166-4. [DOI] [PubMed] [Google Scholar]
- Foltin R.W. Does package size matter? A unit price analysis of “demand” for food in baboons. Journal of the Experimental Analysis of Behavior. 1994;62:293–306. doi: 10.1901/jeab.1994.62-293. [DOI] [PMC free article] [PubMed] [Google Scholar]
- Foster T.M, Blackman K.A, Temple W. Open versus closed economies: performance of domestic hens under fixed-ratio schedules. Journal of the Experimental Analysis of Behavior. 1997;67:67–89. doi: 10.1901/jeab.1997.67-67. [DOI] [PMC free article] [PubMed] [Google Scholar]
- Foster T.M, Sumpter C.E, Temple W, Flevill A, Poling A. Demand equations for qualitatively different foods under fixed-ratio schedules: A comparison of three data conversions. Journal of the Experimental Analysis of Behavior. 2009;92:305–326. doi: 10.1901/jeab.2009.92-305. [DOI] [PMC free article] [PubMed] [Google Scholar]
- Holm L, Ritz C, Ladewig J. Measuring animal preferences: shape of double demand curves and the effect of procedure used for varying workloads on their cross-point. Applied Animal Behaviour Science. 2007;107:133–146. [Google Scholar]
- Hursh S.R. Economic concepts for the analysis of behavior. Journal of the Experimental Analysis of Behavior. 1980;34:219–238. doi: 10.1901/jeab.1980.34-219. [DOI] [PMC free article] [PubMed] [Google Scholar]
- Hursh S.R. Behavioral economics. Journal of the Experimental Analysis of Behavior. 1984;42:435–352. doi: 10.1901/jeab.1984.42-435. [DOI] [PMC free article] [PubMed] [Google Scholar]
- Hursh S.R, Raslear T.G, Shurtleff D, Bauman R, Simmons L. A cost-benefit analysis of demand for food. Journal of the Experimental Analysis of Behavior. 1988;50:419–440. doi: 10.1901/jeab.1988.50-419. [DOI] [PMC free article] [PubMed] [Google Scholar]
- Hursh S.R, Silberberg A. Economic demand and essential value. Psychological Review. 2008;115:186–198. doi: 10.1037/0033-295X.115.1.186. [DOI] [PubMed] [Google Scholar]
- Ko M.C, Terner J, Hursh S, Woods J.H, Winger G. Relative reinforcing effects of three opioids with different durations of action. Journal of Pharmacology and Experimental Therapeutics. 2002;301:698–704. doi: 10.1124/jpet.301.2.698. [DOI] [PubMed] [Google Scholar]
- McSweeney F.K. Rate of reinforcement and session duration as determinants of within-session patterns of responding. Animal Learning and Behavior. 1992;20:160–169. [Google Scholar]
- McSweeney F.K. Dynamic changes in reinforcer effectiveness: satiation and habituation have different implications for theory and practice. The Behavior Analyst. 2004;27:171–188. doi: 10.1007/BF03393178. [DOI] [PMC free article] [PubMed] [Google Scholar]
- McSweeney F.K, Roll J.M, Cannon C.B. The generality of within-session patterns of responding: Rate of reinforcement and session length. Animal Learning & Behavior. 1994;22:252–266. [Google Scholar]
- McSweeney F.K, Swindell S. Behavioral economics and within-session changes in responding. Journal of the Experimental Analysis of Behavior. 1999;72:355–371. doi: 10.1901/jeab.1999.72-355. [DOI] [PMC free article] [PubMed] [Google Scholar]
- Posadas-Sanchez D, Killeen P.R. Does satiation close the open economy. Learning & Behavior. 2005;33:387–398. doi: 10.3758/bf03193178. [DOI] [PMC free article] [PubMed] [Google Scholar]
- Roll J.M, McSweeney F.K. Within-session changes in operant responding when gerbils (meriones unguiculatus) serve as subjects. Current Psychology. 1997;15:340–345. [Google Scholar]
- Tsunematsu S. Effort- and time-cost effects on demand curves for food by pigeons under short session closed economies. Behavioural Processes. 2000;53:47–56. doi: 10.1016/s0376-6357(00)00147-9. [DOI] [PubMed] [Google Scholar]


