Abstract
Chloroquine (CQ) is a safe and economical 4-aminoquinoline (AQ) antimalarial. However, its value has been severely compromised by the increasing prevalence of CQ resistance. This study examined 108 AQs, including 68 newly synthesized compounds. Of these 108 AQs, 32 (30%) were active only against CQ-susceptible Plasmodium falciparum strains and 59 (55%) were active against both CQ-susceptible and CQ-resistant P. falciparum strains (50% inhibitory concentrations [IC50s], ≤25 nM). All AQs active against both CQ-susceptible and CQ-resistant P. falciparum strains shared four structural features: (i) an AQ ring without alkyl substitution, (ii) a halogen at position 7 (Cl, Br, or I but not F), (iii) a protonatable nitrogen at position 1, and (iv) a second protonatable nitrogen at the end of the side chain distal from the point of attachment to the AQ ring via the nitrogen at position 4. For activity against CQ-resistant parasites, side chain lengths of ≤3 or ≥10 carbons were necessary but not sufficient; they were identified as essential factors by visual comparison of 2-dimensional (2-D) structures in relation to the antiparasite activities of the AQs and were confirmed by computer-based 3-D comparisons and differential contour plots of activity against P. falciparum. The advantage of the method reported here (refinement of quantitative structure-activity relationship [QSAR] descriptors by random assignment of compounds to multiple training and test sets) is that it retains QSAR descriptors according to their abilities to predict the activities of unknown test compounds rather than according to how well they fit the activities of the compounds in the training sets.
INTRODUCTION
The annual burden of malaria is overwhelming, with more than 300 to 500 million cases and 2 million deaths each year (3). In addition, its impact is exacerbated by the increasing prevalence of antimalarial resistance, which was the single most important factor in its recent worldwide resurgence (22, 41). The most important resistance is that of Plasmodium falciparum to 7-chloro-4-(4-diethylamino-1-methylbutylamino)-quinoline (chloroquine [CQ]), because P. falciparum is responsible for most morbidity and mortality, and especially for the deaths of children under the age of 5 years in sub-Saharan Africa (3). For these reasons, and because resistance to the artemisinins and to the combination of atovaquone and proguanil (Malarone) is now emerging (14, 20, 33), the development of antimalarials that are effective against drug-resistant parasites—and that are affordable for the people in the greatest need—is an urgent global health priority.
The established safety record of CQ, its ease of synthesis, and its low cost led us to examine the structure-activity relationships (SARs) responsible for the antiparasite activity of the 4-aminoquinolines (AQs) (10, 11, 26) with the goal of identifying the factors responsible for their activity against CQ-resistant parasites. The design and synthesis of AQ analogues during the past 5 to 10 years, in combination with biological testing against CQ-susceptible and -resistant P. falciparum strains, have also yielded molecular insights into the mechanisms of AQ action and resistance (27–30).
In this report, we present structure-activity analyses for 108 AQ analogues—including 68 newly synthesized compounds—to clarify the relationship between the chemical structures of the AQs and their antiparasite activities.
A main purpose of quantitative structure-activity relationship (QSAR) analyses is to make activity predictions for unknown compounds in order to guide the structure-based design of new analogues. Because we plan to extend the search for more-potent AQ analogues by using an iterative molecular design approach, useful quantitative models must have the ability to be readily extended to incorporate additional compounds. Therefore, we used computer-generated 3-dimensional (3-D) structures and chemical descriptors. This article examines 108 AQs using comparative molecular field analysis (CoMFA) (8) and comparative similarity index analysis (CoMSIA) (25), as well as the 2-D hologram QSAR (HQSAR) (32, 36) and UNITY molecular fingerprint (UFP) (6) paradigms. To eliminate bias from the selection of a single test set for the examination of the predictive ability of QSAR models, we randomly assigned 20 molecules to 20 different test sets and used the 88 excluded compounds as the associated training set in each case.
Partial least-squares (PLS) analysis reduces the complexity of a QSAR model by sorting the large number of descriptors into a small number of orthogonal principal components to facilitate least-squares fitting. However, these components still contain large numbers of descriptors. Inevitably, many of these descriptors are affected by the inherent noise of the method and the uncertainty of the biological data. Several methods to eliminate these uninformative descriptors have been described previously (43). These methods include the stability (mean/standard deviation [SD]) of PLS weights (2) or PLS coefficients (5) and retain only the most stable descriptors in the final QSAR models. In this study, descriptor normalization was used to prevent descriptors with large magnitudes or variances from swamping other descriptors. Ranking of the PLS contributions for each of the normalized descriptors identified those that best predicted the antiparasite activities (50% inhibitory concentrations [IC50s]) of the unknown test AQs. In this way, the model was chosen by its ability to predict rather than to fit the data.
MATERIALS AND METHODS
Synthesis of AQ analogues.
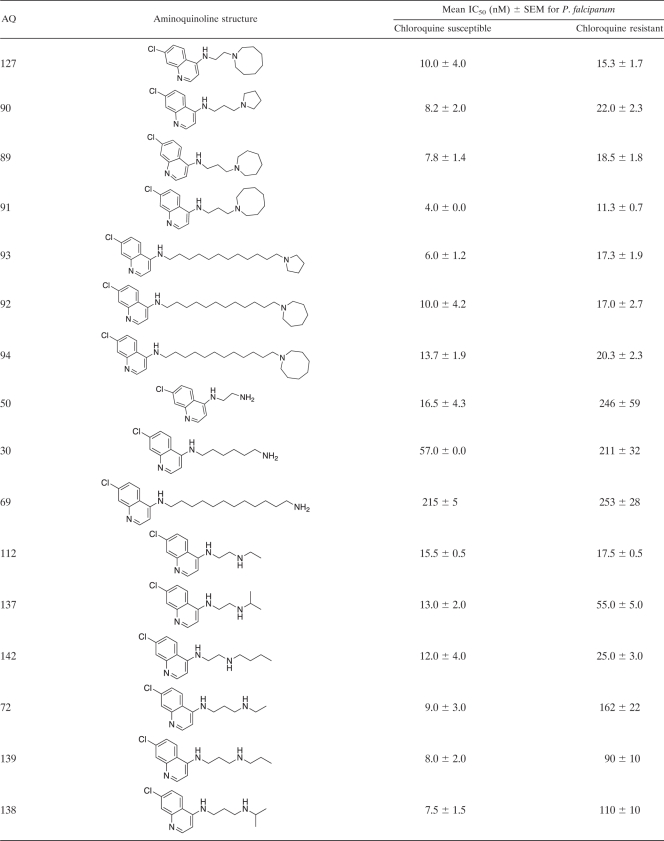
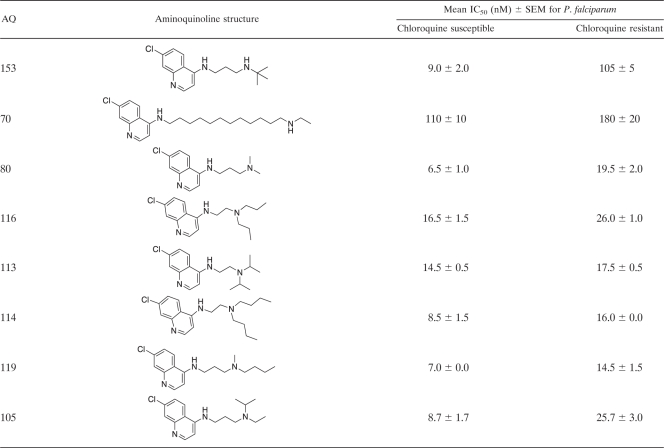
AQ analogues were synthesized as described previously (9–12). Briefly, as an example, 7-chloro-AQs were synthesized by the condensation of m-chloroaniline with ethyl ethoxymethylene malonate to produce 4,7-dichloroquinoline. Nucleophilic substitution with different N,N-diethyldiaminoalkanes produced the desired analogues with side chains containing 2 to 12 carbons (9–12). Each AQ analogue was purified by column chromatography with an activated basic alumina or silica gel and was characterized by 1H nuclear magnetic resonance (NMR) spectroscopy (19F NMR when applicable), mass spectroscopy, and C, H, and N elemental analyses, which agreed with the theoretical values (±0.4%). The purity of each compound was ≥95% with two high-performance liquid chromatography (HPLC) systems. The first consisted of a C18 column (length, 250 mm; inner diameter, 4.6 mm; particle size, 5 μm) using isocratic elution with an acetonitrile-borate buffer (56:44) (pH 9.2) at 1 ml min−1 and fluorescence detection based on excitation at 320 nm and emission at 380 nm. The second HPLC system consisted of a C18 column with buffer A (0.1% trifluoroacetic acid [TFA]) and buffer B (0.1% TFA in 80% acetonitrile) using gradient elution from 10% buffer B to 70% buffer B at 1 ml min−1 with UV detection at 215 nm. The structures and biological activities of the analogues used for QSAR are summarized in Table 1, and those of the AQ analogues that have not been reported previously are shown in detail in Table 2. Data for the 40 AQ analogues that have been reported previously are available in references 10, 11, and 31. Synthetic and analytical data for the remaining compounds will be published elsewhere.
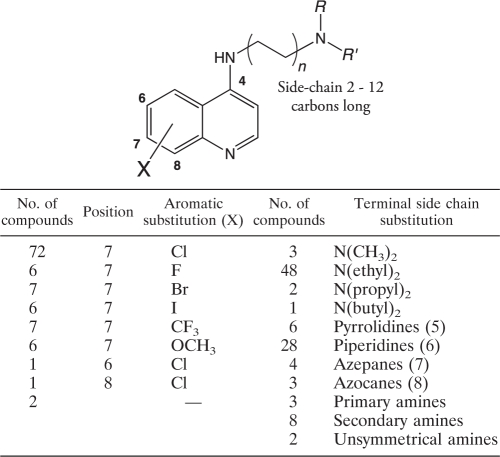
Table 1.
Summary of the chemical structures and biological activities of 108 4-aminoquinoline analogues examined in quantitative structure-activity relationship analyses
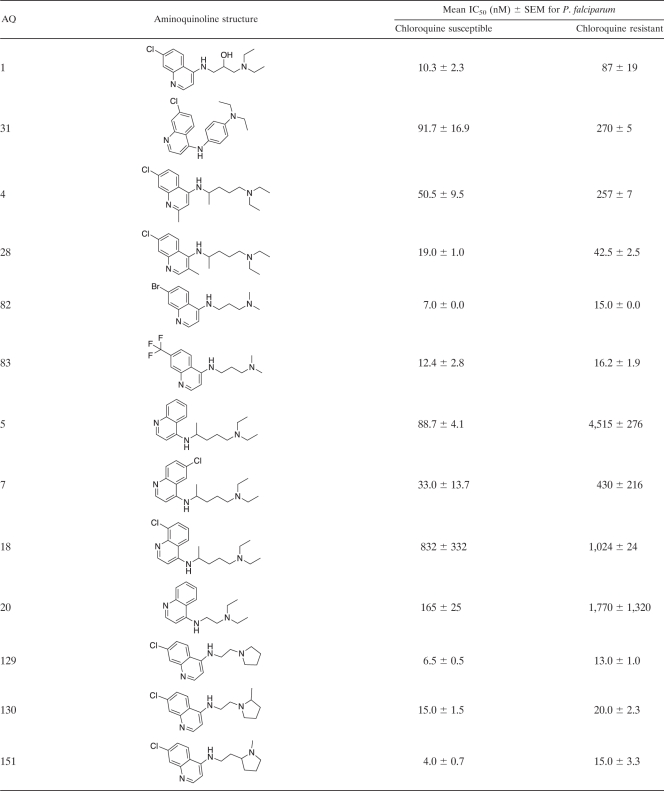
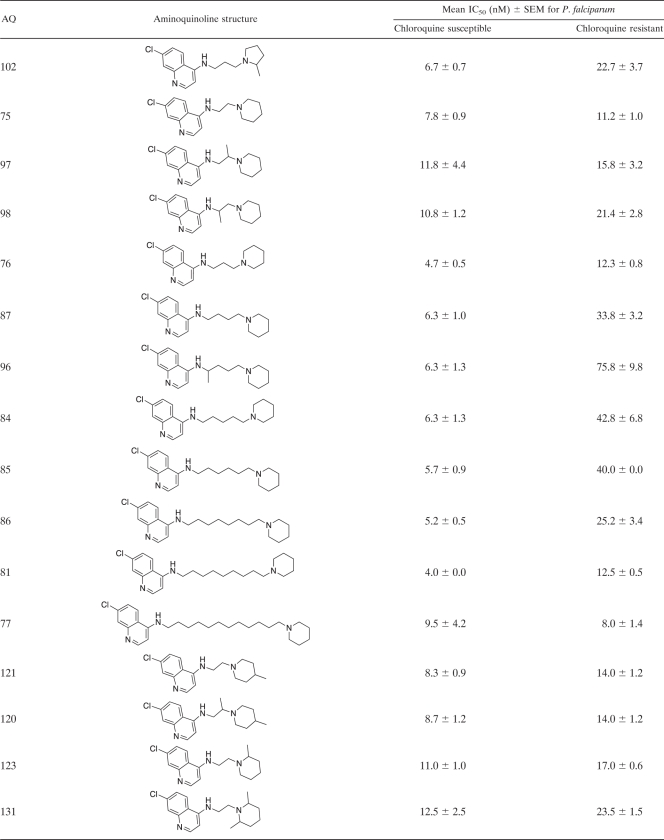
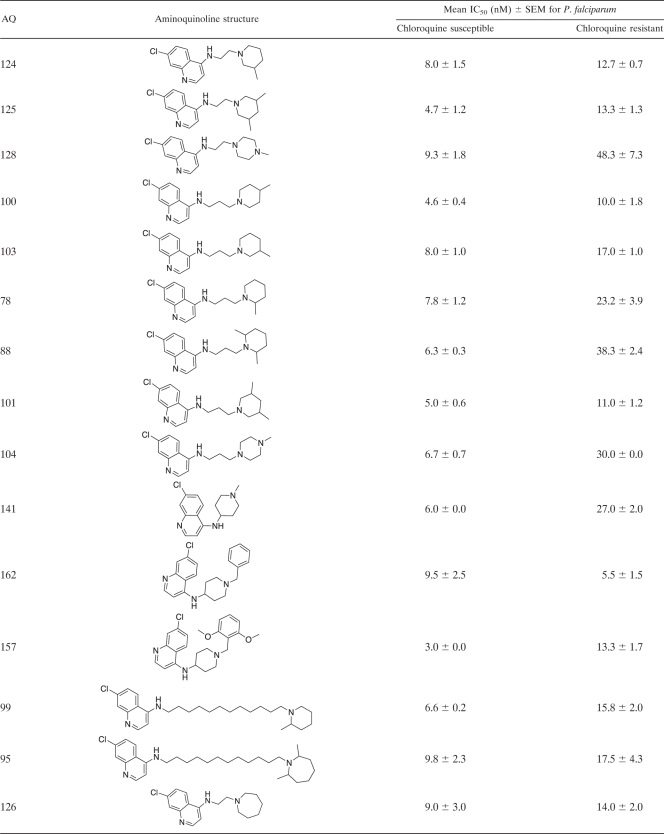
Table 2.
Structures of 4-aminoquinoline analogues and their antiplasmodial activities against chloroquine-susceptible and -resistant Plasmodium falciparum strainsa
Antiplasmodial activities are expressed as IC50s. The CQ-susceptible strain used for these determinations was Haiti 135, and the CQ-resistant strain used was Indochina I. The data presented in this table are for the 68 4-aminoquinoline (4-AQ) analogues that have not been reported previously. Data for the 40 AQ analogues reported previously are available in references 10, 11, and 32.
QSAR data set.
Computational QSAR studies examined 108 AQ analogues based on CQ. These AQs consisted of 72 7-Cl, 6 7-F, 7 7-Br, 6 7-I, 7 7-CF3, 6 7-OCH3, 1 6-Cl, 1 8-Cl, and 2 unsubstituted AQs. Side chains ranged from 2 to 12 carbons, and terminal side chain amine functions included 3 (CH3)2N, 48 (ethyl)2N, 2 (propyl)2N, 1 (butyl)2N, 6 pyrrolidines, 28 piperidines, 4 azepanes, 3 azocanes, 3 primary amines, 8 secondary amines, and 2 unsymmetrical linear secondary amines. The in vitro inhibitory activities of these AQs against CQ-susceptible and CQ-resistant P. falciparum strains (Haiti 135 and Indochina I, respectively) were interpreted based on their IC50s (AQs with IC50s of ≤25 nM were considered active) (Table 2), which were converted to pIC50 values (log 1/IC50) and used as dependent variables in deriving 3-D QSAR models.
Malaria parasite strains.
The Plasmodium falciparum strains employed in these studies were a cloned CQ-susceptible parasite from Haiti (Haiti 135) (26, 39) and a cloned CQ-resistant parasite from Indochina (Indochina I) (7).
Antiplasmodial potency.
The in vitro antiplasmodial activities of AQ analogues, expressed as their effects on the growth of cloned susceptible and resistant strains of P. falciparum (IC50s, given as nanomolar concentrations), were assessed by their abilities to inhibit [3H]hypoxanthine incorporation via the essential parasite purine salvage pathway (19, 29) as described previously (13). Briefly, synchronous cultures of early-ring-stage parasites (600 μl of a 2% red blood cell suspension with 0.2% parasitemia in 24-well tissue culture plates [Corning Cell Wells, catalog no. 25820; Corning, Corning, NY]) were grown in the in vitro culture system (40). Varying concentrations of the AQ analogues were added, and the parasites were grown for 48 h without supplemental hypoxanthine. [3H]hypoxanthine (0.5 μCi; Perkin-Elmer, Boston, MA) was then added, followed by an additional 16 to 18 h of incubation. Cell contents were harvested on 12-mm-diameter glass fiber filter disks (934 AH; Whatman, Clifton, NJ) using a Skatron (Sterling, VA) cell harvester, dried, placed in glass vials (Kimble, Toledo, OH) with 8 ml of liquid scintillation fluid (Cytoscint; ICN Radiochemicals, Costa Mesa, CA), and assayed in a liquid scintillation counter (Tri Carb 2100 TR; Packard, Meriden, CT). After initial screening to identify the relevant range of the dose-response curve, IC50s were determined for each AQ (results are presented as mean IC50s ± standard errors of the means [SEMs] [Table 2]).
Molecular modeling.
Molecular modeling studies were performed on an HP dual Xeon 3.2-GHz workstation operating Red Hat Enterprise Linux 4 using SYBYL, version 8.0 (Tripos, L.P., St. Louis, MO) and an Apple Macintosh (iMac Core 2 Duo 3.06-GHz OS X 10.5.6) using SYBYL, version 8.1. The conversational SMILES (Simplified Molecular Identification and Line Entry System) (1, 42) string for each AQ analogue was the input for the CONCORD (CONnectivity to CoORDinates) program (34, 35), and the default settings were used to provide the 3-D coordinates for each molecule. Partial atomic charges were calculated using the Gasteiger-Hückel method (16–18). The 3-D coordinates of each AQ analogue were imported into the SYBYL molecular modeling suite (24, 38) to create molecular databases containing the 108 AQ analogues. All molecules were modeled in the neutral form, since protonation of this highly congeneric series conferred no advantages.
QSAR analyses. (i) Molecular alignment.
Aminoquinolines are believed to act by binding to the growing faces of hematin crystals and thus preventing the further deposition of hematin. The subsequent accumulation of toxic free heme then kills the parasite. The quinoline moiety is thought to intercalate into the grooves on the growing face, with the side chains lying on the face of the hematin crystal (4). The basic side chain of the AQs is necessary to drive their accumulation in the acidic vacuole of the parasite. The molecular database was aligned separately by a root mean square (rms) fit to the common heavy atoms of the quinoline rings of CQ. SYBYL QSAR tables were then built from the molecular databases, with the compounds as rows and the target antiplasmodial biological data (IC50s for CQ-susceptible and -resistant P. falciparum) and molecular descriptors as columns. The SYBYL QSAR module was used to define a 2-Å-spaced CoMFA region extending 4 Å beyond the aligned analogues, and this region grid was used for all 3-D QSAR analyses. The 108 AQ analogues were divided randomly (MATLAB random number seed, 98,517) into 20 independent training sets containing 88 compounds in order to derive the QSAR models and into 20 associated test sets containing the 20 excluded compounds in order to test the predictive power of the final QSAR models.
(ii) 3-D QSAR descriptors.
The predefined 3-D lattice region definition with 2-Å spacing was used for all CoMFA and CoMSIA descriptors in SYBYL (Tripos). CoMFA steric and electrostatic field energies were calculated at all intersections of the region grid using an sp3 hybridized carbon probe atom with a charge of +1 and a distance-dependent dielectric constant with the Tripos Force Field. The steric and electrostatic contributions were truncated to ±30 kcal mol−1, and the electrostatic contributions were ignored at lattice intersections with maximal steric interactions. CoMSIA steric, electrostatic, hydrophobic, hydrogen bond donor, and hydrogen bond acceptor molecular similarity descriptors used the following default settings: probe atom radius, 1 Å; charge, +1; hydrophobicity, +1; attenuation factor, 0.3.
(iii) 2-D QSAR descriptors.
UNITY molecular fingerprints (UFPs) with a bit length of 992 were generated using the default settings in UNITY (Tripos). QSAR holograms with bin lengths of 97, 151, 199, 257, 307, 353, 3,500, and 10,000 and fragment lengths of 4 to 7 atoms, with nonhydrogen fragment atoms, bonds, and connections used to determine uniqueness, were generated using the HQSAR module of SYBYL (24, 38). Each HQSAR analysis of biological data for CQ-susceptible and CQ-resistant parasites produced the same estimate for the optimum hologram bin length (10,000), which was used for all subsequent analyses. Basicities (pKas) for each of the nitrogen log P and log D values (at pH 5.5, 6.0, 6.5, 7.0, and 7.4) were calculated using the ACD/Labs Structure Design Suite (Advanced Chemistry Development, Toronto, Ontario, Canada).
QSAR descriptors were imported into MATLAB R2008a (MathWorks, Natick, MA), and QSAR algorithms were programmed in MATLAB with the Statistics Toolbox, version 7.0. Each principal component was required to increase the observed q2 by ≥5% above the model with one less component in order to ensure that the models were not overfitting the noise in the data. This method provides a more conservative estimate than the number of components that correspond to the minima in the standard error.
(iv) Iterative QSAR descriptor optimization.
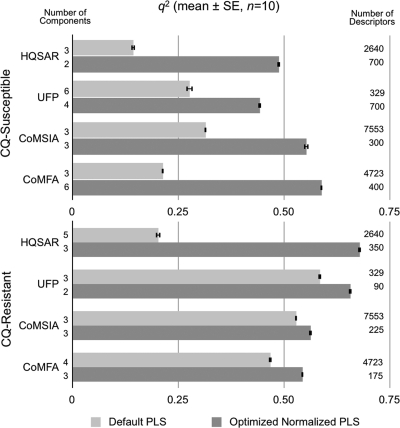
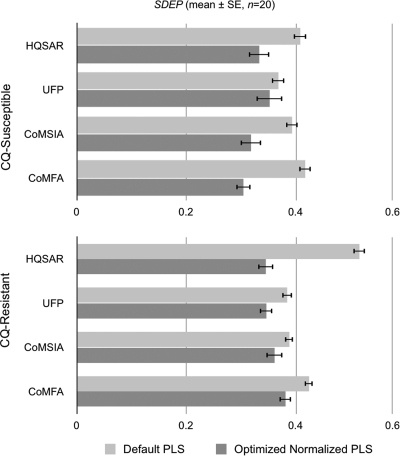
Because the 2-D and 3-D descriptors had markedly different magnitudes and variances, descriptors were normalized by centering (mean = 0) and scaling (SD = 1) using the z-score algorithm in MATLAB to prevent descriptors with large magnitudes or variances from swamping the other descriptors. The descriptors were ranked by the mean PLS contributions from the non-cross-validated analyses (n = 10), and the ranked descriptors were then added stepwise to the cross-validated QSAR models while monitoring the predictive q2 (q2prediction), q2, and related standard errors of prediction (SDEP) from the non-cross-validated QSAR analyses. This approach allowed the most significant (most predictive) descriptors to be retained while eliminating those that contributed least to the final QSARs. The q2 values (mean ± SEMs) (n = 10), numbers of components, and initial (SD ≠ 0) and final numbers of optimized descriptors from the PLS analyses are shown in Fig. 1, and the SDEP are shown in Fig. 2, for CQ-susceptible and CQ-resistant parasites.
Fig. 1.
Effects of descriptor optimization on q2 for training compounds, numbers of components, and descriptors from cross-validated, partial least squares (PLS) analyses against P. falciparum.
Fig. 2.
Effects of descriptor optimization on standard errors of prediction (SDEP) for unknown test compounds from PLS analyses against P. falciparum.
(v) QSAR model validation.
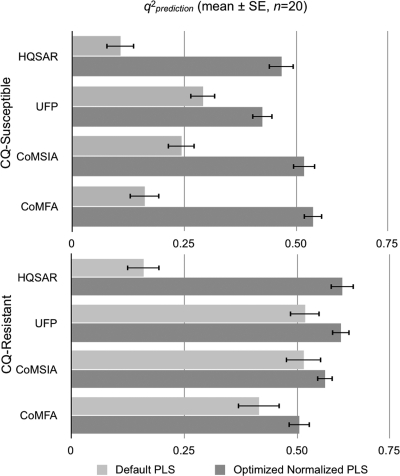
The extrapolated predictive ability of each QSAR model was examined using the 20 randomized test sets of 20 compounds that had not been included in the training sets. The activities of these compounds were predicted from each final PLS analysis, and the SDEP and q2prediction values were then calculated for each QSAR model. The q2, SDEP, and q2prediction (mean ± SEM) (n = 20) values of the test compounds for CQ-susceptible and CQ-resistant parasites are shown in Fig. 1 to 3, respectively, and are summarized in Table 3.
Fig. 3.
Effects of descriptor optimization on the predictive q2 (q2prediction) for unknown test compounds from PLS analyses against P. falciparum.
Table 3.
Summary of QSAR statistics with optimized descriptors
| QSAR statistica | Value for: |
|||||||
|---|---|---|---|---|---|---|---|---|
| CQ-susceptible P. falciparum |
CQ-resistant P. falciparum |
|||||||
| HQSAR | UFP | CoMFA | CoMSIA | HQSAR | UFP | CoMFA | CoMSIA | |
| q2 | 0.49 ± 0.004 | 0.45 ± 0.004 | 0.59 ± 0.003 | 0.55 ± 0.006 | 0.68 ± 0.004 | 0.64 ± 0.004 | 0.54 ± 0.003 | 0.56 ± 0.004 |
| SEP | 0.32 ± 0.002 | 0.33 ± 0.003 | 0.27 ± 0.001 | 0.29 ± 0.003 | 0.35 ± 0.002 | 0.37 ± 0.001 | 0.42 ± 0.001 | 0.41 ± 0.001 |
| PC | 3 | 4 | 6 | 3 | 2 | 3 | 3 | 3 |
| No. of descriptors | 2,640 | 329 | 4,723 | 7,553 | 2,640 | 329 | 4,723 | 7,553 |
| Optimized no. of descriptors | 700 | 70 | 400 | 300 | 350 | 90 | 175 | 225 |
| r2 | 0.75 ± 0.003 | 0.72 ± 0.004 | 0.84 ± 0.002 | 0.76 ± 0.003 | 0.76 ± 0.003 | 0.76 ± 0.003 | 0.64 ± 0.003 | 0.63 ± 0.004 |
| SE | 0.50 ± 0.003 | 0.55 ± 0.004 | 0.44 ± 0.002 | 0.49 ± 0.002 | 0.67 ± 0.004 | 0.68 ± 0.002 | 0.84 ± 0.004 | 0.85 ± 0.003 |
| F | 267.3 ± 4.7 | 229.8 ± 4.8 | 477.2 ± 8.4 | 281.3 ± 5.0 | 273.5 ± 3.3 | 280.6 ± 3.8 | 153.6 ± 2.1 | 149.5 ± 2.3 |
| SDEP | 0.33 ± 0.019 | 0.35 ± 0.024 | 0.30 ± 0.013 | 0.32 ± 0.019 | 0.35 ± 0.002 | 0.37 ± 0.013 | 0.38 ± 0.011 | 0.36 ± 0.015 |
| q2prediction (n = 20) | 0.47 ± 0.032 | 0.42 ± 0.030 | 0.54 ± 0.034 | 0.52 ± 0.031 | 0.60 ± 0.040 | 0.55 ± 0.037 | 0.50 ± 0.050 | 0.56 ± 0.040 |
| Contribution (%) | ||||||||
| Steric | 61.3 ± 0.44 | 24.4 ± 0.15 | 63.5 ± 0.27 | 14.2 ± 0.08 | ||||
| Electrostatic | 38.7 ± 0.25 | 13.6 ± 0.09 | 36.5 ± 0.12 | 12.8 ± 0.04 | ||||
| Hydrophobic | 37.0 ± 0.21 | 37.0 ± 0.13 | ||||||
| HB acceptor | 6.3 ± 0.04 | 9.0 ± 0.02 | ||||||
| HB donor | 18.8 ± 0.05 | 27.0 ± 0.08 | ||||||
SEP, standard error of prediction; PC, number of principal components; HB, hydrogen bond.
RESULTS AND DISCUSSION
At a time when there is an unprecedented global effort to control and potentially eliminate malaria (21), antimalarial resistance remains the single most important obstacle to success. This is because there are few safe and affordable antimalarials that are effective against resistant parasites. It is also because the antimalarials that are currently key for treatment success (the artemisinins and the atovaquone-proguanil [Malarone] combination) (14, 20, 33) are now threatened by resistance, and previously promising antimalarials in development are threatened by toxicity and resistance (dapsone plus chlorproguanil [LapDap], dapsone plus artesunate [Dacart], and piperaquine) (23, 37).
As a result, increasing the number of AQs active against CQ-resistant P. falciparum, and thus expanding the depleted upstream pipeline for antimalarial development, is an overwhelmingly important step in the path to the control and elimination of malaria. This strategic argument has recently been strengthened by our phase 1 (safety and pharmacokinetic) studies of the lead compound (AQ-13) with human subjects. Those studies have shown that AQ-13 is economical (cost of goods, $0.03 per dose), is as safe as CQ (one of the safest drugs known) for human subjects, produces levels in blood and bioavailability similar to those of CQ, and has no identifiable cardiac, neurologic, or other toxicities at oral doses equivalent to 600, 1,200, 1,500, or 1,800 mg CQ base (31).
SARs against P. falciparum.
Based on the data reported here (Table 2) and in our previous studies (10, 11, 31), common features of AQs active against both CQ-susceptible and CQ-resistant P. falciparum are (i) an AQ ring without alkyl substitutions, (ii) a halogen at position 7 of the AQ ring (Cl, Br, or I but not F), (iii) a protonatable nitrogen at position 1 of the AQ ring, and (iv) a second protonatable nitrogen at the other end of the side chain from the point of attachment to the AQ ring via the 4-anilino-nitrogen. In contrast to these relatively stringent requirements for the AQ ring, there was considerable latitude in the side chains and terminal amines that permitted antiparasite activity. The results reported here demonstrate that AQs with side chains from 2 to 12 carbons and diverse terminal amines (e.g., diethylamine, piperidine, azepane, azocane) are active against CQ-susceptible P. falciparum at low nanomolar concentrations (Table 2) (10, 11, 31).
Because the 59 AQs active against CQ-resistant P. falciparum were also active against CQ-susceptible P. falciparum, they share the four structural features noted above. In addition, these 59 AQs have side chains either shorter or longer (≤3 or ≥ 10 carbons) than the intermediate-length isopentyl (5-carbon) side chain of CQ. During the past 5 to 10 years, these studies have had two goals: (i) to develop AQs with the potential to treat CQ-resistant P. falciparum infections in humans and (ii) to use 3-D QSAR modeling to identify the structural features essential for activity against CQ-resistant parasites. By comparing AQs active only against CQ-susceptible P. falciparum strains to AQs active against both CQ-susceptible and CQ-resistant P. falciparum strains, it should be possible to identify the structural features responsible for activity against resistant parasites—i.e., the structural features that prevent recognition and excretion (efflux) by the transporter responsible for CQ resistance in P. falciparum (PfCRT) (10, 11, 15). Based on compounds with similar AQ rings (with Cl, Br, or I at position 7) and terminal amines (N-diethylamine or piperidine), these results indicate that side chains of ≤3 or ≥10 carbons are necessary for activity against CQ-resistant P. falciparum. For instance, all 20 of the AQs active against CQ-susceptible P. falciparum that had side chains with ≤3 or ≥10 carbons were also active against CQ-resistant P. falciparum (IC50s, ≤25 nM). Conversely, none of the 12 AQs active against CQ-susceptible P. falciparum that had 4- to 8-carbon side chains were active against CQ-resistant P. falciparum (P, <0.001 by Fisher's exact test). However, side chains of ≤3 or ≥10 carbons were not sufficient for activity against CQ-resistant P. falciparum. Examples of AQs with side chains of ≤3 or ≥10 carbons that were not active against CQ-resistant P. falciparum included AQs with terminal amines such as p-Me-piperazine (AQ-128), di-o-Me-piperidine (AQ-88), p-Me-piperidine (AQ-104), N-isopropylamine (AQ-137, AQ-138), N-monoethylamine (AQ-72), N-mono-propylamine (AQ-139), N-isobutylamine (AQ-153), and NH2 (AQ-50).
Optimization of QSAR models.
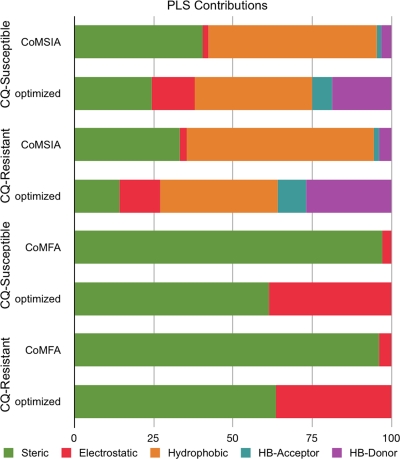
Descriptors ranked by mean PLS contributions were added stepwise until q2prediction reached a maximum. The q2, number of components, number of default PLS descriptors, number of optimized PLS descriptors, SDEP, and predictive q2 data are shown in Fig. 1 to 3 for CQ-susceptible and -resistant parasites. The final contributions to each QSAR model are shown in Fig. 4 for both CQ-susceptible and CQ-resistant P. falciparum strains.
Fig. 4.
Effects of descriptor optimization on PLS contributions from QSAR analyses of activities against P. falciparum. HB, hydrogen bond.
Optimization of the descriptors had a profound effect (2- to 3-fold) on the q2 values for the CQ-susceptible parasites and a much smaller effect for the CQ-resistant parasites (Fig. 1). Of all the AQs tested, only compound 18 was profoundly inactive against the CQ-susceptible parasite, giving a narrower range of IC50 data than that for the CQ-resistant parasite (Table 2). For both data sets, the 2-D fingerprint and 3-D descriptors yielded similar predictive q2 values and standard errors of prediction (Fig. 1 to 3). However, application of the same optimizations to the default descriptors without normalization produced little improvement in the QSAR statistics (data not shown). A potential antimalarial drug must diffuse to, and accumulate in, the acidic food vacuole of P. falciparum to be active—crossing several cell membrane-aqueous interfaces. Accumulation in the acidic vacuole is driven by a gradient of ≈2 pH units. Once the putative drug is inside the parasite food vacuole, protonation prevents it from diffusing out, thus allowing pharmacologically active concentrations of drug to accumulate. Since this transport requires both aqueous and lipid solubility, migration, and protonation, we augmented the QSAR descriptors with calculated pKa, log P, and log D values. However, the addition of these descriptors did not enhance the predictive ability of these models.
Final QSAR model.
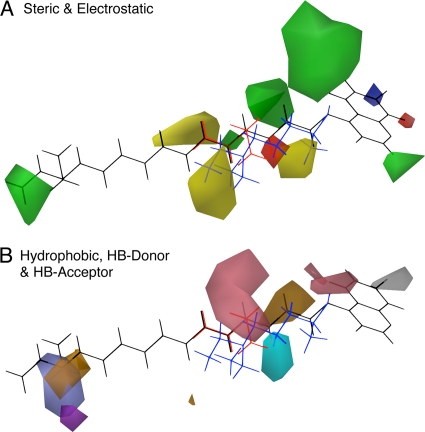
The HQSAR, UFP, CoMFA, and CoMSIA methods and descriptors each produced QSAR models with useful predictabilities (Fig. 1 to 3). Inspection of the contributions to the final QSAR models showed that descriptor refinement by iterative optimization increased the importance of QSAR contributions from the minor descriptors in the SYBYL default PLS analyses (Fig. 4) while simultaneously increasing the predictability of the models (Fig. 3). HQSAR and UFP have a computational speed advantage over 3-D QSAR because they do not require either molecular models or alignments. However, the 3-D QSAR models provided more-intuitive visual data for interpreting the QSAR. The CoMSIA method, with its hydrophobicity and hydrogen bond donor and acceptor fields, provided a visually richer model than the CoMFA method, which employs only steric and electrostatic fields, although both produced highly predictive models for CQ-susceptible and -resistant parasites. To highlight the aspects of the QSAR model that favor activity against CQ-resistant versus CQ-susceptible parasites, we generated a differential CoMSIA model by subtracting the PLS coefficients of the susceptible model from those of the resistant model. Figure 5 shows the iterative descriptor-optimized differential CoMSIA QSAR coefficient (coefficient × SD) contours together for 2 AQ analogues active against CQ-resistant parasites (the long-side-chain analogue AQ-40 [black] and the short-side-chain analogue AQ-13 [red]) versus an inactive AQ (CQ [blue]). Differential factors that favor or disfavor activity against CQ-resistant parasites are shown in green and yellow for steric interactions, red and blue for electrostatic interactions, grey and brown for hydrophobic interactions, cyan and light blue for hydrogen bond acceptor interactions, and purple and pink for hydrogen bond donor interactions, respectively. Activity against CQ-resistant parasites is associated with either long (≥10-carbon) or short (≤3-carbon) side chains. A hydrophobic moiety in position 7 and a hydrophilic moiety on the side chain near the quinoline rings are also associated with greater activity against CQ-resistant parasites. In contrast, the model tolerates wide variation in the size and composition of the terminal tertiary amine on the side chain among AQs active against CQ-resistant parasites. The CoMSIA contours were dominated by hydrophobic contributions (brown and gray contours in Fig. 5B). These results suggest that hydrophilicity with short side chains should produce greater activity against CQ-resistant parasites and, thus, that future synthesis of aminoquinolines should explore the inclusion of hydrophilic moieties in this region.
Fig. 5.
Differential optimized CoMSIA QSAR contours for two AQ analogues active against CQ-resistant parasites and one analogue inactive against CQ-resistant parasites. The active long-side-chain and short-side-chain analogues (AQ-40 and AQ-13) are represented in black and red, respectively; the inactive intermediate-length side-chain analogue (CQ) is shown in blue. (A) Steric and electrostatic factors. Favored and disfavored steric interactions appear green and yellow, respectively. Favored and disfavored electrostatic interactions appear red and blue. (B) Hydrophobicity, hydrogen bond (HB) acceptors, and HB donors. For hydrophobicity, favored and disfavored interactions appear white (gray) and brown. For hydrogen bond acceptors, favored and disfavored interactions appear cyan and light blue. For hydrogen bond donors, favored and disfavored interactions appear purple and pink. Favored contributions are shown at a contour percentile of 80%; disfavored interactions are shown at a contour percentile of 20%.
Conclusions.
The results reported here demonstrate that it is possible to develop substantial numbers of AQs active against both CQ-susceptible and CQ-resistant P. falciparum (59 of 108 AQs [55%]). We have identified four features associated with activity against both CQ-resistant and CQ-susceptible parasites (an AQ ring without alkyl substitutions, a halogen at position 7, and two protonatable nitrogens at position 1 and the distal end of the side chain). In contrast, only one feature (a side chain length of ≤3 or ≥10 carbons) was identified as a determinant of activity against CQ-resistant P. falciparum by QSAR and the examination of 2-D structures in relation to antiparasite activity (Fig. 6).
Fig. 6.
Summary of SAR features for activity against CQ-resistant P. falciparum.
The advantage of the iterative descriptor-optimized QSAR strategy reported here is that it tests the abilities of QSAR models to predict the antiparasite activities of unknown AQs. In order to prevent descriptors with greater magnitudes from dominating other descriptors, the algorithm normalizes each descriptor to a mean of 0 with an SD of 1. Iterative retention of the strongest descriptors found by ranking PLS contributions from separate, unvalidated PLS analyses during cross-validation (to identify the optimum number of principal components) permitted refinement of the QSAR models by identifying the optimal number of descriptors necessary to predict the activities of the unknown, test set compounds (Table 3). For both biological data sets, optimization increased the importance of the minor descriptors and increased the values of q2 and the predictive q2 (Fig. 1 to 3; Table 3).
ACKNOWLEDGMENTS
We thank David Coy for encouragement, Frances J. Mather for statistical support and guidance, and Christina Styron and Torrey Theall for valiant post-Katrina administrative support.
This paper is dedicated to the memory of the late Huayin Liu, who was responsible for the synthesis and characterization of many of these analogues.
These studies were supported by the Peptide Research Fund and in part by grants from the Centers for Disease Control Emerging Infectious Diseases Program (UR3/CCU 418652 and CI 000211), the National Institutes of Health (the National Institute of Allergy and Infectious Diseases [AI 25136] and the Drug Development Program of the Divisions of AIDS and Microbiology and Infectious Diseases), a New Initiatives in Malaria Research award from the Burroughs-Wellcome Fund, and the Orphan Product Development Program of the Food and Drug Administration (FD-R01-003373).
Footnotes
Published ahead of print on 7 March 2011.
REFERENCES
- 1. Anderson E., Veith D. G., Weininger D. 1987. SMILES (Simplified Molecular Identification and Line Entry System): a line notation and computerized interpreter for chemical structures. Report EPA/600/M-87/021. U.S. Environmental Protection Agency, Environmental Research Laboratory—Duluth, Duluth, MN [Google Scholar]
- 2. Bak A., Połanski J. 2007. Modeling robust QSAR 3: SOM-4D-QSAR with iterative variable elimination IVE-PLS: application to steroid, azo dye, and benzoic acid series. J. Chem. Inf. Model. 47:1469–1480 [DOI] [PubMed] [Google Scholar]
- 3. Breman J. G., Alilio M. S., Mills A. 2004. Conquering the intolerable burden of malaria: what's new, what's needed: a summary. Am. J. Trop. Med. Hyg. 71(2 Suppl.):1–15 [PubMed] [Google Scholar]
- 4. Buller R., Peterson M. L., Almarsson O., Leiserowitz L. 2002. Quinoline-binding site on malaria pigment crystal: a rational pathway for antimalaria drug design. Crystal Growth Des. 2:553–562 [Google Scholar]
- 5. Centner V., et al. 1996. Elimination of uninformative variables for multivariate calibration. Anal. Chem. 68:3851–3858 [DOI] [PubMed] [Google Scholar]
- 6. Clark R. D. 2001. Relative and absolute diversity analysis of combinatorial libraries, p. 337–362 In Ghose A. K., Viswanadhan V. N. (ed.), Combinatorial library design and evaluation. Marcel Dekker, New York, NY [Google Scholar]
- 7. Collins W. E., et al. 1983. Studies on the Indochina I/CDC strain of Plasmodium falciparum in Colombian and Bolivian aotus monkeys and different anophelines. J. Parasitol. 69:186–190 [PubMed] [Google Scholar]
- 8. Cramer R. D., III, Patterson D. E., Bunce J. D. 1988. Comparative molecular field analysis (CoMFA). 1. Effect of shape on binding of steroids to carrier proteins. J. Am. Chem. Soc. 110:5959–5967 [DOI] [PubMed] [Google Scholar]
- 9. De D., Byers L. D., Krogstad D. J. 1997. Antimalarials: synthesis of 4-aminoquinolines that circumvent drug resistance in malaria parasites. J. Heterocyclic Chem. 34:315–320 [Google Scholar]
- 10. De D., Krogstad F. M., Byers L. D., Krogstad D. J. 1998. Structure-activity relationships for antiplasmodial activity among 7-substituted 4-aminoquinolines. J. Med. Chem. 41:4918–4926 [DOI] [PubMed] [Google Scholar]
- 11. De D., Krogstad F. M., Cogswell F. B., Krogstad D. J. 1996. Aminoquinolines that circumvent resistance in Plasmodium falciparum in vitro. Am. J. Trop. Med. Hyg. 55:579–583 [DOI] [PubMed] [Google Scholar]
- 12. De D., Mague J. T., Byers L. D., Krogstad D. J. 1995. Synthesis of (E)-2-(4,7-dichloroquinolin-2-yl)-3-dimethylamino-2-propene-1-al and its use as a synthetic intermediate. Tetrahedron Lett. 36:205–208 [Google Scholar]
- 13. Desjardins R. E., Canfield C. J., Haynes J. D., Chulay J. D. 1979. Quantitative assessment of antimalarial activity in vitro by a semiautomated microdilution technique. Antimicrob. Agents Chemother. 16:710–718 [DOI] [PMC free article] [PubMed] [Google Scholar]
- 14. Dondorp A. M., et al. 2009. Artemisinin resistance in Plasmodium falciparum malaria. N. Engl. J. Med. 361:455–467 [DOI] [PMC free article] [PubMed] [Google Scholar]
- 15. Fidock D. A., et al. 2000. Mutations in the Plasmodium falciparum digestive vacuole protein PfCRT and evidence for their role in chloroquine resistance. Mol. Cell 6:861–871 [DOI] [PMC free article] [PubMed] [Google Scholar]
- 16. Gasteiger J., Marsili M. 1978. A new model for calculating atomic charges in molecules. Tetrahedron Lett. 19:3181–3184 [Google Scholar]
- 17. Gasteiger J., Marsili M. 1980. Iterative partial equalization of orbital electro-negativity: a rapid access to atomic charges. Tetrahedron 36:3219–3222 [Google Scholar]
- 18. Gasteiger J., Marsili M. 1981. π charge distribution from molecular topology and π orbital electronegativity. Croat. Chem. Acta 53:601–614 [Google Scholar]
- 19. Ghérardi A., Sarciron M. E. 2007. Molecules targeting the purine salvage pathway in Apicomplexan parasites. Trends Parasitol. 23:384–389 [DOI] [PubMed] [Google Scholar]
- 20. Gil J. P., et al. 2003. Detection of atovaquone and Malarone resistance conferring mutations in Plasmodium falciparum cytochrome b gene (cytb). Mol. Cell. Probes 17:85–89 [DOI] [PubMed] [Google Scholar]
- 21. Greenwood B. M. 2008. From control to elimination: implications for malaria research. Trends Parasitol. 24:449–454 [DOI] [PubMed] [Google Scholar]
- 22. Hay S. I., et al. 2002. Hot topic or hot air? Climate change and malaria resurgence in East African highlands. Trends Parasitol. 18:530–534 [DOI] [PMC free article] [PubMed] [Google Scholar]
- 23. Karunajeewa H. A., et al. 2008. A trial of combination antimalarial therapies in Papua New Guinea. N. Engl. J. Med. 359:2545–2557 [DOI] [PubMed] [Google Scholar]
- 24. Kim C., et al. 2009. Development of inhibitors against TraR quorum-sensing system in Agrobacterium tumefaciens: molecular modeling of the ligand-receptor interaction. Mol. Cells 28:447–453 [DOI] [PubMed] [Google Scholar]
- 25. Klebe G., Abraham U., Mietzner T. 1994. Molecular similarity indices in a comparative analysis (CoMSIA) of drug molecules to correlate and predict their biological activity. J. Med. Chem. 37:4130–4146 [DOI] [PubMed] [Google Scholar]
- 26. Krogstad D. J., De D. 1998. Chloroquine: modes of action and resistance, and the activity of chloroquine analogs, p. 331–339 In Sherman I. W. (ed.), Malaria: parasite biology, pathogenesis, and protection. American Society for Microbiology, Washington, DC [Google Scholar]
- 27. Krogstad D. J., Gluzman I. Y., Herwaldt B. L., Schlesinger P. H., Wellems T. E. 1992. Energy-dependence of chloroquine accumulation and chloroquine efflux. Biochem. Pharmacol. 43:57–62 [DOI] [PubMed] [Google Scholar]
- 28. Krogstad D. J., et al. 1987. Efflux of chloroquine from Plasmodium falciparum: mechanism of chloroquine resistance. Science 238:1283–1285 [DOI] [PubMed] [Google Scholar]
- 29. Krogstad D. J., Schlesinger P. H., Gluzman I. Y. 1985. Antimalarials increase vesicle pH in Plasmodium falciparum. J. Cell Biol. 101:2302–2309 [DOI] [PMC free article] [PubMed] [Google Scholar]
- 30. Lakshmanan V., et al. 2005. A critical role for the PfCRTK76T mutation in Plasmodium falciparum verapamil-reversible resistance. EMBO J. 24:2294–2305 [DOI] [PMC free article] [PubMed] [Google Scholar]
- 31. Mzayek F., et al. 2007. Randomized dose-ranging controlled trial of AQ-13, a candidate antimalarial, and chloroquine in healthy volunteers. PLoS Clin. Trials 2:1–15 [DOI] [PMC free article] [PubMed] [Google Scholar]
- 32. Nair P. C., Sobhia M. E. 2008. Fingerprint directed scaffold hopping for identification of CCR2 antagonists. J. Chem. Inf. Model. 48:1891–1902 [DOI] [PubMed] [Google Scholar]
- 33. Noedl H., et al. 2008. Evidence of artemisinin-resistant malaria in western Cambodia. N. Engl. J. Med. 359:2619–2620 [DOI] [PubMed] [Google Scholar]
- 34. Pearlman R. S. 1987. Rapid generation of high quality approximate three-dimension molecular structures. Chem. Des. Auto. News 2:1–7 [Google Scholar]
- 35. Pearlman R. S., Balducci R., Rusinko A., Skell J. M., Smith K. M. 2008. CONCORD, version 8.1. Tripos, L.P., St. Louis, MO [Google Scholar]
- 36. Salum L. B., Andricopulo A. D. 2009. Fragment-based QSAR: perspectives in drug design. Mol. Divers. 13:277–285 [DOI] [PubMed] [Google Scholar]
- 37. Shah N. 5 March 2008. GSK ends its antifolate drugs Lapdap and Dacart. Topnaman Malaria blog. http://topnaman.com/drug-resistance/gsk-ends-its-antifolate-drugs-lapdap-and-dacart/
- 38. Srivani P., Sastry G. N. 2009. Potential choline kinase inhibitors: a molecular modeling study of bis-quinolinium compounds. J. Mol. Graph. Model. 27:676–688 [DOI] [PubMed] [Google Scholar]
- 39. Teklehaimanot A., Nguyen-Dinh P., Collins W. E., Barber A. M., Campbell C. C. 1985. Evaluation of sporontocidal compounds using gametocytes produced in vitro. Am. J. Trop. Med. Hyg. 34:429–434 [DOI] [PubMed] [Google Scholar]
- 40. Trager W., Jensen J. B. 1976. Human malaria parasites in continuous culture. Science 193:673–675 [DOI] [PubMed] [Google Scholar]
- 41. Tsai Y. L., Krogstad D. J. 1998. The resurgence of malaria, p. 195–212 In Scheld W. M., Craig W. A., Hughes J. M. (ed.), Emerging infections 2. American Society for Microbiology, Washington, DC [Google Scholar]
- 42. Weininger D. 1988. SMILES, a chemical language and information system. 1. Introduction to methodology and encoding rules. J. Chem. Inf. Comput. Sci. 28:31–36 [Google Scholar]
- 43. Xu L., Zhang W.-J. 2001. Comparison of different methods for variable selection. Anal. Chim. Acta 446:477–483 [Google Scholar]


