Abstract
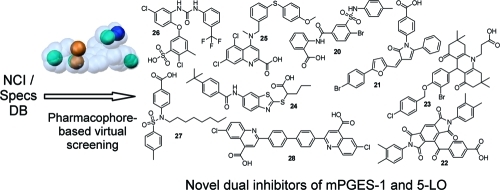
Microsomal prostaglandin E2 synthase-1 (mPGES-1) catalyzes prostaglandin E2 formation and is considered as a potential anti-inflammatory pharmacological target. To identify novel chemical scaffolds active on this enzyme, two pharmacophore models for acidic mPGES-1 inhibitors were developed and theoretically validated using information on mPGES-1 inhibitors from literature. The models were used to screen chemical databases supplied from the National Cancer Institute (NCI) and the Specs. Out of 29 compounds selected for biological evaluation, nine chemically diverse compounds caused concentration-dependent inhibition of mPGES-1 activity in a cell-free assay with IC50 values between 0.4 and 7.9 μM, respectively. Further pharmacological characterization revealed that also 5-lipoxygenase (5-LO) was inhibited by most of these active compounds in cell-free and cell-based assays with IC50 values in the low micromolar range. Together, nine novel chemical scaffolds inhibiting mPGES-1 are presented that may possess anti-inflammatory properties based on the interference with eicosanoid biosynthesis.
Introduction
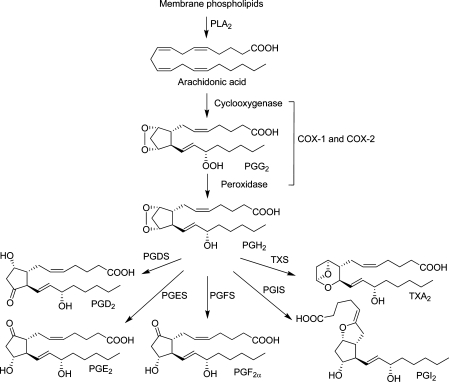
Microsomal prostaglandin E2 synthase-1 (mPGES-1) is a key enzyme in the prostaglandin (PG)E2 biosynthetic pathway within the arachidonic acid cascade. In this cascade, phospholipase A2 (PLA2) releases arachidonic acid from membrane phospholipids as a first step. Then, cyclooxygenase (COX)-1 and COX-2 catalyze the formation of the instable PGH2. In a third step, the production of prostanoids is catalyzed by several terminal prostanoid synthases. Prostaglandin E2 synthases (PGES) catalyze the conversion of PGH2 to PGE2 (Figure 1).(1) Three isoforms of PGES have been described: the two membrane-bound forms mPGES-1 and mPGES-2, as well as the cytosolic PGES (cPGES). The latter two are constitutively expressed. cPGES uses PGH2 produced by the constitutively expressed COX-1, mPGES-2 can use PGH2 produced by both COX isoforms, COX-1, or the inducible COX-2. mPGES-1, which is also an inducible enzyme, is primarily coupled to COX-2. The expression of both COX-2 and mPGES-1 is increased in response to pro-inflammatory stimuli. Studies indicate key roles of mPGES-1 in a number of disease conditions such as inflammation, arthritis, fever, pain, anorexia, atherosclerosis, stroke, and cancer.(2)
Figure 1.
Prostaglandin biosynthetic pathway.(1) PLA2, phospholipase A2; COX, cyclooxygenase; PG, prostaglandin; PGDS, prostaglandin D2 synthase; PGES, prostaglandin E2 synthase; PGFS, prostaglandin F2α synthase; PGIS, prostaglandin I2 synthase; TXS, thromboxane A2 synthase; TXA2, thromboxane A2.
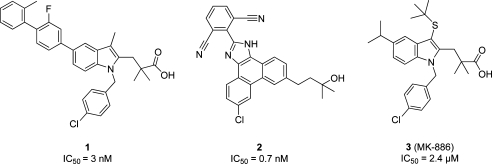
Specific inhibition of mPGES-1 is expected to interfere with inflammation-induced PGE2 formation whereas physiological PGE2 as well as other COX-derived prostanoids are not suppressed.3,4 The idea is that mPGES-1 inhibitors may not lead to side effects commonly associated with nonsteroidal anti-inflammatory drugs (NSAIDs) and coxibs. Thus, there is an increasing interest in this novel therapeutic strategy as an alternative to presently available anti-inflammatory drugs. However, to date, no pharmacological evidence for this theory in humans has been reported. Although a few inhibitors are currently in clinical trials, no mPGES-1 inhibitor is available on the market. Several inhibitors of mPGES-1 have been identified in vitro, including PG analogues and fatty acids.5,6 Highly potent mPGES-1 inhibitors include predominantly acidic indole derivatives4,7,8 and nonacidic phenanthrene derivatives.4,9 The highly potent indole compound 1 showed an IC50 value of 3 nM,(7) whereas an IC50 of 0.7 nM was determined for the phenanthrene imidazole compound 2.(4) Compound 3, also known as MK-886 (IC50 = 2.4 μM(10)), which was one of the first mPGES-1 inhibitors, is commonly used as reference inhibitor in mPGES-1 assays (Chart 1).
Chart 1. Published mPGES-1 Inhibitors.
San Juan and Cho(11) as well as AbdulHameed et al.(8) described theories on mPGES-1 ligand binding in their 3D-quantitative structure–activity relationship (QSAR) studies on mPGES-1 inhibitors. Structures that were very similar to our training set compounds 4 and 5 were used in these studies. The overall binding site architecture was described similarly in both publications; amino acid numbering was not consistent among these two studies. According to their results, the interaction site of mPGES-1 consists of a so-called cationic site and an anionic site. In the cationic site of the receptor, there is a large hydrophobic region which may be important for the selectivity of ligands for mPGES-1. Important amino acids therein might be Val residues. Ser, Thr, and/or Ala residues might form hydrogen bonds with suitable substituents of the ligand. In the anionic site of the receptor, a basic Arg, which was reported to have catalytic function,(12) is expected to interact with the ligand, ideally an acidic group.
The aim of our study was to find novel inhibitors of mPGES-1 using pharmacophore modeling and virtual screening. Although Jegerschöld et al.(13) described the X-ray crystal structure of mPGES-1, a ligand-based modeling approach was applied. As already pointed out by Rörsch and co-workers in a recent virtual screening report on nonacidic mPGES-1 inhibitors,(14) the published X-ray structure represents a closed conformation of the binding site, which makes a structure-based virtual screening approach rather difficult. In contrast to the work of Rörsch et al., our study presents a ligand-based pharmacophore modeling and virtual screening strategy leading to novel acidic mPGES-1 inhibitors.
Results and Discussion
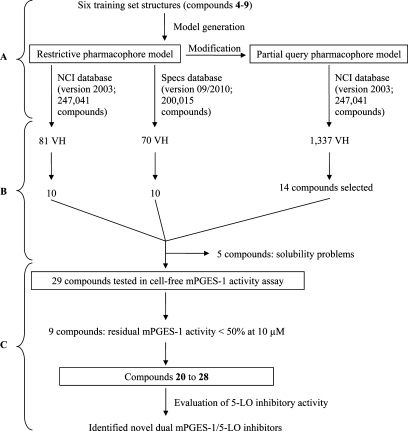
A workflow overview of this study including pharmacophore modeling, selection of compounds, and biological testing is provided in Scheme 1.
Scheme 1. Study Design Providing (A) Pharmacophore Modeling, (B) Selection of Virtual Hit (VH) Compounds, and (C) Biological Testing.
Pharmacophore Model Generation and Theoretical Validation
A ligand-based pharmacophore model for acidic mPGES-1 inhibitors was developed using the HipHopRefine algorithm of Catalyst 4.11. Model generation was based on the structural information of six acidic indole derivatives described in literature as inhibitors of mPGES-1.4,7 Although these compounds were all members of the same chemical class, they were selected for model building due to their potent mPGES-1 inhibition (compounds 4 and 5). Literature data on other acidic inhibitors did not report such highly active compounds.(15) Therefore, this was the most promising starting point to generate a high quality pharmacophore model. Although the training compounds were so similar, novel active inhibitors were expected from pharmacophore-based searches due to the well-known scaffold hopping potential of pharmacophore models.(16) The training set structures were divided into three groups: Highly active compounds with IC50 values in the low nanomolar range (4 and 5) were given priority one. The algorithm calculated numerous pharmacophore models based on the 3D alignment of these two structures. Compounds 6 and 7 were given priority two; hence, pharmacophore models that did not recognize them were discarded, which resulted in a smaller model collection. Two structures showing activity in a micromolar range (8 and 9; priority three) (Table 1) were used to identify the most valuable pharmacophore model. In this last step, the algorithm deleted models that recognized these structures with a high fit value. The best pharmacophore model consisted of six features: four hydrophobic (H) features, one aromatic ring (RA), and one negatively ionizable (NI) feature. This model correctly recognized compounds 4–7, and discarded 8 and 9. To include additional information on compound size and shape, a steric constriction was added: compound 4 was fitted into the model, converted into a shape query, and merged with the chemical features of the initial pharmacophore (Figure 2).
Table 1. Training Set Compounds Used for Pharmacophore Model Generation.
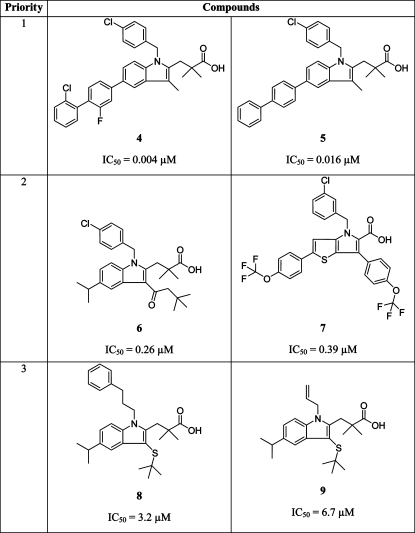 |
Figure 2.
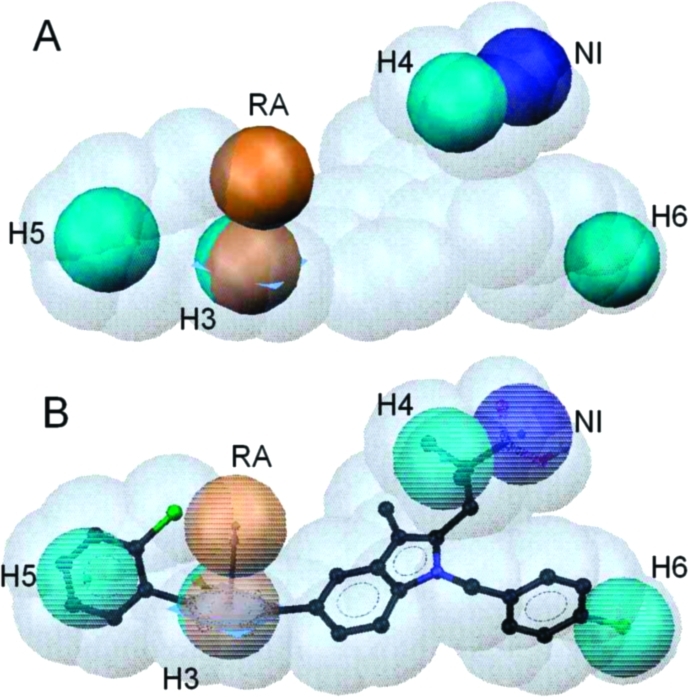
(A) Pharmacophore model for acidic mPGES-1 inhibitors consisting of one aromatic ring (RA, brown), one negatively ionizable group (NI, dark blue), four hydrophobic features (H3–6, cyan), and a shape of the most potent inhibitor from the training set (compound 4). (B) Compound 4 mapped to the pharmacophore model.
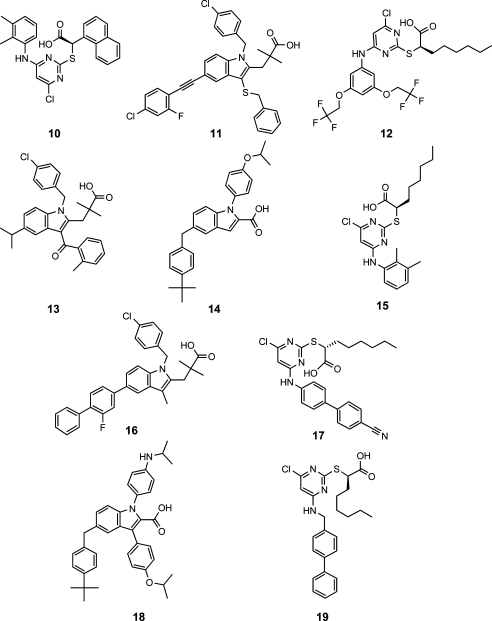
To validate the ability of the pharmacophore model to differentiate between biologically active and inactive molecules, the model was screened against an mPGES-1 inhibitor test set. This test set contained 10 mPGES-1 inhibitors that were not part of the training set and have been obtained from different literature sources (Chart 2).4,7,17−19
Chart 2. Ten Active mPGES-1 Inhibitors from the Literature, Which Were Used as Test Set Compounds.
To this test set, 72 compounds that have been biologically tested but did not inhibit mPGES-1 were added (Supporting Information Chart S1).4,7,14,17−21 The pharmacophore model for mPGES-1 inhibitors recognized 2 out of 10 active test set structures (20%),4,7,15 both indole derivatives (Table 2).
Table 2. Mapping of Active Literature-Derived Test Set Compounds into the Restrictive and the Partial Query Pharmacophore Models.
| compd | IC50 [μM] | fit valuea restrictive model | fit value partial query model |
|---|---|---|---|
| 10 | 5.1 | 0.00 | 0.00 |
| 11 | 0.06 | 1.56 | 3.53 |
| 12 | 2.6 | 0.00 | 1.50 |
| 13 | 0.9 | 0.00 | 1.60 |
| 14 | 0.06 | 0.00 | 2.32 |
| 15 | 3.9 | 0.00 | 1.67 |
| 16 | 0.007 | 4.06 | 4.26 |
| 17 | 1.7 | 0.00 | 3.23 |
| 18 | 0.07 | 0.00 | 2.05 |
| 19 | 1.3 | 0.00 | 2.89 |
The fit value is a quantitative metric, that indicates how well the chemical functions of the ligand geometrically map the features of the pharmacophore model. The maximum fit value for the reported models was 6 (each feature had a weight of 1).
None of the 72 confirmed inactive molecules matched the model. The enrichment factor for this validation result was 8.2, which indicated an excellent discriminatory power and usability for virtual screening.
However, the retrieval of only two active molecules showed the models restriction to certain chemical scaffolds. Thus, a second model was developed with the aim of broader focus on novel scaffolds. Therefore, the test set compounds from Chart 2 were added to the training compounds and fitted into the initial model, allowing one feature not to be mapped. According to the intention of this study to find new acidic inhibitors of mPGES-1, the NI feature was kept mandatory for fitting. The shape was not modified either because the hit list should not comprise structures of very high molecular weight. Thereby, all 14 compounds from Table 1 and Chart 2 with IC50 values <5 μM (the two least active compounds 9 and 10 were not found) were retrieved by the model, which means that they matched the NI feature, the shape, and four out of the five H/RA features. An analysis of mapping features did not give a clear preference of some H features or the RA feature over others. Accordingly, it could not be figured out which of the remaining features (the H ones or the RA) are most important for ligand activity. Thus, a partial query model was selected, allowing for missing any one of the H or the RA features. The partial query model retrieved 12 out of 72 inactive compounds (S16, S20, S30, S36, S40, S45, S48, S49, S51, S53, S59, S61). This indicated that the partial query model with a good retrieval of active compounds (actives hit rate 87.5%) and sufficient selectivity against inactive ones (inactives hit rate: 16.7%) has a high probability to identify structurally diverse scaffolds. Because our intention was not only to identify novel analogues of known mPGES-1 inhibitors but also to discover new classes of chemical scaffolds, we decided to use both the selective original model and the promiscuous partial query model for virtual screening.
Selection of Compounds for Biological Testing
The pharmacophore models were experimentally validated using substances provided by the National Cancer Institute (NCI), USA, and Specs, The Netherlands. First, the NCI database (version 2003, comprising 247041 compounds) was screened with the restrictive model, which led to a hit list of 81 compounds mapping all six pharmacophore model features. Because of the low number of VH, the Specs database (version 09/2010, comprising 200015 compounds) was screened, leading to 70 VH. These 151 VH were clustered by structural diversity and inspected for reactive and nondrug-like groups. In total, 20 chemically diverse compounds were selected for biological testing (compounds S73–S82 from NCI, Supporting Information Chart S2, compounds 20–25 and S83–S86 from Specs, Supporting Information Chart S3).
1,337 VH were retrieved from screening of the NCI database with the partial query model. They were submitted to the same selection process as described above, and 14 chemically diverse structures were selected for biological testing (compounds S87–S97 and 26–28, Supporting Information Chart S4).
Results of Experimental Evaluation
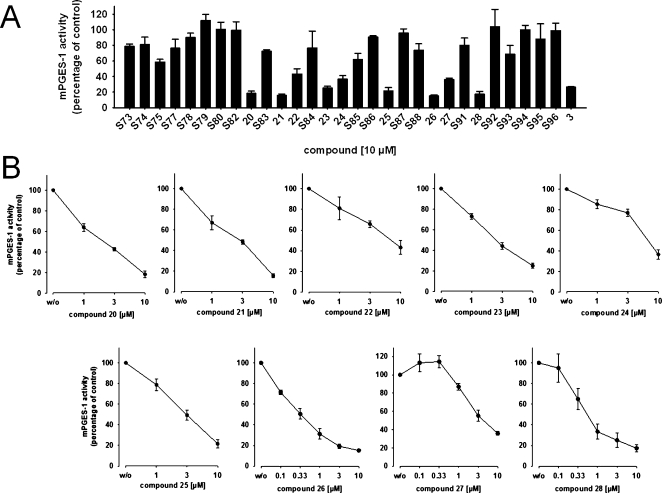
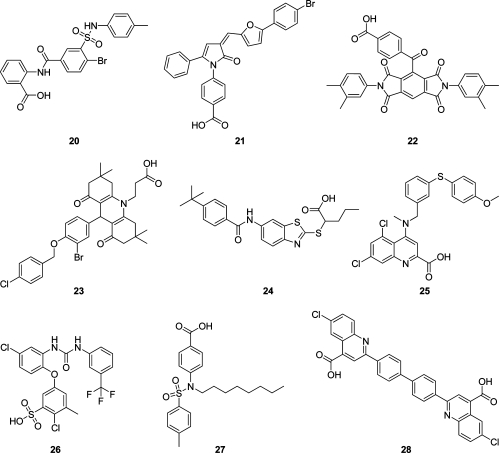
Five out of the 34 acquired compounds (S76, S81, S89, S90, and S97) could not be tested due to solubility problems in dimethyl sulfoxide (DMSO), ethanol, and water. The other 29 compounds were investigated in a cell-free mPGES-1 assay which is based on the mPGES-1-mediated enzymatic conversion of PGH2 as substrate to PGE2; the latter was analyzed by high performance liquid chromatography (HPLC) as described below. In a first screening round, all compounds (solubilized in DMSO) were tested at a concentration of 10 μM. The mPGES-1 inhibitor 3(10) was used as reference control, and DMSO (0.3%, v/v) was used as vehicle control. As shown in Figure 3A, nine compounds (i.e., 20–28, Chart 3) showed significant inhibition of mPGES-1 activity. The purity of these nine active compounds was determined using HPLC coupled to mass spectrometry (HPLC-MS). All nine substances showed ≥95% purity.
Figure 3.
Inhibition of mPGES-1 in cell-free assay, given as mean ± SE residual activity in % of uninhibited control (100%, vehicle). (A) Inhibition by test compounds (10 μM), n = 3–10. (B) Concentration-dependent inhibition of mPGES-1 by compounds 20 to 28, n = 3–7.
Chart 3. Structures of Compounds 20–28 that Inhibited mPGES-1 in the Cell-Free Assay.
A more detailed analysis of the nine active compounds in concentration–response studies revealed a potent, concentration-dependent inhibition of mPGES-1 activity by 26 and 28 with IC50 values of 0.4 and 0.5 μM, respectively. Compounds 20–25 and 27 were less active in this test system with IC50 values in the range of 2.3–7.9 μM, respectively (Figure 3B, Table 3).
Table 3. Bioactivity of Compounds 20–28 in Different Assays Determined within This Study.
| compd | mPGES-1 activity % of control at 10 μM |
mPGES-1 activity IC50 [μM] |
5-LO activity, cell-free % of control at 10 μM |
5-LO activity, cell-free IC50 [μM] |
5-LO activity, intact PMNL % of control at 10 μM |
5-LO activity, intact PMNL IC50 [μM] |
|---|---|---|---|---|---|---|
| 20 | 18.3 ± 3.0 | 2.3 | 107.9 ± 16.9 | >10 | 10.9 ± 3.5 | 4.7 |
| 21 | 15.7 ± 1.8 | 2.8 | 6.3 ± 3.5 | 0.8 | 17.4 ± 6.3 | 5.4 |
| 22 | 43.2 ± 6.7 | 7.9 | 22.3 ± 2.3 | 5.5 | 4.3 ± 0.6 | 2.8 |
| 23 | 25.1 ± 2.3 | 2.6 | 40.1 ± 8.2 | 9.2 | 49.0 ± 1.1 | 9.8 |
| 24 | 36.5 ± 4.6 | 7.7 | 40.4 ± 9.0 | 8.0 | 65.5 ± 5.7 | >10 |
| 25 | 21.6 ± 4.0 | 3.0 | 21.1 ± 3.4 | 5.2 | 3.6 ± 1.7 | 0.85 |
| 26 | 15.2 ± 1.1 | 0.4 | 9.5 ± 3.2 | 2.9 | 5.9 ± 4.1 | 2.7 |
| 27 | 35.9 ± 2.1 | 3.7 | 37.5 ± 6.8 | 5.7 | 8.2 ± 0.9 | 4.5 |
| 28 | 17.3 ± 3.3 | 0.5 | 2.6 ± 0.7 | 1.9 | 30.7 ± 7.0 | 2.3 |
| control inhibitors | 19.2 ± 3.8 (3) | 2.2 (3) | 48.4 ± 4.6 (S98, 0.3 μM) | 0.36 (S98) | 17.9 ± 3.2 (S98, 0.3 μM) | 0.11 (S98) |
Compounds 20–25 were found by the restrictive model and 26–28 by the partial query model, respectively.
Both pharmacophore models for acidic inhibitors of mPGES-1 were therefore successfully experimentally validated with a total hit rate of 31% active compounds in the virtual screening hit lists. The structures of the nine identified mPGES-1 inhibitors are chemically diverse, which proves that the pharmacophore models are applicable to scaffold hopping. These results confirm the predictive power of the models, which will be used in further virtual screening experiments.
Three identified active compounds omitted one feature of the restrictive pharmacophore model for acidic mPGES-1 inhibitors, which suggests that they do not cover the whole mPGES-1 binding site. Thus, compounds 26, 27, and 28 omitted the H feature H6, the RA, and the H feature H4, respectively (Figure 4). Neglecting such diverse features does not indicate which one of these might be of less importance for the bioactivity. Chen et al.(22) suggested in their study on 3D-QSAR pharmacophore mapping of 35 nonacidic mPGES-1 inhibitors that a hydrogen bond donor and three H features are crucial for ligand activity. Some of the generated QSAR models also included RA features, occasionally replacing an H feature. In our model, a RA feature overlapped with an H feature, thereby supporting the results from Chen et al.(22) In the absence of a cocrystal structure with an inhibitor, the actual impact of hydrophobic or aromatic functionality is hard to predict at this step.
Figure 4.
Fitting of the most active mPGES-1 inhibitors 26 (A) and 28 (B) into the mPGES-1 partial query pharmacophore model.
Docking Studies for mPGES-1 Inhibitors
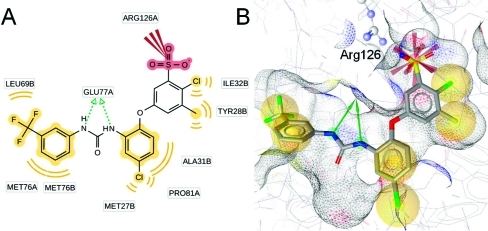
As a comparison of the ligand-based pharmacophore models with information from the X-ray crystal structure, induced fit docking experiments were performed with compounds from literature as well as with the most active, newly identified inhibitor 26. Docking of compound 4 and the analysis of predicted protein–ligand interactions confirmed the locations of NI and H chemical features contained in the pharmacophore models. For the RA feature, no corresponding protein–ligand interaction could be observed (Figure 5). Docking of compound 26 resulted in a binding mode that is shown in Figure 6. More detailed information on the molecular docking experiments performed in this study is given in the Supporting Information.
Figure 5.
Predicted binding mode of compound 4 to mPGES-1. (A) 2D depiction of all observed protein–ligand interactions. (B) Protein–ligand interactions corresponding to the ligand-based pharmacophore features. Chemical interactions are color-coded: hydrophobic, yellow; negative charge, red. Arg110 and Arg126 from the basic subpocket are shown in ball-and-stick style.
Figure 6.
Predicted binding mode of compound 26 to mPGES-1. (A) 2D depiction of all observed protein–ligand interactions. (B) Protein–ligand interactions corresponding to the ligand-based pharmacophore features. Chemical interactions are color-coded: hydrophobic, yellow; negative charge, red. Arg126 from the basic subpocket is shown in ball-and-stick style.
Previous studies with other mPGES-1 inhibitors showed that some of them also interfere with the activity of 5-lipoxygenase (5-LO). Such dual mPGES-1/5-LO inhibitors are, for instance, licofelone23,24 and pirinixic acid derivatives.(17) Thus, the newly identified mPGES-1 inhibitors were further investigated concerning their potential to interfere with 5-LO activity. 5-LO catalyzes the initial steps in the biosynthesis of leukotrienes (LTs), which are further central mediators in inflammatory reactions, as reviewed by Peters-Golden and Henderson.(25) Inhibition of the activity of human recombinant 5-LO in a cell-free assay by compounds 20–28 was determined. Compound 20 was inactive in this test system, but the remaining eight compounds suppressed 5-LO activity in a concentration-dependent manner. Compound 21 even showed to be highly active with an IC50 = 0.8 μM, comparable to the control 5-LO inhibitor S98 (BWA4C, Supporting Information Chart S5).
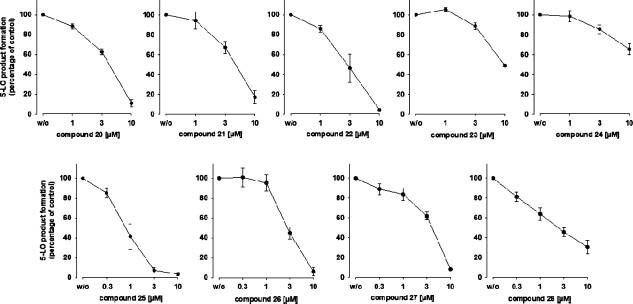
To confirm the bioactivity of the compounds on 5-LO, human polymorphonuclear leukocytes (PMNL) expressing 5-LO were used to investigate 5-LO inhibition in a cell-based test system. Therein, compounds 20–23 and 25–28 (at a concentration of 10 μM, respectively) proved to inhibit 5-LO with residual activity below 50% of control, whereas compound 24 was hardly active (Table 3). Further experiments at different concentrations of the inhibitors were carried out in order to determine the IC50 values. 5-LO product synthesis was reduced concentration-dependently by all nine inhibitors (Figure 7). Of interest, compound 25 was the most potent inhibitor in this test system with an IC50 = 0.85 μM. An overview of the pharmacological results determined within this study is provided in Table 3.
Figure 7.
Concentration-dependent inhibition of 5-LO product formation in human PMNL by compounds 20–28, given as mean ± SE residual activity in % of uninhibited control (100%, vehicle); n = 4.
Finally, the ability of the most potent novel mPGES-1 inhibitors (i.e., compounds 26 and 28) to induce cytotoxicity was determined. Neither compound 26 nor compound 28 (10 μM, each) reduced the viability of human lung epithelial carcinoma A549 cells or leukemic Jurkat A3 T lymphocytes (Supporting Information Figure S1).
Conclusions
Within this study, pharmacophore modeling and virtual screening led to the identification of novel dual inhibitors of mPGES-1 and 5-LO activity. Therefore, our novel pharmacophore models are valuable tools for selecting test compounds from various databases. The nine identified active compounds 20–28 were not only strong inhibitors of mPGES-1 in cell-free assays but were also able to inhibit 5-LO in cell-free assays and/or in intact cells. On the one hand, selective inhibitors are desired to learn more about the target and its binding site. On the other hand, simultaneous inhibition of several physiologically related targets supports the multitarget idea.(26) The interference with several anti-inflammatory targets from the arachidonic acid cascade should provide benefits in pharmacotherapy in terms of synergistic therapeutic effects as well as reduction of the incidence of typical NSAID-related side effects. Future studies will address the investigation of the overall pharmacological profile of compounds 20–28 in more detail and will aim to assess their anti-inflammatory activity in vivo.
Experimental Section
Hardware and Software Specifications
Molecular modeling studies were carried out on a personal computer running Fedora 8 Linux. Pharmacophore modeling and virtual screening experiments were performed using Catalyst 4.11 software (Accelrys Inc., San Diego, CA, USA). Structural clustering of VH compounds was calculated using PipelinePilot version 7.5 (Accelrys Inc., San Diego, CA, USA).
Data Preparation
All compounds from the training and test sets as well as the NCI and the Specs compound collection underwent 3D structure generation, minimization, and conformational analysis before the pharmacophore model development and virtual screening. The ligands from the training and the active compounds from the test set were built using the View Compound Workbench module of Catalyst 4.11. Compounds were optimized in 3D geometry and energetically minimized using the CHARMm force field implemented in Catalyst. A maximum of 250 conformers per ligand with a maximal energy threshold of 20 kcal/mol above the calculated energy minimum was computed using Catalyst’s BEST conformation generation mode. The NCI database was downloaded from the NCI download page (dtp.nci.nih.gov/docs/3d_database/Structural_information/structural_data.html) and converted into a 3D multiconformational database using the catDB module of Catalyst 4.11. For each molecule, a maximum of 100 conformers, respectively, was computed in FAST mode. The resulting NCI database contained 247041 entries.
In a quite similar way, the Specs database was downloaded from the vendor homepage (www.specs.net). The conformational model for the database entries was calculated using the catDB module and FAST mode, with up to 100 conformers per molecule. The resulting 3D database required for the virtual screening consisted of 200015 entries.
Compilation of Test Set Molecules for Theoretical Model Validation
Ten mPGES-1 inhibitors were obtained from literature based on their diversity and potency. In addition, 72 structurally unique compounds were found in literature that showed no inhibitory activity for mPGES-1 in biological assays. These confirmed inactives were added to the mPGES-1 inhibitor test set. Energetically minimized 3D structures and conformers for the 10 active and 72 inactive molecules of the test set were generated as mentioned above.
Pharmacophore Model Generation and Theoretical Validation
For model building and refinement, the HipHop Refine algorithm of Catalyst 4.11 was employed. This algorithm considers a maximum of five different chemical feature types. On the basis of an analysis of the chemical features present in the training set structures, hydrogen bond acceptor, hydrogen bond donor, H, RA, and NI features were selected for this study. For the calculation setup, two ligand properties have to be specified. The principal value indicates the activity level of the molecule. A high principal value of 2 gives the molecule top priority and labels it as a reference molecule of which all chemical features are considered in building the pharmacophore space during model generation. The principal value of 1 labels a molecule as moderately active. Conformations of this molecule are considered when placing pharmacophore features. Finally, a principal value of 0 indicates low or absent activity of this molecule. Those compounds are not considered for common feature pharmacophore model building. However, they are considered for placing exclusion volume spheres. The second ligand property to define is the MaxOmitFeat value. This parameter specifies how many features are allowed to miss for each molecule. A MaxOmitFeat value of 0 indicates that all features in the generated model must map the compound. MaxOmitFeat 1 allows that all but one of the features in the generated pharmacophore must map the compound. A MaxOmitFeat value of 2 indicates that no features from the model need to map the compound. For the calculation of the mPGES-1 model, compounds 4 and 5 had a principal value of 2 and a MaxOmitFeat value of 0. Compounds 6 and 7 were assigned principal and MaxOmitFeat values of 1, while compounds 8 and 9 were given a principal value of 0 and a MaxOmitFeat value of 2. The shape of compound 4 was generated by mapping the molecule into the initial pharmacophore model using the Compare/Fit tool of Catalyst 4.11 with 0 allowed omitted features. The best fitting conformation, which showed the maximum possible fit value, was transformed into a shape query and merged with the chemical features of the initial model.
Virtual screening of the test set was performed using the fast (rigid) search algorithm of Catalyst 4.11. Fit calculations were computed using the “best fit” mode, which allows limited conformational flexibility of the ligand while fitting to the pharmacophore model.
Virtual Screening of the NCI and the Specs Databases, Structural Clustering, and Selection of Test Compounds
The NCI and the Specs databases were screened using the same settings as for the test set compound screening. VH were clustered according to their structural diversity using Pipeline Pilot. The script converted the structures into SciTegic’s ECFPs and determined the similarity between these fingerprints applying the Tanimoto coefficient. From each cluster, compounds were mapped to the model for visual inspection.
Test Compounds
Test substances used for the biological investigation were either purchased from Specs, The Netherlands, or kindly provided by the Drug Synthesis and Chemistry Branch, Developmental Therapeutics Program, Division of Cancer Treatment and Diagnosis, NCI, USA. The purity of compounds 20–28, which inhibited mPGES-1 formation with an IC50 below 10 μM, was determined by HPLC-MS to be ≥95%.
Assay Systems, Materials
Dulbecco’s Modified Eagle Medium (DMEM)/High Glucose (4.5 g/L) medium, RPMI medium, penicillin, streptomycin, trypsin/ethylenediaminetetraacetate (EDTA) solution, N-2-hydroxyethylpiperazine-N′-2-ethanesulfonic acid (HEPES), and LSM 1077 lymphocyte separation medium were obtained from PAA (Pasching, Austria). IL-1β was obtained from ReproTech (Hamburg, Germany). Fetal calf serum (FCS), phenylmethanesulphonyl fluoride (PMSF), leupeptin, soybean trypsin inhibitor (STI), glutathione (reduced), compound S98, PGB1, lysozyme, Ca2+-ionophore A23187, arachidonic acid, thiazolyl blue tetrazolium bromide (MTT), and cycloheximide were obtained from Sigma-Aldrich (Deisenhofen, Germany). Compound 3 and 11β-PGE2 were obtained from Cayman Chemical (Ann Arbor, MI). PGH2, adenosine triphosphate (ATP), isopropyl-β-d-1-thiogalactopyranoside (IPTG), dextrane, and staurosporine were obtained from Larodan (Malmoe, Sweden), Roche Diagnostics (Mannheim, Germany), AppliChem (Darmstadt, Germany), Fluka (Neu-Ulm, Germany), and Calbiochem (San Diego, CA), respectively. A549 and Jurkat A3 cells were provided by the Karolinska Institute (Stockholm, Sweden) and Dr. John Blenis (Boston, MA), respectively. Leukocyte concentrates from human healthy volunteers were provided by the Institute for Clinical Transfusion Medicine (University Hospital Tuebingen, Germany).
Cell Culture
Cells were cultured in the respective media at 37 °C in a 6% CO2 incubator. Jurkat A3 cells were grown in RPMI medium containing heat-inactivated FCS (10%, v/v), HEPES (10 mM), penicillin (100 U/mL), and streptomycin (100 μg/mL) and reseeded with a density of 2 × 10⁵ cells/mL medium after three days. A549 cells were grown in DMEM High Glucose (4.5 g/mL) medium supplemented with heat-inactivated FCS (10%, v/v), penicillin (100 U/mL), and streptomycin (100 μg/mL). After three days, confluent cells were detached using 1× trypsin/EDTA and reseeded with a density of 105 cells/mL medium.
Preparation of Crude mPGES-1 in Microsomes of A549 Cells and Determination of mPGES-1 Enzymatic Activity
Preparation of A549 cells and determination of mPGES-1 activity was performed as described previously.(24) In brief, A549 cells were treated with 1 ng/mL interleukin-1β for 48 h at 37 °C and 5% CO2. After sonification, the homogenate was subjected to differential centrifugation at 10000g for 10 min and 174000g for 1 h at 4 °C. The pellet (microsomal fraction) was resuspended in 1 mL homogenization buffer (0.1 M potassium phosphate buffer pH 7.4, 1 mM PMSF, 60 μg/mL STI, 1 μg/mL leupeptin, 2.5 mM glutathione, and 250 mM sucrose), and the total protein concentration was determined. Microsomal membranes were diluted in potassium phosphate buffer (0.1 M, pH 7.4) containing 2.5 mM glutathione. Test compounds or vehicle were added, and after 15 min at 4 °C, the reaction (100 μL total volume) was initiated by addition of PGH2 (20 μM, final concentration, unless stated otherwise). After 1 min at 4 °C, the reaction was terminated using stop solution (100 μL; 40 mM FeCl2, 80 mM citric acid, and 10 μM of 11β-PGE2 as internal standard). PGE2 was separated by solid phase extraction and analyzed by RP-HPLC as described.(24)
Docking Studies
Docking was performed using the induced fit docking module available within Maestro (www.schrödinger.com). The X-ray crystal structure of mPGES-1, which does not include a substrate or inhibitor of the enzyme and is crystallized in a closed conformation, was derived from the PDB (code 3dww)(13) and preprocessed using the Protein Preparation Wizard of Maestro software suite. Details on ligand and protein preparation, setting for induced fit docking, and docking validation are available as Supporting Information.
Expression and Purification of Human 5-LO from Escherichia coli (E. coli)
E. coli MV1190 was transformed with pT3–5-LO plasmid expressing human recombinant 5-LO and the protein was expressed at 27 °C as described.(27) Cells were lysed in 50 mM triethanolamine/HCl pH 8.0, 5 mM EDTA, STI (60 μg/mL), 1 mM PMSF, and lysozyme (500 μg/mL), homogenized by sonication (3 × 15 s), and centrifuged at 40000g for 20 min at 4 °C. The 40000g supernatant (S40) was applied to an ATP-agarose column to partially purify 5-LO as described previously.(27) Semipurified 5-LO was immediately used for activity assays.
Determination of 5-LO Activity in Cell-Free Assay
Aliquots of semipurified 5-LO (0.5 μg) were diluted with ice-cold PBS containing 1 mM EDTA, and 1 mM ATP was added; final volume was 1 mL. Samples were preincubated with the test compounds as indicated. After 10 min at 4 °C, samples were prewarmed for 30 s at 37 °C, and 2 mM CaCl2 plus 20 μM AA was added to start 5-LO product formation. The reaction was stopped after 10 min at 37 °C by addition of 1 mL of ice-cold methanol, and the formed metabolites were analyzed by RP-HPLC as described.(28) 5-LO products include the all-trans isomers of LTB4 and 5(S)-hydro(pero)xy-6-trans-8,11,14-cis-eicosatetraenoic acid.
Isolation of PMNL and Determination of 5-LO Activity in PMNL
PMNL were freshly isolated from leukocyte concentrates obtained at the Blood Center of the University Hospital Tuebingen (Germany) as described.(29) In brief, venous blood was taken from healthy adult donors that did not take any medication for at least 7 days, and leukocyte concentrates were prepared by centrifugation (4000g, 20 min, 20 °C). PMNL were immediately isolated from the pellet after centrifugation on Nycoprep cushions, and hypotonic lysis of erythrocytes was performed. PMNL were finally resuspended in PBS pH 7.4 (PBS) containing 1 mg/mL glucose and 1 mM CaCl2 (PGC buffer) (purity >96–97%).
Freshly isolated PMNL (107/mL PGC buffer) were preincubated with the test compounds for 15 min at 37 °C, and 5-LO product formation was started by addition of 2.5 μM ionophore A23187 plus 20 μM AA. After 10 min at 37 °C, the reaction was stopped with 1 mL of methanol and 30 μL of 1 N HCl, and then 200 ng PGB1 and 500 μL PBS were added. Formed 5-LO metabolites were extracted and analyzed by HPLC as described.(28) 5-LO products include LTB4 and its all-trans isomers, and 5(S)-hydro(pero)xy-6-trans-8,11,14-cis-eicosatetraenoic acid. Cysteinyl-LTs C4, D4, and E4 were not detected, and oxidation products of LTB4 were not determined.
Determination of Cell Viability
Cell viability was assessed by trypan blue staining and light microscopy as well as by MTT assay. For MTT assay, Jurkat A3 (3 × 10⁵ cells/mL) or A549 cells (4 × 10⁵) were plated in a 75 cm3 cell culture flask and incubated at 37 °C and 5% CO2 for 72 h. Then, test compounds were added and the incubation was continued for 24 h before cell viability was determined as described.(30) The cytotoxic compounds cycloheximide (CHX) and staurosporine (Stauro) were used as controls.
Acknowledgments
This work was supported by the National Research Network project “Drugs from Nature Targeting Inflammation” (subprojects S10702 and S10703) granted by the Austrian Science Fund (FWF). D.S. is grateful for a Young Talents grant and the Erika Cremer Habilitation Program from the University of Innsbruck. We thank the National Cancer Institute for providing test compounds free of charge.
Glossary
Abbreviations Used
- 5-LO
5-lipoxygenase
- COX
cyclooxygenase
- cPGES
cytosolic prostaglandin E2 synthase
- H
hydrophobic feature
- DMSO
dimethyl sulfoxide
- HPLC-MS
high performance liquid chromatography coupled to mass spectrometry
- IL
interleukin
- LPS
lipopolysaccharide
- LT
leukotriene
- mPGES-1
microsomal prostaglandin E2 synthase-1
- mPGES-2
microsomal prostaglandin E2 synthase-2
- NI
negatively ionizable feature
- NSAID
nonsteroidal anti-inflammatory drug
- PG
prostaglandin
- PGDS
prostaglandin D2 synthase
- PGES
prostaglandin E2 synthase
- PGFS
prostaglandin F2α synthase
- PGIS
prostaglandin I2 synthase
- PLA2
phospholipase A2
- PMNL
polymorphonuclear leukocytes
- QSAR
quantitative structure–activity relationship
- RA
aromatic ring feature
- ROC
receiver operating characteristic
- TXA2
thromboxane A2
- TXS
thromboxane A2 synthase
- VH
virtual hits
Supporting Information Available
A chart of inactive compounds of the mPGES-1 inhibitor test set, charts of all compounds selected for biological testing, the structure of S98, cell viability data, and detailed information on the molecular docking of mPGES-1 inhibitors. This material is available free of charge via the Internet at http://pubs.acs.org.
Supplementary Material
References
- Loeffler G.; Petrides P. E.. Biochemie and Pathobiochemie, 7th ed.; Springer: Berlin, Heidelberg, New York, 2003. [Google Scholar]
- Samuelsson B.; Morgenstern R.; Jakobsson P. J. Membrane prostaglandin E synthase-1: a novel therapeutic target. Pharmacol. Rev. 2007, 59, 207–224. [DOI] [PubMed] [Google Scholar]
- Mehrotra S.; Morimiya A.; Agarwal B.; Konger R.; Badve S. Microsomal prostaglandin E2 synthase-1 in breast cancer: a potential target for therapy. J. Pathol. 2006, 208, 356–363. [DOI] [PubMed] [Google Scholar]
- Friesen R. W.; Mancini J. A. Microsomal prostaglandin E2 synthase-1 (mPGES-1): a novel anti-inflammatory therapeutic target. J. Med. Chem. 2008, 51, 4059–4067. [DOI] [PubMed] [Google Scholar]
- Thoren S.; Jakobsson P. J. Coordinate up- and down-regulation of glutathione-dependent prostaglandin E synthase and cyclooxygenase-2 in A549 cells. Inhibition by NS-398 and leukotriene C4. Eur. J. Biochem. 2000, 267, 6428–6434. [DOI] [PubMed] [Google Scholar]
- Quraishi O.; Mancini J. A.; Riendeau D. Inhibition of inducible prostaglandin E(2) synthase by 15-deoxy-delta(12,14)-prostaglandin J(2) and polyunsaturated fatty acids. Biochem. Pharmacol. 2002, 63, 1183–1189. [DOI] [PubMed] [Google Scholar]
- Riendeau D.; Aspiotis R.; Ethier D.; Gareau Y.; Grimm E. L.; Guay J.; Guiral S.; Juteau H.; Mancini J. A.; Methot N.; Rubin J.; Friesen R. W. Inhibitors of the inducible microsomal prostaglandin E2 synthase (mPGES-1) derived from MK-886. Bioorg. Med. Chem. Lett. 2005, 15, 3352–3355. [DOI] [PubMed] [Google Scholar]
- AbdulHameed M. D.; Hamza A.; Liu J.; Huang X.; Zhan C. G. Human microsomal prostaglandin E synthase-1 (mPGES-1) binding with inhibitors and the quantitative structure–activity correlation. J. Chem. Inf. Model. 2008, 48, 179–185. [DOI] [PubMed] [Google Scholar]
- Cote B.; Boulet L.; Brideau C.; Claveau D.; Ethier D.; Frenette R.; Gagnon M.; Giroux A.; Guay J.; Guiral S.; Mancini J.; Martins E.; Masse F.; Methot N.; Riendeau D.; Rubin J.; Xu D.; Yu H.; Ducharme Y.; Friesen R. W. Substituted phenanthrene imidazoles as potent, selective, and orally active mPGES-1 inhibitors. Bioorg. Med. Chem. Lett. 2007, 17, 6816–6820. [DOI] [PubMed] [Google Scholar]
- Claveau D.; Sirinyan M.; Guay J.; Gordon R.; Chan C. C.; Bureau Y.; Riendeau D.; Mancini J. A. Microsomal prostaglandin E synthase-1 is a major terminal synthase that is selectively up-regulated during cyclooxygenase-2-dependent prostaglandin E2 production in the rat adjuvant-induced arthritis model. J. Immunol. 2003, 170, 4738–4744. [DOI] [PubMed] [Google Scholar]
- San Juan A. A.; Cho S. J. 3D-QSAR study of microsomal prostaglandin E2 synthase (mPGES-1) inhibitors. J. Mol. Model. 2007, 13, 601–610. [DOI] [PubMed] [Google Scholar]
- Jakobsson P. J.; Morgenstern R.; Mancini J.; Ford-Hutchinson A.; Persson B. Common structural features of MAPEG—a widespread superfamily of membrane associated proteins with highly divergent functions in eicosanoid and glutathione metabolism. Protein Sci. 1999, 8, 689–692. [DOI] [PMC free article] [PubMed] [Google Scholar]
- Jegerschold C.; Pawelzik S. C.; Purhonen P.; Bhakat P.; Gheorghe K. R.; Gyobu N.; Mitsuoka K.; Morgenstern R.; Jakobsson P. J.; Hebert H. Structural basis for induced formation of the inflammatory mediator prostaglandin E2. Proc. Natl. Acad. Sci. U.S.A. 2008, 105, 11110–11115. [DOI] [PMC free article] [PubMed] [Google Scholar]
- Rorsch F.; Wobst I.; Zettl H.; Schubert-Zsilavecz M.; Grosch S.; Geisslinger G.; Schneider G.; Proschak E. Nonacidic inhibitors of human microsomal prostaglandin synthase 1 (mPGES 1) identified by a multistep virtual screening protocol. J. Med. Chem. 2010, 53, 911–915. [DOI] [PubMed] [Google Scholar]
- Koeberle A.; Zettl H.; Greiner C.; Wurglics M.; Schubert-Zsilavecz M.; Werz O. Pirinixic acid derivatives as novel dual inhibitors of microsomal prostaglandin E2 synthase-1 and 5-lipoxygenase. J. Med. Chem. 2008, 51, 8068–8076. [DOI] [PubMed] [Google Scholar]
- Hessler G.; Baringhaus K.-H. The scaffold hopping potential of pharmacophores. Drug Discovery Today: Technol. 2010, 7, 263–269. [DOI] [PubMed] [Google Scholar]
- Köberle A.; Zettl H.; Greiner C.; Wurglics M.; Schubert-Zsilavecz M.; Werz O. Pirinixic acid derivatives as novel dual inhibitors of microsomal prostaglandin E2 synthase-1 and 5-lipoxygenase. J. Med. Chem. 2008, 51, 8068–8076. [DOI] [PubMed] [Google Scholar]
- Olofsson K.; Suna A.; Pelcman B.; Ozola V.; Katkevics M.; Kalvins I. Indoles useful for the treatment of inflammation. Int. Pat. Appl. PCT WO 2005/123673 A1, 29Dec2005.
- Olofsson K.; Suna A.; Pelcman B.; Ozola V.; Katkevics M.; Kalvins I.; Schaal W. Indoles useful in the treatment of inflammation. Int. Pat. Appl. PCT WO 2005/123675 A1, 29Dec2005.
- Edwards B. S.; Bologa C.; Young S. M.; Balakin K. V.; Prossnitz E. R.; Savchuck N. P.; Sklar L. A.; Oprea T. I. Integration of virtual screening with high-throughput flow cytometry to identify novel small molecule formylpeptide receptor antagonists. Mol. Pharmacol. 2005, 68, 1301–1310. [DOI] [PubMed] [Google Scholar]
- Rohrer S. G.; Baumann K. Maximum unbiased validation (MUV) data sets for virtual screening based on PubChem bioactivity data. J. Chem. Inf. Model. 2009, 49, 169–184. [DOI] [PubMed] [Google Scholar]
- Chen C. Y.-C. Pharmacoinformatics approach for mPGES-1 in anti-inflammation by 3D-QSAR pharmacophore mapping. J. Taiwan Inst. Chem. Eng. 2009, 40, 155–161. [Google Scholar]
- Celotti F.; Laufer S. Anti-inflammatory drugs: new multitarget compounds to face an old problem. The dual inhibition concept. Pharmacol. Res. 2001, 43, 429–436. [DOI] [PubMed] [Google Scholar]
- Koeberle A.; Siemoneit U.; Buhring U.; Northoff H.; Laufer S.; Albrecht W.; Werz O. Licofelone suppresses prostaglandin E2 formation by interference with the inducible microsomal prostaglandin E2 synthase-1. J. Pharmacol. Exp. Ther. 2008, 326, 975–982. [DOI] [PubMed] [Google Scholar]
- Peters-Golden M.; Henderson W. R. Jr. Leukotrienes. N. Engl. J. Med. 2007, 357, 1841–1854. [DOI] [PubMed] [Google Scholar]
- Hopkins A. L. Network pharmacology: the next paradigm in drug discovery. Nature Chem. Biol. 2008, 4, 682–690. [DOI] [PubMed] [Google Scholar]
- Fischer L.; Szellas D.; Radmark O.; Steinhilber D.; Werz O. Phosphorylation- and stimulus-dependent inhibition of cellular 5-lipoxygenase activity by nonredox-type inhibitors. FASEB J. 2003, 17, 949–951. [DOI] [PubMed] [Google Scholar]
- Werz O.; Burkert E.; Samuelsson B.; Radmark O.; Steinhilber D. Activation of 5-lipoxygenase by cell stress is calcium independent in human polymorphonuclear leukocytes. Blood 2002, 99, 1044–1052. [DOI] [PubMed] [Google Scholar]
- Pergola C.; Dodt G.; Rossi A.; Neunhoeffer E.; Lawrenz B.; Northoff H.; Samuelsson B.; Radmark O.; Sautebin L.; Werz O. ERK-mediated regulation of leukotriene biosynthesis by androgens: a molecular basis for gender differences in inflammation and asthma. Proc. Natl. Acad. Sci. U.S.A 2008, 105, 19881–19886. [DOI] [PMC free article] [PubMed] [Google Scholar]
- Tretiakova I.; Blaesius D.; Maxia L.; Wesselborg S.; Schulze-Osthoff K.; Cinatl J. Jr.; Michaelis M.; Werz O. Myrtucommulone from Myrtus communis induces apoptosis in cancer cells via the mitochondrial pathway involving caspase-9. Apoptosis 2008, 13, 119–131. [DOI] [PubMed] [Google Scholar]
Associated Data
This section collects any data citations, data availability statements, or supplementary materials included in this article.


