Abstract
To study the global regulation of cell morphology, a number of groups have recently reported genome-wide screening data for yeast mutants with abnormal morphology. Despite the relatively simple ellipsoidal shape of yeast cells, in the past, cell morphology researchers have processed information on cells manually. These time-consuming, entirely subjective tasks motivated us to develop image-processing software that automatically extracts yeast cells from micrographs and processes them to measure key morphological characteristics such as cell size, roundness, bud neck position angle, nuclear DNA localization and actin localization. To date, we have retrieved 960 609 cells from 52 988 micrographs of 2531 mutants using our software, and we have published the results in the Saccharomyces cerevisiae Morphological Database (SCMD), which facilitates the analysis of abnormal cells. Our system provides quantitative data for shapes of the daughter and mother cells, localization of the nuclear DNA and morphology of the actin patches. To search for mutants with similar morphological traits, the system outputs a list of mutants ranked by similarity of average morphological parameters. The SCMD is available at http://yeast.gi.k.u-tokyo.ac.jp/.
INTRODUCTION
The establishment of cell morphology is universal during the development of both uni- and multicellular organisms (1). To study the global regulation of these morphological characteristics, the budding yeast Saccharomyces cerevisiae is frequently used as a model species (2–4), because yeast cells have a relatively simple ellipsoidal shape and the availability of the complete sequence of the S.cerevisiae genome (5) makes it easy to produce mutants.
However, it remains unclear how yeast cell morphology is regulated. A number of research groups have presented genome-wide screening data relevant to cell morphology regulation. The Saccharomyces Genome Deletion Project Consortium has constructed a set of yeast strains each lacking the function of a different gene or ORF (6). Using this mutant set, Jorgensen et al. (7) examined cell size distribution for the complete set of ∼6000 S.cerevisiae gene deletion strains and identified ∼500 abnormally small or large mutants. Zhang et al. (8) also screened cell size mutants. Ni and Snyder (9) carried out the first bud site selection screen. Giaever et al. (10) screened 4401 homozygous diploid deletion mutants and grouped them into seven classes: elongated, round, small, large, pointed, clumped and other. In the past, such classification tasks were undertaken by means of laborious and subjective manual methods. An objective, automated technique for these tasks is therefore required. For comparative studies of large numbers of mutants, manual methods are unsuitable for effectively gathering reproducible, quantitative data.
CELL IMAGE PROCESSING
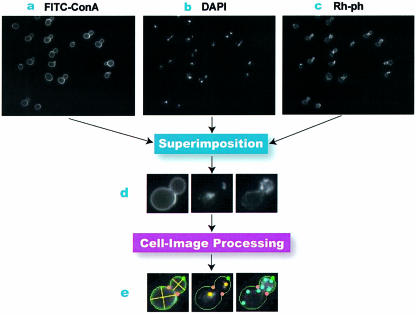
To overcome this problem, we have developed an image-processing program (11) that automatically characterizes each yeast cell using a number of morphological parameters (Fig. 1). We have used yeast non-essential gene disruptant haploid set (6) to construct a database of yeast cell morphology. Experimental details can be found in our companion paper (11). The Saccharomyces cerevisiae Morphological Database (SCMD) publishes micrographs and quantitative data using the image-processing software; it is intended as a resource that complements existing sequence and gene-expression databases (12–16). The SCMD system associates individual mutants with references to corresponding SGD (13) and MIPS (14) entries.
Figure 1.
The scheme of the image-processing program of budding yeast cells. (a) An input image of his3-containing cells stained with FITC-ConA for cell wall identification. (b) An image of the same view as (a), but stained with DAPI to localize nuclei. (c) An image similar to (a) and (b), but stained with Rh-ph to visualize the actin distribution. (d) Combining photos (a), (b) and (c) superimposes images of the cell wall, nuclei and actin for individual cells. (e) Processed images of cell wall, nuclei and actin patches from the cell in (d) are presented from left to right. The cell wall is represented in green; then, bud necks (illustrated by two red bullets) are identified to separate mother cells and buds. Subsequently, we attempt to fit an ellipse to each mother cell or bud to measure roundness, bud neck position angle and other morphological parameters (11). The yellow lines show the long and short axes of the fitted ellipses. Information on the localization of the nuclei is obtained with our software, and in the image, yellow bullets indicate nuclei. The positions of actin patches are monitored with our software. They are determined relative to the cell wall, and are shown as light blue dots.
CATEGORIZING CELLS INTO THEIR STAGE IN THE CELL CYCLE
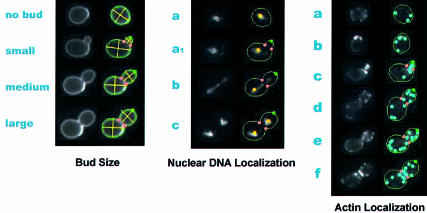
The automated classification of cells into their stage in the cell cycle enables us to count the number of cells in each phase, which reflects the duration of the phase statistically. The phase of cells in the cell cycle can be approximately determined from the size of the bud. Figure 2 illustrates how cells are classified into their bud stages and are displayed in the SCMD system. In addition, cells can be categorized based on the detailed information on nuclear DNA and actin localization. The SCMD system gives the number of cells in each phase in order to detect irregularities in nuclear DNA and actin localization.
Figure 2.
Categorizing cells into their stage in the cell cycle: In the budding yeast, the phase to which a cell belongs can be roughly determined from cell morphology information. The left images illustrate that the ratio of bud cell size changes with cell cycle progression. The middle images display categorization by nuclear DNA localization: (a) cells with no buds, (a1) those with one nucleus in the mother cell at the early stage of budding, (b) those with nuclei at the bud necks and (c) those with two nuclei in the mother and daughter cells. The right-hand pictures present categorization according to actin localization: (a) actin is uniformly distributed, (b) actin patches are localized at the presumptive bud site in unbudded cells, (c) tiny buds filled with actin patches (apical growth phase), (d) medium buds with actin patches localized in the tips (isotropic growth phase), (e) medium or large buds with evenly localized actin patches and (f) actin patches are gathered at the bud necks. For each mutant, the number of cells in each phase is counted and is available in the SCMD system.
SEARCHING FOR DISRUPTANTS OF SIMILAR SHAPE
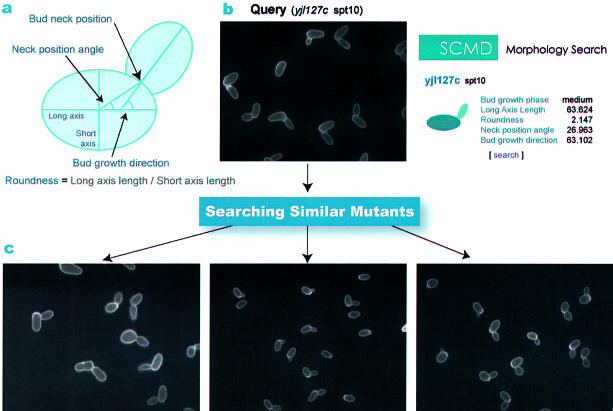
Precise measurement of cell shape allows us to search for disruptants that are similar in shape to a particular disruptant. This similarity search uses the primary parameters illustrated in Figure 3a. After ellipses are fitted to both the mother and daughter cells, the cell size is defined as the area of the fitted ellipse. We measured the size of mother cells that have buds, because after division a daughter cell grows until it puts out a bud, after which its size becomes stable. The SCMD system calculates the average of these key parameter values for individual disruptants. The distance between the averages of two disruptants is an indicator of their similarity in shape. Consequently, the SCMD system can search for disruptants with average parameter values that are similar to those of the focal disruptant, as illustrated in Figure 3.
Figure 3.
Searching for mutants of similar shape according to key morphological cell parameters. (a) To calculate key parameter values, first ellipses are fitted to the mother and daughter cells. The roundness of the fitted area is defined as the ratio of the length of the short axis to that of the long axis. The bud neck position is the midpoint between the two points used to determine the bud area. The bud neck position angle is the angle between the long axis of the ellipse fitted to the mother cell and the line connecting the center of the mother cell and the bud neck position. The bud growth direction is the angle between the long axes of the ellipses fitted to the mother cell and bud. (b) The image presents an example query of a micrograph of mutant yjl127c (spt10) to search. The shape of this mutant differs significantly from that of the wild type in Figure 1. (c) The similarity search function of the SCMD outputs mutants that are similar to a particular mutant, yjl127c for instance, ranked by the distance between the average morphological parameters. The images show three similar disruptants: yil040w, yjl075c and ynl246w.
GRAPHICAL VIEWER AND XML BACK-END DATABASE
The graphical query interface is implemented to run on users’ client computers, allowing users to visualize the shapes of mother and daughter cells interactively in response to the parameter changes that they enter. The interface is designed so that it works with common web browsers, such as Netscape and Internet Explorer, without installing any plug-ins. The back-end database that stores the micrographs and their statistics is coded in XML, which is flexible enough that it can incorporate an increasing number of attribute names, such as parameters for the cell wall, nuclei, actin and other phenotypes of interest.
UPDATES AND FUTURE DIRECTIONS
As of October 2003, our web server provides data for 2531 mutants; we intend to add ∼300 mutants per month and cover all the disruptants of 5000 non-essential genes within 1 year. We plan to publicize specific classes of mutants such as round mutants and elongated ones that are obtained by clustering according to average morphological parameter values.
Acknowledgments
ACKNOWLEDGEMENTS
The authors would like to thank the members of the Ohya and Morishita groups at the University of Tokyo for stimulating discussions. This research has been partly supported by the Institute for Bioinformatics and Research and Development, of the Japan Science and Technology Corporation.
REFERENCES
- 1.Drubin D.G. (2000) Cell Polarity. Oxford University Press, Oxford, UK, pp. 1–320. [Google Scholar]
- 2.Bassett D.E., Eisen,M.B. and Boguski,M.S. (1999) Gene expression informatics—it’s all in your mine. Nature Genet., 21, 51–55. [DOI] [PubMed] [Google Scholar]
- 3.Hieter P. (1999) Functional genomics: What do yeast proteins do? Nature, 402, 362–363. [DOI] [PubMed] [Google Scholar]
- 4.Sali A. (1999) Genomics: Functional links between proteins. Nature, 402, 23–26. [DOI] [PubMed] [Google Scholar]
- 5.Goffeau A., Barrell,B.G., Bussey,H., Davis,R.W., Dujon,B., Feldmann,H., Galibert,F., Hoheisel,J.D., Jacq,C., Johnston,M. et al. (1996) Life with 6000 genes. Science, 274, 563–567. [DOI] [PubMed] [Google Scholar]
- 6.Winzeler E.A., Shoemaker,D.D., Astromoff,A., Liang,H., Anderson,K., Andre,B., Bangham,R., Benito,R., Boeke,J.D., Bussey,H. et al. (1999) Functional characterization of the S.cerevisiae genome by gene deletion and parallel analysis. Science, 285, 901–906. [DOI] [PubMed] [Google Scholar]
- 7.Jorgensen P., Nishikawa,J.L., Breitkreutz,B.J. and Tyers,M. (2002) Systematic identification of pathways that couple cell growth and division in yeast. Science, 297, 395–400. [DOI] [PubMed] [Google Scholar]
- 8.Zhang J., Schneider,C., Ottmers,L., Rodriguez,R., Day,A., Markwardt,J. and Schneider,B.L. (2002) Genomic scale mutant hunt identifies cell size homeostasis genes in S. cerevisiae. Curr. Biol., 12, 1992–2001. [DOI] [PubMed] [Google Scholar]
- 9.Ni L. and Snyder,M. (2001) A genomic study of the bipolar bud site selection pattern in Saccharomyces cerevisiae. Mol. Biol. Cell, 12, 2147–2170. [DOI] [PMC free article] [PubMed] [Google Scholar]
- 10.Giaever G., Chu,A.M., Ni,L., Connelly,C., Riles,L., Veronneau,S., Dow,S., Lucau-Danila,A., Anderson,K., Andre,B. et al. (2002) Functional profiling of the Saccharomyces cerevisiae genome. Nature, 418, 387–391. [DOI] [PubMed] [Google Scholar]
- 11.Ohtani M., Saka,A., Sano,F., Ohya,Y. and Morishita,S. (2003) Development of image processing program for yeast cell morphology. J. Bioinform. Comput. Biol., in press. [DOI] [PubMed] [Google Scholar]
- 12.Ball C.A., Jin,H., Sherlock,G., Weng,S., Matese,J.C., Andrada,R., Binkley,G., Dolinski,K., Dwight,S.S., Harris,M.A. et al. (2001) Saccharomyces genome database provides tools to survey gene expression and functional analysis data. Nucleic Acids Res., 29, 80–81. [DOI] [PMC free article] [PubMed] [Google Scholar]
- 13.Dwight S.S., Harris,M.A., Dolinski,K., Ball,C.A., Binkley,G., Christie,K.R., Fisk,D.G., Issel-Tarver,L., Schroeder,M., Sherlock,G. et al. (2002) Saccharomyces genome database (SGD) provides secondary gene annotation using the gene ontology (GO). Nucleic Acids Res., 30, 69–72. [DOI] [PMC free article] [PubMed] [Google Scholar]
- 14.Mewes H.W., Frishman,D., Guldener,U., Mannhaupt,G., Mayer,K., Mokrejs,M., Morgenstern,B., Munsterkotter,M., Rudd,S. and Weil,B. (2002) MIPS: a database for genomes and protein sequences. Nucleic Acids Res., 30, 31–34. [DOI] [PMC free article] [PubMed] [Google Scholar]
- 15.Iyer V.R., Horak,C.E., Scafe,C.E., Botstein,D., Snyder,M. and Brown,P.O. (2001) Genomic binding sites of the yeast cell-cycle transcription factors sbf and mbf. Nature, 409, 533–538. [DOI] [PubMed] [Google Scholar]
- 16.Ooi S.L., Shoemaker,D.D. and Boeke,J.D. (2001) A DNA microarray-based genetic screen for nonhomologous end-joining mutants in Saccharomyces cerevisiae. Science, 294, 867–870. [DOI] [PubMed] [Google Scholar]


