

Abstract
We measured the UV resonance Raman excitation profiles and Raman depolarization ratios of the arginine (Arg) vibrations of the amino acid monomer, as well as, Arg in the 21-residue predominantly alanine peptide, AAAAA(AAARA)3A (AP) between 194 and 218 nm. Excitation within the π→π* peptide bond electronic transitions result in UVRR spectra dominated by amide peptide bond vibrations. The Raman cross sections and excitation profiles indicate that the Arg side chain electronic transitions mix with the AP peptide bond electronic transitions. The Arg Raman bands in AP exhibit Raman excitation profiles similar to those of the amide bands in AP which is conformation specific. These Arg excitation profiles distinctly differ from the Arg monomer. The Raman depolarization ratio of Arg in monomeric solution are quite simple with ρ=0.33 indicating enhancement by a single electronic transition. In contrast, we see very complex depolarization ratios of Arg in AP that indicate that the Arg residues are resonance enhanced by multiple electronic transitions.
INTRODUCTION
There is little understanding of the electronic transitions of peptides and proteins.1–10 It is generally assumed that peptide and protein electronic transitions result from the summation of the electronic transitions of the constituent chromophores. The peptide bond π→π* transitions have been characterized to a limited extent, as have been the transitions of the different isolated side chain chromophores.1–13 However, there has been little attention paid to the potential coupling of the peptide bond transitions to the side chain electronic transitions or to coupling between side chain transitions. Coupling of side chain – peptide bond transitions could be important in areas such as electron transport, for example.
In the work here, we use UV resonance Raman (UVRR) spectroscopy14–28 to probe the electronic transitions of Arg side chains in a predominantly poly-Ala peptide. UVRR spectroscopy is unique in its ability to provide insight into the electronic excited state geometry and the localization of electronic transitions through measurements of Raman excitation profiles and Raman depolarization ratios.24,25,29–37
We examined the excitation profiles of the three Arg residues within a 21-residue, primarily poly-Ala peptide (AP), which has been well characterized and used as a model for α-helix conformations and α-helix melting. AP has previously been shown to be an α-helical conformation at low temperatures that melts to a predominantly poly-proline II-like (PPII) conformation at high temperatures.15,19,21,22,25 Excitation between 180 and 215 nm occurs in resonance with the peptide bond π→π* electronic transitions, resulting in enhancement of amide vibrations.14–17,19–22,24,25,28–38 We show here that the electronic transitions of the Arg side chains strongly couple to the π→π* peptide bond electronic transitions.
MATERIALS AND METHODS
Sample Preparation
The 21-residue poly-alanine peptide AAAAA(AAARA)3A (AP) was prepared by AnaSpec (San Jose, CA) using solid-state peptide synthesis (HPLC pure). We used 2 mg/ml (1.13 mM) AP solutions that contained sodium perchlorate (0.2 M) as an internal standard for the UVRRS measurements. The Arg HCl (Arg) (Sigma; St. Louis, MO) UVRRS measurements used 2 mg/ml (9.7 × 10⁻³ M) solutions with sodium perchlorate (0.2 M) as an internal standard. The UVRR spectral measurements of Arg were taken at 25 °C ± 0.5 °C. The AP UVRR spectral measurements were measured at both 5 °C ± 0.5 ° C (where AP is a mixture of α-helical and PPII conformations) and at 60 ° C ± 0.5 ° C (where the PPII-like conformation dominates) (Fig. 1). All UVRRS and absorption spectra of AP and Arg were measured at pH 7.
Figure 1.

AP conformations (upper panel) and structure (lower panel). AP is predominantly α-helical at low temperatures, and PPII-like at high temperatures.
Raman Instrumentation
The UVRR instrumentation was previously described in detail.39 The excitation profile measurements utilize two Coherent Indigo-S Ti:Sapphire laser systems to span the spectral region of interest. Both lasers utilize intra-cavity frequency doubled, Q-switch pulsed Nd:YLF Evolution 15 lasers (527 nm wavelength, 5 kHz repetition rate, 10 W average power) to pump Ti:Sapphire oscillators generating tunable radiation from 772 to 840 nm and 840 to 960 nm. These tunable Ti:Sapphire lasers are frequency quadrupled and mixed, utilizing two different harmonic generation approaches. The first laser uses two successive frequency doublers to convert the fundamental wavelengths (840–960 nm) to the deep UV (210–240 nm). The second harmonic generation process mixes the third harmonic with the fundamental to produce tunable radiation between 193 and 210 nm. The average powers in the UV are between 2–5 mW (193–210 nm) and 2–10 mW (210–220 nm).
The laser beam is focused into a temperature-controlled, circulating flow stream which was surrounded by a N2 gas environment, thereby eliminating Raman scattering from the O2 Raman band at 1555 cm−1. Each 20-mL sample of AP or Arg was irradiated for a maximum of 15 min. The scattered light was directed into a subtractive double monochromator39 and the Raman scattered light was detected by a liquid nitrogen cooled CCD (Princeton Instruments, Spec-10:400B). The Raman intensities were normalized to the 932 cm−1 perchlorate ClO4− symmetric stretch vibration. The spectra were analyzed and deconvoluted using Grams/32 AI 8.0 software (Thermo Electron Corporation, Waltham, MA).
UV Raman depolarization ratios (ρ) were measured by using a backscattering geometry. The light scattered from the sample was directed through a UV linear dichroic polarizer (Oriel Instruments, Stratford, CT) and a crystalline quartz scrambler (Spex Industries, Edison, NJ) placed directly before the monochromator entrance slit. The depolarization ratios were measured between 198 to 218 nm and at 229 nm. The incident beams were highly polarized. ρ was calculated as the ratio of the perpendicularly polarized (I⊥) to the parallel polarized scattered light (I||):
| (1) |
The depolarization ratios were calibrated by using the depolarization ratios of ClO4− and cyclohexane as standards.35
Spectrometer Efficiency
The spectrometer used is a modified Spex 1401 double monochromator that operates in the 193–270 nm range. The throughput efficiency of the spectrometer varies over this range. We corrected for the differences in throughput by using previously determined efficiency measurements.39
Absorption Measurement
The UV absorbance spectra between 190 and 260 nm were measured by using a Cary 5000 Varian UV-Vis-NIR spectrophotometer. The Arg solution concentration used for the absorbance measurements was 3.4 × 10⁻⁴ M. The absorbance measurements for the Arg samples were taken at 25 °C ± 0.5 °C. The AP absorption measurements used 0.15 mM concentrations at temperatures of 5 ° C ± 0.5 ° C and 60 ° C ± 0.5 ° C.
RESULTS AND DISSCUSION
Absorption Spectra
Figure 2 shows the absorption spectra of AP and Arg. The broad bands at 190 nm of the AP samples derive from the peptide bond π → π* transitions, while the band from Arg monomer derives from the two lowest π→π* transitions of the guanidinium group.40 These guanidinium electronic transitions have been calculated to be at 199 and 185 nm by Sension et al.40 These authors, however, have further stated that the calculated values are probably too low by 3000–6000 cm−1, and the transitions are more likely to be at 177–188 nm and 166–175 nm. The Fig. 2 absorption spectrum does not show discrete peaks for the transitions, presumably because it does not go to short enough wavelengths. We previously showed that AP at both low and high temperatures show excitonic interactions between the peptide bond NV1 π → π* transitions and higher energy transitions that impact the peptide bond absorption band.25
Figure 2.

UV absorption spectrum of arg at pH 7 and 25 °C; UV absorption spectra of AP at 5 °C, where it is predominantly α-helical, and at 60 °C, where it is predominantly in a PPII-like conformation.
UVRR Spectra of Arg
The UVRRS of Arg at 25 ° C excited between 218 to 194 nm are shown in Fig. 3. The spectra are normalized with respect to the 932 cm−1 ClO4− band (not shown), but are not corrected for self absorption or spectrometer efficiency. The UV Raman enhanced Arg vibrations include the guanidinium group overlapping 1669 and 1633 cm−1 bands, which arise primarily from CN stretching (st), NH2 scissoring (sci), and NH bending (b) vibrations.41–44 The 1565 cm−1 band is due to NH2 sci, and is only present in spectra excited below 200 nm.40 The 1454 cm−1 band is due to CH2 sci.42,43 The 1176 cm−1 band results from CH2 twisting (tw), CH b, and NH2 tw of the guanidinium group.42,43,45 The 1091 cm−1 band is due primarily to a NH2 rocking (rock) vibration of the guanidinium group with NH2 wagging (w), CH2 w, and CH b.42,43,45
Figure 3.
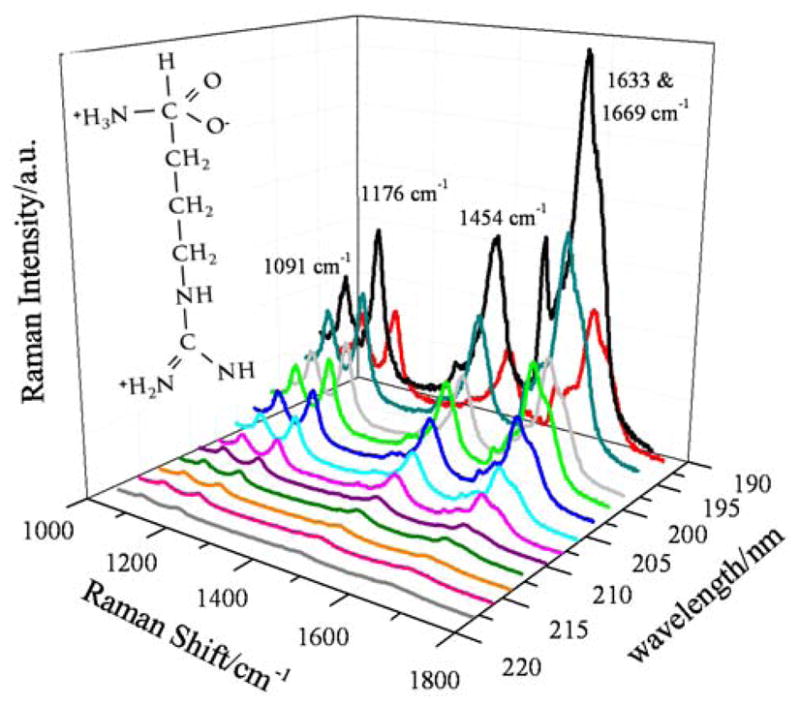
UVRR spectra of Arg at 25° C between 218 and 194 nm. The spectra were collected for 15 min at each excitation wavelength. The spectral resolution varies between 5.9 cm−1 at 218 nm and 7 cm−1 at 194 nm. All spectra were normalized to the ClO4− internal standard (not shown). Inset: Arg structure.
The relative intensities of the UVRR bands of Arg increase as the excitation wavelength decreases from 218 to 196 nm (Fig. 3), but the intensity decreases for 194 nm excitation.
The 204 nm UVRR spectra of AP in the PPII-like and α-helix conformations are shown in Fig. 4 with the Arg bands labeled. The UVRR spectra of the PPII-like and α-helical AP conformations significantly differ, as do their excitation profiles.25 The Arg bands at 1091, 1176, and 1454 cm−1 are clearly evident. The 1600–1670 cm−1 region Arg bands underlie the amide I band, but by modeling can be resolved.
Figure 4.

UVRR spectra of AP (pH 7) at 60 °C and 5 °C excited at 204 nm. The spectra were collected for 15 min at each excitation wavelength. The Arg bands in the AP
Absolute Raman Cross Sections
We calculated the Raman cross sections of the Arg bands in solution and the Arg bands in AP by using ClO4− as an internal standard. We previously showed that the ClO4− Raman cross section dependence on excitation wavelength is well modeled by an Albrecht A-term frequency dependence for excitation wavelengths from the visible to the UV to 220 nm:18
| (2) |
where K2 is a constant equal to 2.34 × 10⁻²⁶ cm2/mol·sr, νo is the incident laser excitation frequency (cm−1), νmn is the frequency of the Raman vibrational mode (cm−1), and νe is the frequency of the transition to the resonant excited state (1.28 × 105 cm−1). We assume this cross section frequency dependence occurs down to 194 nm.24,25
We normalized all of the UVRR spectra to the integrated intensity of the ClO4− 932 cm−1 band. The absolute Raman cross sections (with correction for self absorption) of the Arg bands in both conformations of AP and for pure Arg in solution were calculated as:
| (3) |
where Iband and IClO4 are the observed integrated intensities of the Arg and ClO4− bands, respectively; k(λband) and k(λClO4) are the spectrometer efficiencies at the specific wavelengths of the Raman bands; Csample and CClO4 are the concentrations (M) of the AP or Arg samples and perchlorate; σClO4 is the calculated ClO4− cross section at the excitation wavelength; nArg is the number of Arg residues in AP; εo is the extinction coefficient for AP at the excitation frequency; εs is the extinction coefficient for AP at each Raman band wavelength; and εr is the extinction coefficient for ClO4− band at each excitation wavelength. The expression in the brackets corrects the Raman intensities for self absorption.24,25,46,47
Excitation Profiles of Arg in Solution
Figure 5a shows the Raman excitation profile cross sections of Arg in solution. The excitation profile cross sections increase from 218 to 194 nm, reaching a maximum at 196 nm and then decrease. The excitation profiles are all significantly narrower than is the Arg absorption spectrum (Fig. 5). These Arg monomer excitation profile maxima, which should signal a guanidinium group π→π* transition, appear at lower energy than the calculated lowest energy transitions for the guanidinium group (< 188 nm).40 Thus, our Raman excitation profile data are not consistent with Sension et al.’s calculations and indicate that the lowest π→π* transition of Arg occurs at 196 nm. The 1091 (NH2 rock; NH2 w, CH2 w, and CH b), 1176 (CH2 twist, CH b, and NH2 tw), 1454 (CH2 sci), and 1633 (CN st, NH2 sci, NH b) cm−1 vibrations have similar excitation profiles between 198 and 218 nm. There appears to be a shoulder between 200 and 210 nm in the Arg excitation profiles.
Figure 5.

a) Absolute Raman cross section (mbarn·mol−1·sr−1) excitation profiles between 194 to 218 nm of Arg in solution at 25 °C. Also shown is the Arg absorption spectrum. b) Absolute Raman cross section excitation profiles (mbarn·Arg residue−1·sr−1) of Arg vibrations in the PPII-like conformation of AP, and the AP AmII Raman cross section excitation profile (mbarn·peptide bond−1·sr−1) of the PPII-like conformation. c) Absolute Raman cross section excitation profiles (mbarn·Arg residue−1·sr−1) of the Arg vibrations of the α-helix conformation of AP, and the α-helix conformation AP peptide bond AmII Raman cross section excitation profile (mbarn·peptide bond−1·sr−1).
Recent studies by our group on the absorption spectrum of ethylguanidinium, that has the same local guanidinium group symmetry and the same vibrational spectra above ~ 1000 cm−1 as the Arg side chain, indicates the existence of a broad underlying transition centered between 200 and 210 nm.48
Excitation Profiles of Arg in AP
Figures 5b and 5c show the Raman cross section excitation profiles of the 1091, 1176, 1454, and 1633 cm−1 Arg bands observed in the UVRR spectra of AP in both the PPII and α-helix conformations, along with the AP peptide bond AmII vibration which has an excitation profile similar to those of other peptide bond amide vibrations.
The excitation profiles of the Arg residues in both conformations of AP (Figs. 5b and 5c) significantly differ from the excitation profiles of pure Arg in solution (Fig. 5a). Remarkably, and quite unexpectedly, the AP PPII Arg and the α-helix Arg bands have the same excitation profiles as the peptide bonds in both the AP PPII-like and α-helix conformations. The cross sections of the AP Arg bands (per Arg residue) are similar to those of the AmII vibration (per peptide bond; Figs. 5b and 5c). This is most clearly evident in Figure 6.
Figure 6.

Overlapped (mbarn · peptide bond−1 · sr−1) cross sections of (a) the AP AmII vibration and Arg 1633 cm−1 band in AP PPII-like conformation; (b) AP AmII vibration and Arg 1633 cm−1 band in AP α-helix conformation.
The essentially identical Raman excitation profiles of the Arg and peptide bond vibrations in AP clearly indicates mixing between the overlapping Arg guanidinium group electronic transitions and those of the peptide backbone.
Depolarization Ratios
To further explore the electronic interactions between the AP peptide backbone and Arg side chains, we measured the dispersions of the UVRR depolarization ratios of the Arg bands in AP. The value of ρ can be used to signal the existence of electronic transitions underlying broad absorption bands. A resonance Raman depolarization ratio of ρ = 0.33 indicates that only a single, non-degenerate electronic transition contributes to the resonance Raman tensor elements.24,25,31,32,49 When ρ ≠ 0.33 the resonance enhancement arises from at least two electronic transitions contributing to the Raman tensor. If ρ > 0.33, and if there are only two diagonal elements of the Raman tensor, they must be of opposite sign. For ρ < 0.33, where only two diagonal elements contribute, the two diagonal elements must be of the same sign.24,25,31,32,49 Thus, ρ ≠ 0.33 requires the contribution of at least two electronic transitions.
In resonance Raman, ρ = 0.75 indicates a totally non-symmetric vibration, while ρ = 0.125 indicates two identical Raman tensor elements that could result from a doubly degenerate resonant electronic transition.49
For Arg in solution, with ρ = 0.33 the excitation wavelength independence of the depolarization ratios indicates that a single electronic transition dominates the enhancement for this excitation frequency region (Fig. 7). This presumably is the lower energy π→π* transition of the substituted guanidinium group. This alkyl guanidinium substitution breaks the symmetry of the normally degenerate guanidinium group π→π* symmetry, splitting the transition.40
Figure 7.

Depolarization ratios of Arg in water. These ρ = 0.33 values indicate the occurrence of a single electronic transition
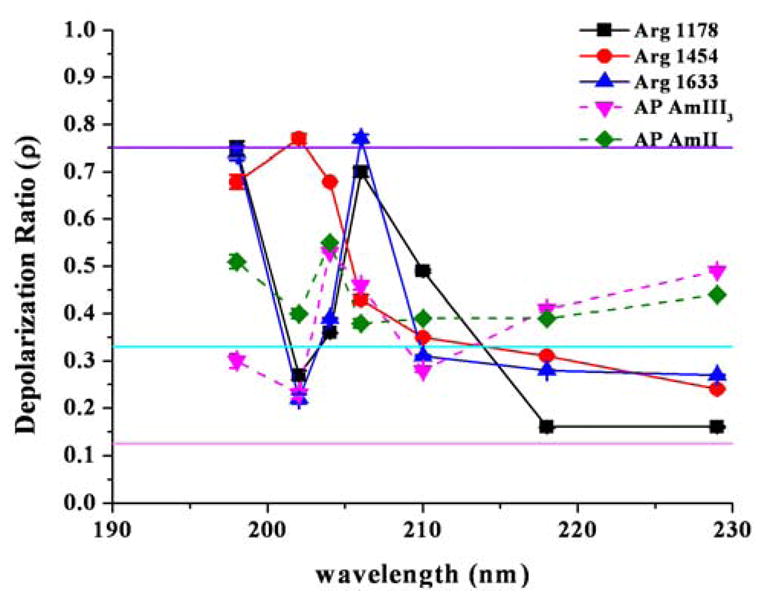
Figure 8 and 9 show the depolarization ratios of the 1178, 1454, and 1633 cm−1 AP Arg bands, as well as two amide peptide bond vibrations of the AmIII3 and AmII in the PPII-like (Fig. 8) and the α-helix (Fig. 9) conformations. For both conformations we find that the there is a complex dispersion of the depolarization ratio with variation in the excitation wavelength. For the PPII-like conformation (Fig. 8) we see that although both the AP AmIII3 and AmII vibrations have depolarization ratios above ρ = 0.33, the ratios do not go above ρ = 0.65, with four of the AmIII3 ρ values at or below ρ = 0.33 (at λex = 198, 206, 218 and 229 nm). The AP Arg vibrations however reach values of both ρ = 0.125 and ρ = 0.75 for several wavelengths.
Figure 8.

Depolarization ratios of the Arg vibrations and of two AP amide vibrations in the PPII-like conformation of AP. Single electronic transitions ρ = 0.33 (aqua), totally non-symmetric transitions ρ = 0.75 (purple) and totally symmetric transitions, ρ = 0.125 (pink) ρ values are indicated by solid lines.
Figure 9.
Depolarization ratios for the Arg vibrations and for two AP amide vibrations in the α-helix conformation of AP. Single electronic transitions ρ = 0.33 (aqua), totally non-symmetric transitions ρ = 0.75 (purple) and totally symmetric transitions, ρ = 0.125 (pink) are indicated by solid lines.
These depolarization values indicate contributions of multiple electronic transitions. For the α-helix conformation (Fig. 9), we see a similar depolarization ratio pattern for the Arg vibrations. Further, the UV resonance Raman excitation profiles and Raman depolarization ratios indicate that the electronic transitions of the Arg side chains in the peptide AP distinctly differ for those of pure Arg in solution. The results clearly show that the Arg side chains in AP undergo electronic interactions with the overlapping peptide bond π→π* electronic transitions of the peptide backbone.
Conclusions
We measured the UV resonance Raman excitation profiles and depolarization ratios for the Arg residues attached to the peptide AP and for Arg in solution. We find that the resonance Raman excitation profiles of the Arg in both the α-helix and PPII-like conformations of AP are essentially identical to those of the amide peptide bond bands. These excitation profiles are distinctly different from the excitation profiles of the monomeric Arg amino acid in solution. The excitation profiles similarities must result from interactions of the Arg side chain electronic transitions with the peptide backbone amide π→π* transition.
We show that the depolarization ratios of the Arg monomer amino acid in water indicate that single electronic transitions dominate for excitation between 198 and 210 nm. In complete contradiction, we show the depolarization ratios of the Arg residues in AP indicate contributions of multiple electronic transitions.
This must be due to the mixing of higher electronic transitions with the peptide bond NV1 π→π* transition in AP and with the overlapping broad transition of the guanidinium group. Excitation in this spectral region drives both electronic transitions. This may have important consequences on understanding electron transport in peptides and proteins.
Acknowledgments
We thank Dr. Nataliya Myshakina, Zhenmin Hong, and Jonathan Wert for useful discussions. We also thank the NIH for funding, Grant #1R01EB009089.
References
- 1.Barnes DG, Rhodes W. J Chim Phys. 1968;48:817. doi: 10.1063/1.1668717. [DOI] [PubMed] [Google Scholar]
- 2.Basch H, Robin MB, Kuebler NA. J Chem Phys. 1967;47:1201. [Google Scholar]
- 3.Basch H, Robin MB, Kuebler NA. J Chem Phys. 1968;49:5007. [Google Scholar]
- 4.Johnson WC, Jr, Simpson WT. J Chem Phys. 1968;48:2168. [Google Scholar]
- 5.Kaya K, Nagakura S. Theor Chim Acta. 1967;7:117. [Google Scholar]
- 6.Moffitt W. Proc Natl Acad Sci US. 1956;42:736. doi: 10.1073/pnas.42.10.736. [DOI] [PMC free article] [PubMed] [Google Scholar]
- 7.Moffitt W. J Chem Phys. 1956;25:467. [Google Scholar]
- 8.Nagakura S. Mol Phys. 1960;3:105. [Google Scholar]
- 9.Peterson DL, Simpson WT. J Am Chem Soc. 1957;79:2375. [Google Scholar]
- 10.Schellman JA, Nielsen EB. J Phys Chem. 1967;71:3914. doi: 10.1021/j100866a051. [DOI] [PubMed] [Google Scholar]
- 11.Woody RW. Monatsh Chem. 2005;136:347. [Google Scholar]
- 12.Woody RW. J Am Chem Soc. 2009;131:8234. doi: 10.1021/ja901218m. [DOI] [PubMed] [Google Scholar]
- 13.Woody RW. Chirality. 2010;22:E22. doi: 10.1002/chir.20857. [DOI] [PubMed] [Google Scholar]
- 14.Asher SA, Ianoul A, Mix G, Boyden MN, Karnoup A, Diem M, Schweitzer-Stenner R. J Am Chem Soc. 2001;123:11775. doi: 10.1021/ja0039738. [DOI] [PubMed] [Google Scholar]
- 15.Asher SA, Mikhonin AV, Bykov S. J Am Chem Soc. 2004;126:8433. doi: 10.1021/ja049518j. [DOI] [PubMed] [Google Scholar]
- 16.Bykov S, Asher S. J Phys Chem B. 2010;114:6636. doi: 10.1021/jp100082n. [DOI] [PMC free article] [PubMed] [Google Scholar]
- 17.Bykov SV, Asher SA. J Phys Chem Lett. 2010;1:269. doi: 10.1021/jz900117u. [DOI] [PMC free article] [PubMed] [Google Scholar]
- 18.Dudik JM, Johnson CR, Asher SA. J Chem Phys. 1985;82:1732. [Google Scholar]
- 19.Lednev IK, Karnoup AS, Sparrow MC, Asher SA. J Am Chem Soc. 1999;121:8074. doi: 10.1021/ja003381p. [DOI] [PubMed] [Google Scholar]
- 20.Ma L, Ahmed Z, Mikhonin AV, Asher SA. J Phys Chem B. 2007;111:7675. doi: 10.1021/jp0703758. [DOI] [PubMed] [Google Scholar]
- 21.Mikhonin AV, Ahmed Z, Ianoul A, Asher SA. J Phys Chem B. 2004;108:19020. [Google Scholar]
- 22.Mikhonin AV, Bykov SV, Myshakina NS, Asher SA. J Phys Chem B. 2006;110:1928. doi: 10.1021/jp054593h. [DOI] [PubMed] [Google Scholar]
- 23.Shafaat HS, Sanchez KM, Neary TJ, Kim JE. J Raman Spectrosc. 2009;40:1060. [Google Scholar]
- 24.Sharma B, Asher SA. J Phys Chem B. 2010;114:6661. doi: 10.1021/jp100428n. [DOI] [PMC free article] [PubMed] [Google Scholar]
- 25.Sharma B, Bykov Sergei V, Asher Sanford A. J Phys Chem B. 2008;112:11762. doi: 10.1021/jp801110q. [DOI] [PMC free article] [PubMed] [Google Scholar]
- 26.Shi Z, Olson CA, Bell AJ, Jr, Kallenbach NR. Biopolymers. 2001;60:366. doi: 10.1002/1097-0282(2001)60:5<366::AID-BIP10177>3.0.CO;2-5. [DOI] [PubMed] [Google Scholar]
- 27.Topilina NI, Ermolenkov VV, Sikirzhytski V, Higashiya S, Lednev IK, Welch JT. Biopolymers. 2010;93:607. doi: 10.1002/bip.21412. [DOI] [PubMed] [Google Scholar]
- 28.Xiong K, Asciutto EK, Madura JD, Asher SA. Biochemistry. 2009;48:10818. doi: 10.1021/bi9014709. [DOI] [PMC free article] [PubMed] [Google Scholar]
- 29.Asher SA, Chi Z, Li P. J Raman Spectrosc. 1998;29:927. [Google Scholar]
- 30.Asher SA, Ludwig M, Johnson CR. J Am Chem Soc. 1986;108:3186. [Google Scholar]
- 31.Chen XG, Asher SA, Schweitzer-Stenner R, Mirkin NG, Krimm S. J Am Chem Soc. 1995;117:2884. [Google Scholar]
- 32.Chen XG, Li P, Holtz JSW, Chi Z, Pajcini V, Asher SA, Kelly LA. J Am Chem Soc. 1996;118:9716. [Google Scholar]
- 33.Chen XG, Schweitzer-Stenner R, Krimm S, Mirkin NG, Asher SA. J Am Chem Soc. 1994;116:11141. [Google Scholar]
- 34.Cho N, Asher SA. Biospectroscopy. 1996;2:71. [Google Scholar]
- 35.DeVito VL, Cai MZ, Asher SA, Kehres LA, Smith KM. J Phys Chem. 1992;96:6917. [Google Scholar]
- 36.Harmon PA, Asher SA. J Chem Phys. 1990;93:3094. [Google Scholar]
- 37.Sweeney JA, Asher SA. J Phys Chem. 1990;94:4784. [Google Scholar]
- 38.Balakrishnan G, Weeks CL, Ibrahim M, Soldatova AV, Spiro TG. Curr Opin Struct Biol. 2008;18:623. doi: 10.1016/j.sbi.2008.06.001. [DOI] [PMC free article] [PubMed] [Google Scholar]
- 39.Bykov S, Lednev I, Ianoul A, Mikhonin A, Munro C, Asher SA. Appl Spectrosc. 2005;59:1541. doi: 10.1366/000370205775142511. [DOI] [PubMed] [Google Scholar]
- 40.Sension RJ, Hudson B, Callis PR. J Phys Chem. 1990;94:4015. [Google Scholar]
- 41.Garfinkel D. J Am Chem Soc. 1958;80:3827. [Google Scholar]
- 42.Hernandez B, Pfluger F, Derbel N, De Coninck J, Ghomi M. J Phys Chem B. 2010;114:1077. doi: 10.1021/jp909517r. [DOI] [PubMed] [Google Scholar]
- 43.Hildebrandt P, Czernuszewicz RS, Grygon CA, Spiro TG. J Raman Spectrosc. 1989;20:645. [Google Scholar]
- 44.Kalaiselvi D, Kumar RM, Jayavel R. Cryst Res Technol. 2008;43:851. doi: 10.1107/S160053680802196X. [DOI] [PMC free article] [PubMed] [Google Scholar]
- 45.Lima RJC, Freire PTC, Sasaki JM, Melo FEA, Mendes Filho J. J Raman Spectrosc. 2002;33:625. [Google Scholar]
- 46.Ludwig M, Asher SA. Appl Spectrosc. 1988;42:1458. [Google Scholar]
- 47.Shriver DF, Dunn JBR. Appl Spectrosc. 1974;28:319. [Google Scholar]
- 48.Hong Z, Wert J, Asher SA. in preparation. [Google Scholar]
- 49.Long DA. The Raman Effect: A Unified Treatment of the Theory of Raman Scattering by Molecules. New York: John Wiley & Sons; 2001. [Google Scholar]