Abstract
Time of Flight (TOF) PET has great potential in whole-body oncological applications and recent work has demonstrated qualitatively in patient studies the improvement that can be achieved in lesion visibility. The aim of this work was to objectively quantify the improvement in lesion detectability that can be achieved in pulmonary and hepatic lesions with whole body FDG TOF-PET in a cohort of 100 patients as a function of patient body mass index (BMI), lesion location and contrast, and scanning time.
Methods
100 patients with BMIs ranging from 16 to 45 were included in this study. Artificial 1-cm spherical lesions were imaged separately in air at variable locations of each patient’s lung and liver, appropriately attenuated and incorporated in the patient listmode data with four different lesion-to-background contrast ranges. The fused studies with artificial lesion present or absent were reconstructed using a listmode, un-relaxed OSEM with chronologically ordered subsets and a Gaussian TOF kernel for TOF reconstruction. Conditions were compared on the basis of performance of a 3-channel Hotelling observer (CHO-SNR) in detecting the presence of a sphere of unknown size on an anatomic background while modeling observer noise.
Results
TOF-PET yielded an improvement in lesion detection performance (ratio of CHO-SNR) over non-TOF PET of 8.3% in the liver and 15.1% in the lungs. The improvement in all lesions was 20.3, 12.0, 9.2 and 7.5% for mean contrast values of 2.0:1, 3.2:1, 4.4:1, and 5.7:1, respectively. Furthermore, this improvement was 9.8% in patients with BMI<30 and 11.1% in patients with BMI>30. Performance plateaued faster as a function of number of iterations with TOF than non-TOF.
Conclusion
TOF-PET yielded a significant improvement in lesion detection in oncologic studies over all contrasts and BMIs that was greater for lower lesion contrast. This improvement was achieved without compromising other aspects of PET imaging.
Keywords: WB-18FDG, TOF-PET, lesion detection
INTRODUCTION
Time of Flight (TOF) PET has great potential to improve image quality in whole-body oncological applications (e.g., (1–6)) and recent work by Karp et. al. (7) has reported faster and more uniform convergence of lesion contrast and demonstrated qualitatively in phantoms and patient studies the improvement that can be achieved improved subjective lesion. Recent work by Kadrmas et. al. on lesion detection performance in a physical phantom reported also improvement in detection performance with TOF-PET (8). However, there has been little work reported on the objective assessment of the benefits of TOF-PET for lesion detection tasks in clinical whole-body 18FDG oncological studies partly due to the absence of a gold standard in patient studies and to the difficulty of performing such a study with a large enough number of patients to ensure sufficient statistical power. Therefore, the aim of this work is to quantify the improvement of detectability of pulmonary and hepatic lesions that can be achieved with TOF-PET in whole body 18FDG studies using an approach previously developed in our laboratory that allows to incorporate realistic lesions within lesion-absent whole-body 18FDG studies (9).
Actual whole body patient data, rather than phantom data, were used in order to encompass a large range of realistic sizes, and therefore activity and attenuation distributions. Our hypothesis was that the gain in performance of TOF imaging depends on patient size, count statistics, complex noise structure and lesion contrast. Since these characteristics are impossible to perfectly reproduce in phantom studies, we use patient data with synthetic lesions in order to capture the physiological variability of 18FDG uptake in the torso and abdomen.
MATERIALS AND METHODS
Patient Studies
One hundred patient studies were selected for this investigation. Each patient was scanned under the standard imaging protocol at the University of Pennsylvania Medical Center which consisted of injecting 555 MBq of 18FDG and starting the scan after 1 hour uptake. The PET data were acquired in list mode format with 3 minutes scan time per bed position, which provided the flexibility to reconstruct images for 1 min bed time as well as 3 minutes. A complete patient study typically involves 8–10 overlapping bed positions. In this study, for each patient we selected a single bed position that was determined by experienced nuclear medicine physicians to have normal FDG uptake in the torso region (including lungs and liver).
The Body Mass Index (BMI= weight (kg) / height2(m2)) as defined by the National Institutes of Health publication No. 04-5283 and 98-4083 (10) was used to quantify patient size. In our population, BMI ranged from 16 to 45.4, distributed as follows: 41 bed positions were associated with patients with normal BMI (BMI < 24.9), 28 bed positions with overweight patients (25 < BMI < 29.9), 27 bed positions with obese patients (30 < BMI < 39.9), and 5 bed positions with extremely obese patients (BMI > 40).
Scanner and Image Reconstruction
All data acquisitions and patient studies were performed on the Gemini TF PET/CT (Philips Medical Systems, Highland Heights, OH) at the University of Pennsylvania. The Gemini TF is a time-of-flight (TOF) capable, fully-3D PET scanner together with a 16-slice Brilliance CT scanner (11). The PET patient bore has a diameter of 71.70-cm with active transverse and axial FOVs of 57.6 and 17.98-cm, respectively. The reconstructed spatial resolution is 4.8 mm (center of FOV) and the system energy resolution (fwhm) for the Gemini TF scanner is 11.5% at 511 keV, which allows the default energy window to be set at 440–665 keV. The system timing resolution for this scanner measured with a low activity source is 585 ps (FWHM), although the clinical data presented here were acquired with system timing resolution of 670 ps due to effects of higher count-rates.
Image reconstruction was performed using a blob-based, list-mode iterative algorithm with and without TOF information (12). In this work the data were arranged in 33 geometrically ordered sub-sets and an un-relaxed (λ=1) OSEM update equation was used for reconstruction. Attenuation correction was performed using the CT transmission data, while scatter was estimated using a recently developed TOF version of model-based single scatter simulation (SSS) that generates a distribution of scatter both in the radial and time bins (13). Delayed coincidence window technique was used to estimate the random coincidences in the collected data. No post-reconstruction smoothing filter was used (the reconstruction is blob-based). The image matrix size was 576×576×180-mm3 and the voxel size was 4×4×4-mm3.
Lesion-Present Image Generation
In order to create “lesion-present” clinical studies while ensuring perfect knowledge of the presence and location of each lesion (gold standard), 10-mm spherical lesions were added to disease-free bed positions, yielding fused “lesion-present” studies. Numerical simulation of lesions may lead to errors due to an incomplete modeling of scanner components. Therefore, we used 10-mm plastic spheres that were filled with 5–50 MBq/ml of 18FDG, and acquired data for the spheres in air at specific locations within the scanner FOV that were chosen to overlap with regions within the lung and liver for each patient. The sphere data were acquired in list-mode over 1–5 minutes of scan time such that atleast 5M counts were collected at each sphere position. For each patient, ROIs were drawn in the liver and lung regions to measure the mean background count density (CB) in the fully-corrected reconstructed image. In order to add a lesion with an uptake ratio u to a patient we then use (u-1)*CB counts from a selected sphere data set (extracted sphere list file). Since the sphere data are collected in air they do not represent any attenuation effects, and so the extracted sphere list file is attenuated using the transmission map for the patient study. Finally this lesion list file is then randomly mixed on an event-by-event basis with the patient list file to form a “fused” list file representing a patient with a 10-mm lesion present in the lung or liver scanned for 3 minutes. The fused list file is then reconstructed using all corrections in the standard way for TOF and Non-TOF reconstruction algorithms, for both 1 and 3 minutes scan times. We assumed that scatter associated with the sphere acquired in air was negligible as compared to the scatter associated with the patient. Therefore, the scatter estimate used for the fused data sets is the same as the one generated for no lesion present patient data sets, and hence is done appropriately for all patient sizes. The lesion incorporation strategy can be explained as follows: the extracted sphere data with a fixed number of counts representing the lesion contrast were attenuated using the patient transmission map to generate the attenuated sphere data sets which is then added to the patient emission data to generate the fused data set with an artificial lesion.
In order to validate the realism of the lesion generation strategy in TOF and non-TOF-PET, a phantom study was undertaken. A cylindrical phantom (diameter = 20 cm) was filled with a solution of about 17 MBq/ml of 18FDG and a first acquisition performed for 10 minutes. Next, three 10-mm-diameter spheres were filled with a solution of 18FDG to achieve a sphere-to-background ratio of 2:1. The spheres were physically placed within the cylinder at 0°, 120° and 240°, and a second acquisition was performed under identical conditions to the first acquisition. Finally, the spheres were mounted on the positioning grid at a location that corresponded to their location inside the cylindrical phantom and acquired alone in air, and then added to the cylinder scan (fused lesion-present study) using the approach presented in this work. This allowed us to compare profiles as well as noise and sphere-to-background contrast ratios in TOF and non-TOF-PET
Lesion-present and lesion-absent conditions
One of the major benefits of using a mathematical observer is the capability of exploring a large number of conditions without being limited by the number of images that can be submitted to a human observer. In our study we considered 6 conditions: The first condition was TOF or non-TOF-PET; The second condition was BMI < 30 (73 subjects) or BMI ≥ 30 (27 subjects) which represent the range between the light-average and average-heavy patients respectively; The third condition was lesion location in the liver or the lungs which represent high and low 18F-FDG uptake backgrounds ; The fourth condition was lesion contrast and consisted of 4 contrast ranges for each lesion location: 6.5:1, 5.0:1, 3.5:1, and 2.0:1 in the liver, and 5.0:1, 4.0:1, 3.0:1, and 2.0:1 in the lung leading to mean contrast ranges over both lesion locations of 5.7:1, 4.4:1, 3.2:1, and 2.0:1; The fifth condition was the acquisition time of 3 min or 1 min which represent the upper and lower limits on clinical scan times per bed positions; The sixth condition was the number of iterations performed in the iterative reconstruction (1,2, 3, … 10). Therefore, the total number of lesion-present studies was : 2 (TOF) × 100 (BMI) × 2 (location) × 4 (contrast) × 2 (time) × 10 (iterations) = 32,000 studies. The total number of lesion-absent studies was : 2 (TOF) × 100 (BMI) × 2 (time) × 10 (iterations) = 4,000 studies. Therefore, the total number of studies considered was 36,000.
Channelized Hotelling Observer
Given the large number of studies considered in this work, we chose a numerical observer, as opposed to a human observer to assess lesion detection SNR. The acquisition and processing schemes were assessed on the basis of performance of a model observer in detecting the presence of a spherical lesion of unknown size on an anatomic background. The model observer was a 3D three-channel Hotelling observer (CHO) (14), by which the 15×15×5 pixel sub-image data were processed through the frequency channels that are believed to exist in the human visual system. The 15×15×5 volume contained the lesion location at the center of the image (only one lesion was present in any volume). The CHO-SNR is given by:
| (Eq. 1) |
where, Δf is the mean inter-class channel output difference vector, and S2 is the intraclass scatter matrix, calculated from the (channelized) covariance matrices M1 and M2 of the two classes (lesion-present and lesion-absent) being discriminated by . We used a three-channel difference-of-Gaussians Hotelling observer (14) with (radially symmetric) channel profiles C0, C1, and C2 given by:
| (Eq. 2) |
where ρ is the spatial frequency, j =1,3 indexes the channels, σj = σ0 2j−1, and σ0 = 0.052. The parameters of this observer model are appropriate for a viewing distance of 60 cm and a displayed pixel size of 0.51 mm; the effect of the observer noise on task performance was incorporated by doubling the diagonal elements of the channel covariance matrix (14). The lesion detectability performance estimated with the CHO-SNR, dA, can be related to the corresponding area under the receiving operator characteristic curve (Az) by:
| (Eq. 3) |
where erf−1 is the inverse error function. The lesion-present in the lungs (resp liver) and background volumes were used to compute the 3D CHO-SNR for lesion detection in the lung (res liver), in each 15×15×5 sub-volume. The error bars were computed using propagation of errors on detectability as previously proposed by Abbey et. al. (15).
RESULTS
1. Validation of Image Generation
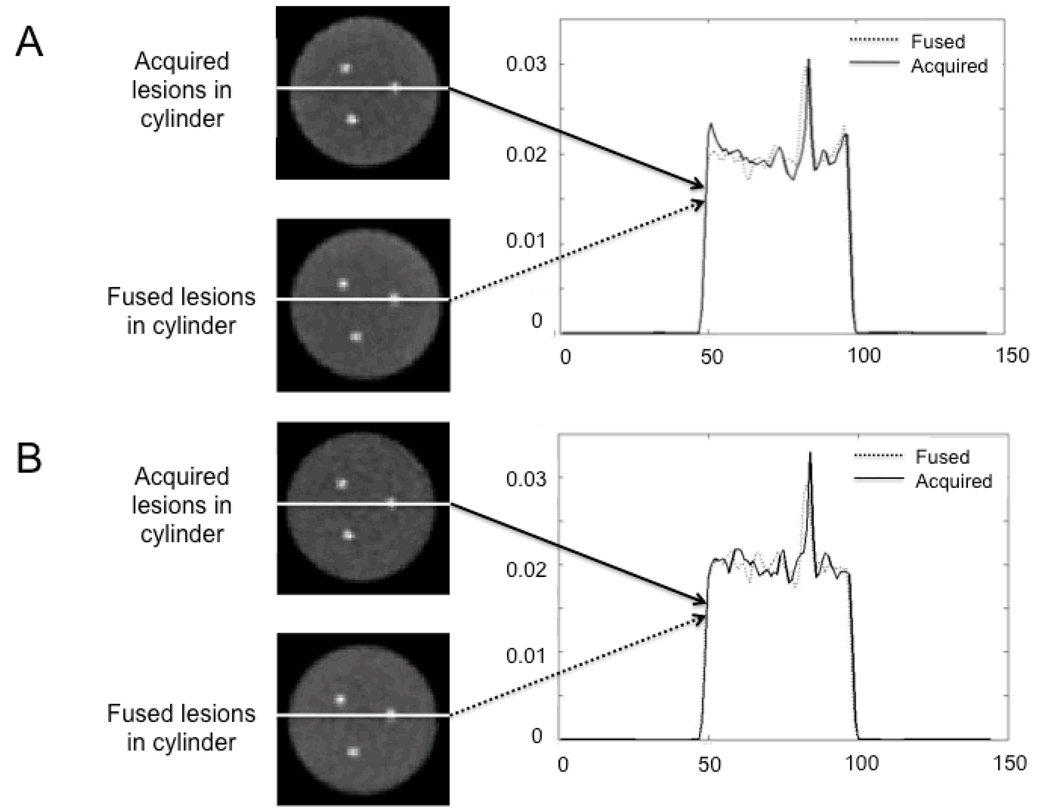
Figure 1 shows the results of the validation of generating lesion present studies in the cylindrical phantom. A selected slice containing all three spheres is shown for the three lesions acquired while physically inside the cylinder (lesions acquired in cylinder) on the top row and when adding them mathematically to the cylinder (fused lesions in cylinder) on the bottom row. Good agreement is observed between the two reconstructed slices both for TOF and non-TOF-PET. The corresponding profiles with the lesion physically present and mathematically added to the background are also in very good agreement with each other both for TOF and non-TOF-PET. The pixel noise in the background in the fused lesion present study was 6.2% in TOF-PET as compared to 6.1% in the physical lesion present TOF-PET. For non-TOF-PET, the pixel noise was 6.5% and 6.3%, respectively. The sphere-to-background contrast recovery coefficient was 25.0±2.6% in the fused lesion-present TOF study as compared to 22.5±1.6% in the physical lesion present study. These values were 24.0±1.8% and 24.9±1.5% for non-TOF-PET, respectively. As expected from previous studies for a 20-cm diameter cylinder, no significant gain in contrast recovery was observed with TOF imaging (7). Note that all sphere-to-background contrast ratios were consistent with the actual 2:1 ratio used when filling the phantom.
FIGURE 1.
Transverse slices of (A) TOF and (B) non-TOF-PET reconstructed images of the cylindrical phantom acquired with the spheres physically inside the cylinder, as well as with the sphere data added to the uniform cylinder without the sphere (fused data), along with the corresponding profiles through the acquired and added spheres.
2. Improvement of Lesion Detection With TOF PET
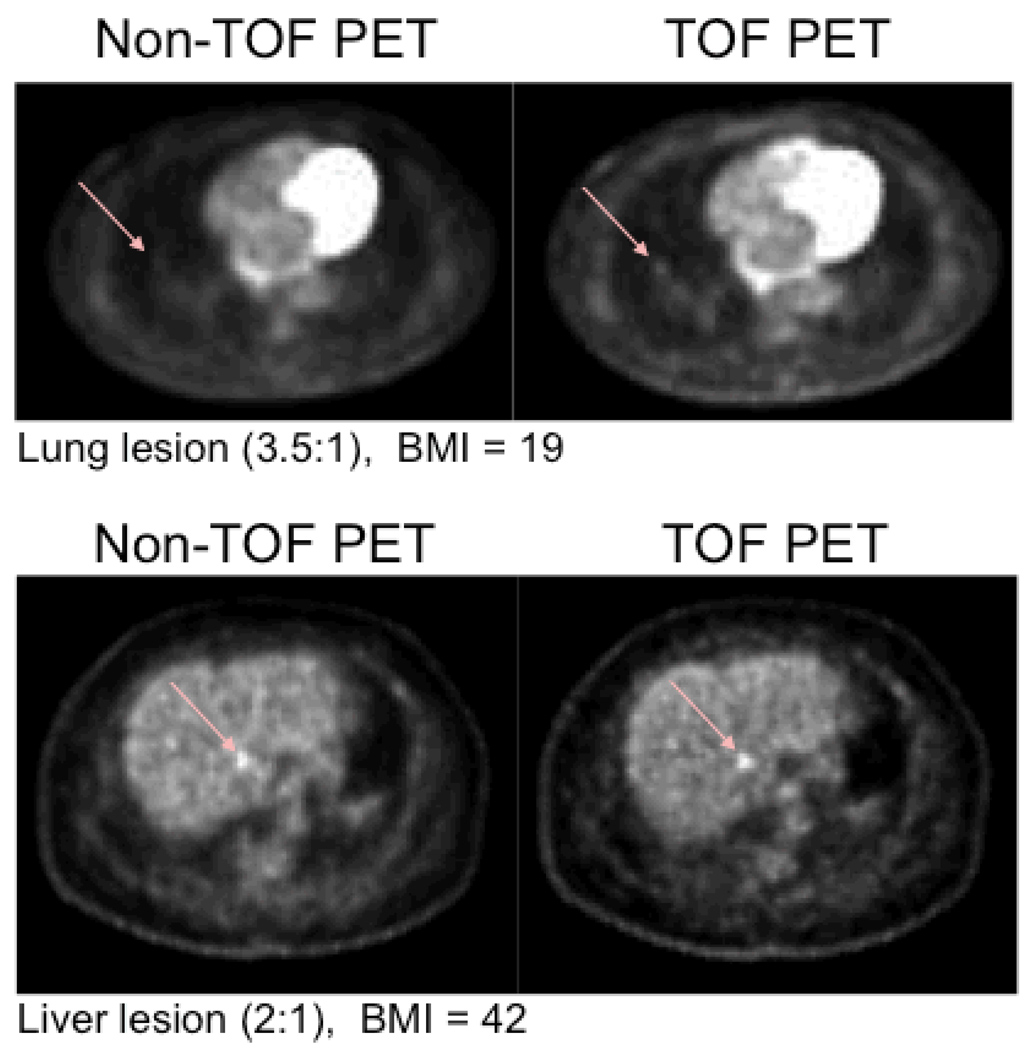
Figure 2 shows representative transverse slices of lung “lesion-present” (arrow) with a 3.5:1 contrast in a subject patient with normal BMI=19 (top row) and liver lesion (2:1) in a patient with a BMI=42 (bottom row). Qualitatively, the lung lesion is very hard to detect in the non-TOF-PET study while it is more easily discernable in the TOF-PET study. Although the hepatic lesion is detectable in both non-TOF and TOF-PET studies, the TOF-PET yielded greater lesion contrast and reduced background hepatic noise than non-TOF-PET.
FIGURE 2.
“Lesion present” (arrow) transverse slices with a 3.5:1 contrast in a subject patient with normal BMI=19 (top row) and liver lesion (2:1) in a patient with a BMI=42 (bottom row).
2.1. Lesion detection as a function of lesion location
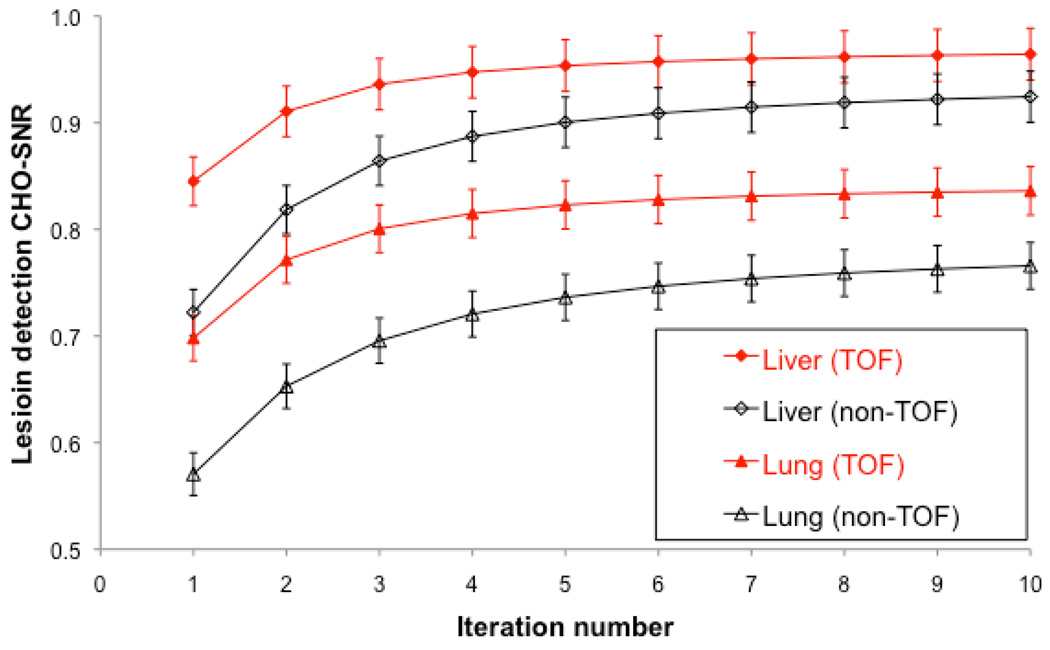
Figure 3 shows the performance in lesion detection for TOF-PET and non-TOF-PET as a function of iteration number in the hepatic and lung lesions. The results are averaged over all BMI, contrast levels, and scan times. TOF-PET performance converged faster (at earlier iteration number, e.g., iteration 4) than non-TOF (e.g., iteration 4) in the liver and especially the lung. Furthermore, lesion detection SNR was significantly higher for all iteration for TOF than for non-TOF, both in the lung (p<0.01) and liver (p<0.01). The ratio of hepatic lesion SNR with TOF as compared to non-TOF-PET varied from 17% in iteration 1 to 5% in iteration 10. The same ratio in lung lesions varied from 22% in iteration 1 to 9% in iteration 10.
FIGURE 3.
TOF and non-TOF-PET channelized Hotelling signal-to-noise ratio (CHO-SNR) computed for lung and liver lesions over all lesion contrasts and subject body mass index as a function of iteration number.
2.2. Lesion detection as a function of scan time
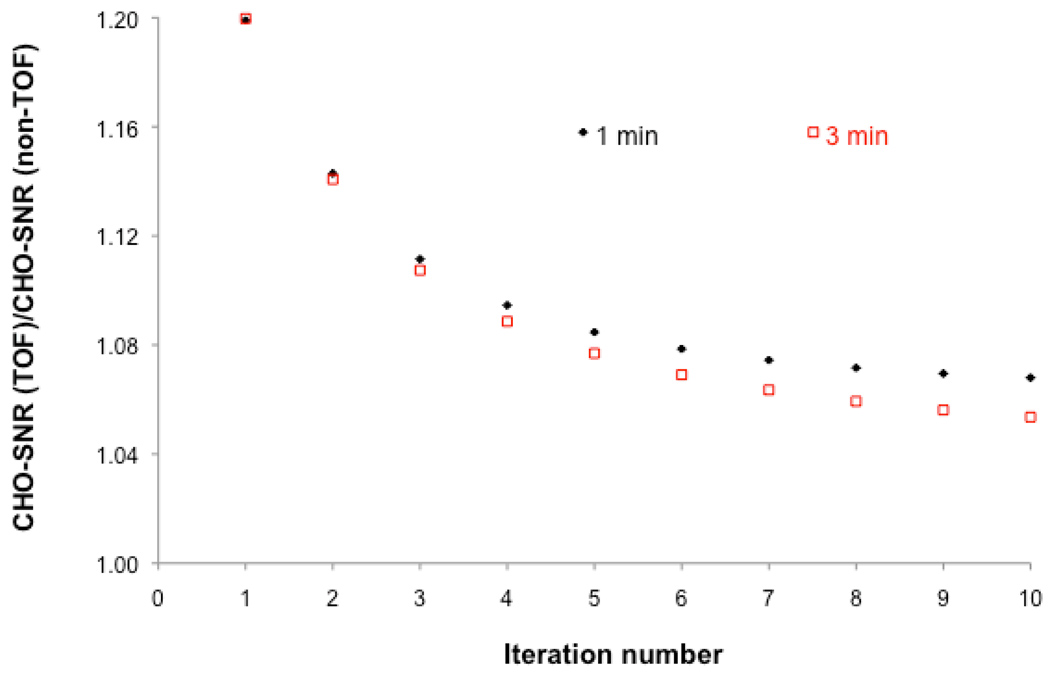
Figure 4 shows the improvement in lesion detection performance achieved with TOF as compared to non-TOF-PET for 3 and 1 min/bed scans as a function of iteration number. The results are averaged over all BMI, contrast levels, and lesion locations. The ratio of lesion detection SNR is always greater than one. As described above in Section B1, the greatest improvement in lesion detection with TOF as compared to non-TOF-PET was at low iteration numbers. Furthemore, the improvement in lesion detectability with TOF as compared to non-TOF-PET was greater for 1 min than for 3 min scans. This is consistent with the fact that greater gain in performance is achieved with TOF at low SNR.
FIGURE 4.
Ratio of TOF to non-TOF-PET channelized Hotelling signal-to-noise ratio [CHO-SNR (TOF) / CHO-SNR (non-TOF)] computed over all lesion locations, mean contrast values of 2.0:1, 3.2:1, and 4.4:1, and patient body mass index as a function of iteration number for 1 and 3min/bed acquisitions.
2.3. Lesion detection as a function of lesion contrast
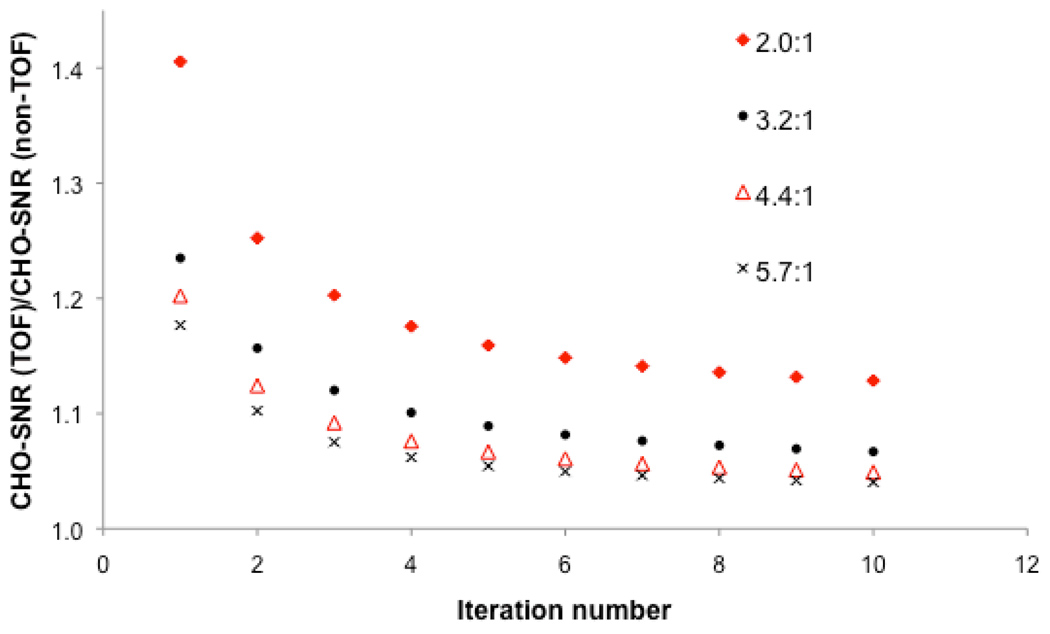
Figure 5 shows the gain in lesion detection performance with TOF as compared to non-TOF-PET as a function of lesion contrast and iteration number. The results are averaged over all BMI, scan times, and lesion locations. As expected lesion detectability was always better with TOF as compared to non-TOF (ratio always greater than 1). More interestingly, the greatest gain in performance was achieved at the lowest lesion contrast (i.e., 2.0:1) and the smallest gain in performance at the highest lesion contrast (i.e., 5.7:1).
FIGURE 5.
Ratio of TOF to non-TOF-PET channelized Hotelling signal-to-noise ratio [CHO-SNR (TOF) / CHO-SNR (non-TOF)] computed over all lesion locations and patient body mass index as a function of iteration number for different lesion to background contrasts.
2.4. Lesion detection as a function of BMI
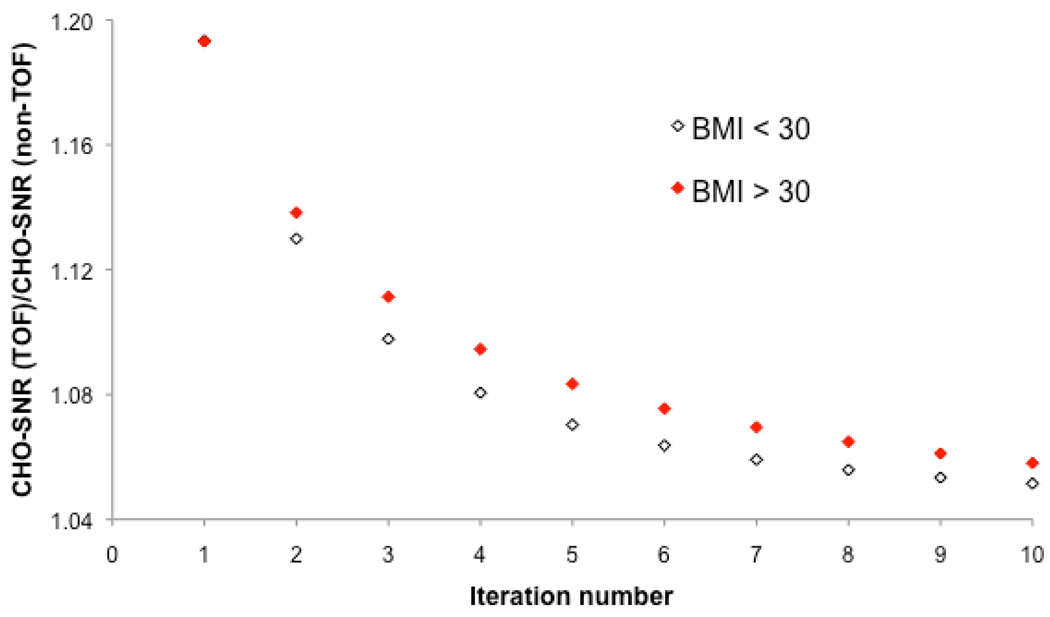
Figure 6 shows the gain in lesion detection performance with TOF as compared to non-TOF-PET as a function of patient BMI and iteration number. The results are averaged over all scan times and lesion contrasts and locations. Again, the greatest gain in performance is achieved for BMI>30, i.e., TOF yields the best improvement in large patients where lesion detection is the most challenging.
FIGURE 6.
Performance of TOF and non-TOF-PET for lesion detection as a function of patient BMI and iteration number. The results correspond to the Ratio of TOF to non-TOF-PET channelized Hotelling signal-to-noise ratio [CHO-SNR (TOF) / CHO-SNR (non-TOF)], and are averaged over all scan times and lesion contrasts and locations
2.5. Gain in lesion detection due to TOF PET
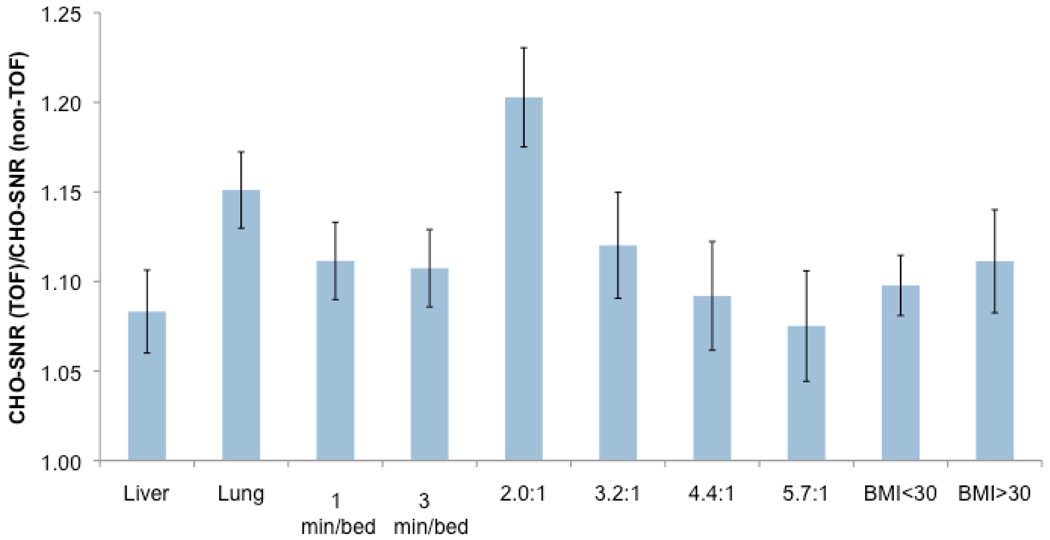
Figure 7 summarizes the gain in lesion detection performance as measured by the channelized Hotelling SNR, computed over lesion contrasts, subject BMI, and locations. All results are shown after three iterations of image reconstruction, which corresponds to the number of iterations used clinically with TOF-PET at our institution. There was a significant improvement in all lesions (over all BMIs, lesion locations, and scan times) of 20.3, 12.0, 9.2 and 7.5% for mean contrast of 2.0:1, 3.2:1, 4.4:1, and 5.7:1, respectively (p<0.01). When pooling all lesion contrasts, this improvement was also significant and was 8.3% in hepatic and 15.1% in lung tumors (p<0.01). Finally, the improvement in lesion SNR detectability was 9.8% in patients with BMI<30 and 11.1% in patients with BMI>30 (p<0.01).
FIGURE 7.
Ratio of TOF to non-TOF-PET channelized Hotelling CHO-SNR computed over lesion contrast and locations as well as body mass index for n=3 iterations.
DISCUSSION
We have determined the gain in performance that can be achieved when using time of flight PET in whole-body 18FDG PET using a task-based metric, i.e., lesion detection as measured by a channelized Hotelling observer. Our approach has the advantage of using clinically realistic images while knowing the truth with regard to lesion presence/absence. The realistic process of lesion incorporation into normal whole body TOF-PET 18FDG studies has yielded a valuable set of lesion-present and lesion absent studies in 100 patients (i.e., 36,000 studies). A subset of this dataset will be used in the future to confirm the results in a reduced number of conditions using human observers. Since the aim of this work was to assess lesion detection and not the determination of lesion shape or density, we considered a 1-cm spherical lesion model. This is a reasonable model for small metastatic lesions as seen routinely in lung and liver cancers. Larger lesion models would need to take into account possible necrosis that was not modeled in our study. We have validated in this work as well as in previous work (9) our methodology for lesion insertion in physical phantoms. Note, the use of the same scatter file for lesion and no lesion data is justified.
In contrast with previously published studies that reported comparison of TOF and non-TOF-PET in physical phantoms (e.g., (7, 8)), this study included a population of patients with a large range of BMI and lesion contrasts to make possible the assessment of performance of TOF-PET as a function of patient size, acquisition time, lesion location and contrast and reconstruction iteration number. Furthermore, the use of clinical data, in contrast with numerically simulated data, ensured that all physical factors, such as scatter, attenuation, randoms and deadtime, were correctly included for all body sizes and physiological activity distributions. This gives us confidence that conclusions drawn from the data can be extrapolated to the clinical setting after confirmation.
Our results show several interesting and important features: (i) As expected in clinical studies, the covariance in the images is dominated by variability in patient backgrounds, rather than statistical noise. Hence, the 3 min/bed position images show mildly improved performance compared with the 1 min/bed position images as the only difference between these studies is statistical noise (same background viability). (ii) Again as expected, the improvement in SNR of TOF over non-TOF is greatest for lower contrast lesions. High contrast lesions are more easily detectable, yielding little improvement by using TOF. (iii) Hepatic lesions showed higher detectability than pulmonary lesions, due to the higher number of counts in liver background compared to lung background, and therefore lower noise in the hepatic lesions compared to pulmonary lesions (e.g., a 4:1 hepatic lesion has higher counts than a 4:1 pulmonary lesion because of the higher background activity of liver compared with lung). In addition, lung lesions showed greater improvement in performance with TOF-PET than liver lesions, due to the lower overall detectability of lung lesions. (iv) TOF detectability† converges at an earlier iteration number than non-TOF detectability, and therefore produces high detection performance images at a lower noise level. (v) There is a greater improvement from non-TOF to TOF PET for high BMI patients, than for low BMI patients, suggesting that TOF PET is most beneficial for imaging larger patients.
Pooling hepatic and lung lesions in the results can lead to confusing comparisons. Lung lesions with the same contrast ratio as liver lesions necessarily have higher noise, due to the lower background counts in the lungs. Therefore, relative SNRs between the two populations are not easily comparable. Rather, we focussed on the performance improvement for a given lesion type (ratio of SNRs for TOF and non-TOF), and the relative performance improvement for different lesion types (comparison of ratios).
Our results are consistent with our previous work (7) where we reported faster and more uniform convergence of lesion contrast and demonstrated qualitatively in phantoms and patient studies the improvement that can be achieved improved subjective lesion. Furthermore, our results show that the greatest gains in image quality in terms of lesion detectability were achieved for the lowest lesion contrast of 2.0:1 (~20%) and in the largest subjects. This is a significant gain that can be crucial in marginally detectable tumors such as the lung lesion shown in Figure 2. Our results are also consistent with recent work on lesion detection performance in a physical phantoms that reported improvement in detection performance with TOF-PET (8). Furthermore, our results suggest that the gain achieved with TOF-PET can be used in several ways: one possibility is to take advantage of the gain achieved with TOF-PET in order to reduce scanning time therefore increasing patient comfort and minimizing patient motion. Another interesting strategy is to reduce the injected dose and therefore reduce patient and health professionals radiation exposure. The improvement in terms of lesion detection with TOF-PET as compared to non-TOF was achieved while keeping all acquisition parameters constant (e.g., injected dose, acquisition time, acquisition geometry, LLD and ULD thresholds).
The task considered in this work was lesion detection, measured by SNRCHO (14, 16, 17). Although lesion detection performance is best assessed using human observer studies (e.g., ROC (18), LROC (8, 18) or AFROC (19)), the numerical observer approach allows more rapid assessment of a large number of conditions (e.g., scanning time, lesion contrast, patient BMI, lesion location) that can result in a large number of images (e.g., 30,000) that make human observer studies impractical. Furthermore, the rank order assessing performance is usually preserved between the channelized observer and human observer studies. The next step of this research will consist in designing focused human observer study to confirm the main findings obtained with a channelized observer in the present work.
CONCLUSION
We have determined the improvement that can be achieved with TOF-PET over non-TOF-PET under identical realistic conditions in a cohort of 100 patients. TOF-PET yielded a significant improvement in lesion detection in oncologic studies over all contrasts and BMIs that was greater for lower lesion contrast. Furthermore, the greatest gains achieved with TOF-PET were obtained for the shortest acquisition studies (1min/bed) and in the largest subjects (BMI>30) confirming that TOF-PET could play a key role in detecting marginally detectable lesions without compromising other aspects of PET imaging.
ACKNOWLEDGMENTS
This work was supported in part by grant RO1-CA113941 (PI: Karp), R01-EB009056 (PI: Surti), R01- EB005876 (PI: El Fakhri) and R21-CA134812 (PI: El Fakhri) from the National Institutes of Health (NIH). The contents of this paper are solely the responsibility of the authors and do not represent the official views of the NIH.
REFERENCES
- 1.Budinger TF. Time-of-Flight Positron Emission Tomography: status relative to conventional PET. J Nucl Med. 1983;24:73–78. [PubMed] [Google Scholar]
- 2.Tomitani T. A deconvolution function for single photon emission computed tomography with constant attenuation. IEEE Trans Nucl Sci. 1986;33(1):505–510. [Google Scholar]
- 3.Conti M, Bendriem B, Casey M, et al. First experimental results of time-of-flight reconstruction on an LSO PET scanner. Phys Med Biol. 2005;50:4507–4526. doi: 10.1088/0031-9155/50/19/006. [DOI] [PubMed] [Google Scholar]
- 4.Surti S, Karp JS, Popescu LA, Daube-Witherspoon ME, Werner M. Investigation of time-of-flight benefit for fully 3-D PET. IEEE Trans Med Imag. 2006;25:529–538. doi: 10.1109/TMI.2006.871419. [DOI] [PubMed] [Google Scholar]
- 5.Surti S, Karp JS. Experimental evaluation of a simple lesion detection task with time-of-flight PET. Phys Med Biol. 2009;54:373–384. doi: 10.1088/0031-9155/54/2/013. [DOI] [PMC free article] [PubMed] [Google Scholar]
- 6.Lois C, Jakoby BW, Long MJ, et al. An Assessment of the Impact of Incorporating Time-of-Flight Information into Clinical PET/CT Imaging. J Nucl Med. 2010;51:237–245. doi: 10.2967/jnumed.109.068098. [DOI] [PMC free article] [PubMed] [Google Scholar]
- 7.Karp JS, Surti S, Daube-Witherspoon ME, Muehhlehner G. The benefit of time-of-flight in PET imaging: Experimental and clinical results. The Journal of Nuclear Medicine. 2008;49:462–470. doi: 10.2967/jnumed.107.044834. [DOI] [PMC free article] [PubMed] [Google Scholar]
- 8.Kadrmas DJ, Casey ME, Black NF, Hamill JJ, Panin VY, Conti M. Experimental Comparison of Lesion Detectability for Four Fully-3D PET Reconstruction Schemes. IEEE Trans Med Imaging. 2009;28:523–534. doi: 10.1109/TMI.2008.2006520. [DOI] [PMC free article] [PubMed] [Google Scholar]
- 9.El Fakhri G, Santos PA, Badawi RD, Holdsworth CH, Van den Abbeele AD, Kijewski MF. Impact of acquisition geometry, image processing, and patient size on lesion detection in whole-body FDG-PET. The Journal of Nuclear Medicine. 2007;48:1951–1960. doi: 10.2967/jnumed.108.007369. [DOI] [PubMed] [Google Scholar]
- 10.Health NIo. Clinical guidelines on the identification, evaluation, and tratment of overweight and obesity in adults: The evidence report. 1998 98-4083. [Google Scholar]
- 11.Surti S, Kuhn A, Werner ME, Perkins AE, Kolthammer J, Karp JS. Performance of Philips Gemini TF PET/CT scanner with special consideration for its time-of-flight imaging capabilities. The Journal of Nuclear Medicine. 2007;48:471–480. [PubMed] [Google Scholar]
- 12.Popescu LM. Iterative image reconstruction using geometrically ordered subsets with list-mode data. Paper presented at: IEEE Nuclear Science Symposium and Medical Imaging Conference; Rome, Italy. 2004. [Google Scholar]
- 13.Werner ME, Surti S, Karp JS. Implementation and evaluation of a 3D PET single scatter simulation with TOF modelling. Paper presented at: IEEE Nuclear Science and Medical Imaging Conference; San Diego, CA. 2006. [Google Scholar]
- 14.Abbey CK, Barrett HH. Human- and model-observer performance in ramp-spectrum noise; effects of regularization and object variability. J Opt Soc Am A. 2001;18(3):473–488. doi: 10.1364/josaa.18.000473. [DOI] [PMC free article] [PubMed] [Google Scholar]
- 15.Abbey CK, Barrett HH, Eckstein MP. Practical Issues and Methodology in Assessment of Image Quality Using Model Observers. SPIE. 1997;3032:182–194. [Google Scholar]
- 16.Fiete RD, Barrett HH, Smith WE, Myers KJ. Hotelling trace criterion and its correlation with human-observer performance. J Opt Soc Am A. 1987;4(5):945–953. doi: 10.1364/josaa.4.000945. [DOI] [PubMed] [Google Scholar]
- 17.Yao J, Barrett HH. Predicting human performance by a channelized Hotelling observer model. Proc SPIE. 1992;1768:161–168. [Google Scholar]
- 18.Farquhar TH, Llacer J, Hoh CK, et al. ROC and localization ROC analyses of lesion detection in whole-body FDG PET: effects of acquisition mode, attenuation correction and reconstruction algorithm. The Journal of Nuclear Medicine. 1999;40:2043–2052. [PubMed] [Google Scholar]
- 19.Lartizien C, Kinahan PE, Comtat C. A lesion detection observer study comparing 2-dimensional versus fully 3-dimensional whole-body PET imaging protocols. The Journal of Nuclear Medicine. 2004;45:714–723. [PubMed] [Google Scholar]


