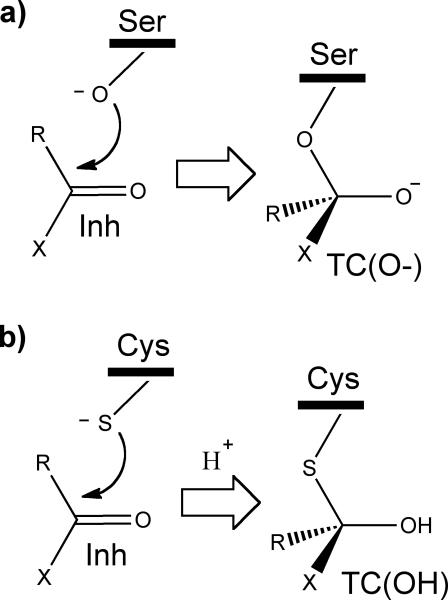
In the first catalytic step in serine proteases, the attacking Ser nucleophile forms an unstable covalent anionic tetrahedral complex, TC(O-), with the carbonyl group of the substrate (Fig. 1a).[1] In the case of reaction coordinate analog inhibitors (RCA)[2] the energy released in the formation of the new O—C covalent bond is sufficient for the thermodynamic stabilization of TC(O-) as the end products,[3] as for instance with α-ketoheterocycle inhibitors.[4] The catalytic mechanism of Cys proteases is still under debate.[5] The thiolate anion of Cys is much weaker nucleophile than the hydroxyl anion of Ser.[6] Therefore, the binding of RCA inhibitors in cysteine proteases may require further stabilization of TC, which could be realized by its protonation and the formation of a neutral TC(OH) (Fig. 1b).[5c, 7]
Figure 1.
The first catalytic step in proteases. a) Formation of an anionic TC(O-) with serine proteases, and b) formation of a neutral TC(OH) with cysteine proteases. X is the varied substituent modifying the electrophilicity of the carbonyl group.
A substrate or a RCA inhibitor is formally comprised of two parts: the chemical site, CS, responsible for the covalent binding, and the recognition site, RS, dominating selectivity of the ligand (substrate or inhibitor) towards the target enzyme. CS of RCA inhibitors can be rationally designed on special sets of isoselective inhibitors with constant RS and varied CS fragments.[8] In developing this approach we introduce now two types of QSAR descriptors W1 and W2. They quantitatively account for the energetic contribution from the enzyme nucleophile (Nuc)-inhibitor (Inh) covalent binding and reorganization of the covalent bonds of the CS fragments of inhibitors during formation of TC(O-) or TC(OH), respectively:
| (1) |
| (2) |
W1 and W2 are calculated as heats of formation, Hf, at 25 °C by PM6 semi-empirical QM Hamiltonian applying MOPAC2009[9] on small molecular clusters (see Supporting information, SI). According to Eqs 1 and 2, the difference W2 – W1 is a measure of the proton affinity, PA, or pKa of CS:
| (3) |
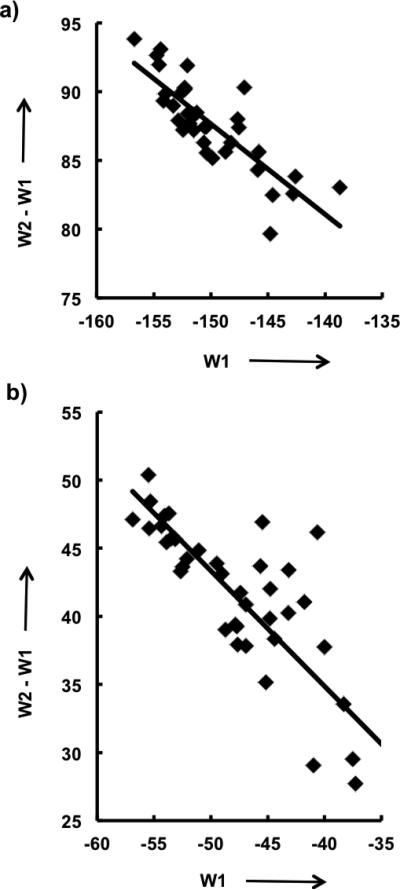
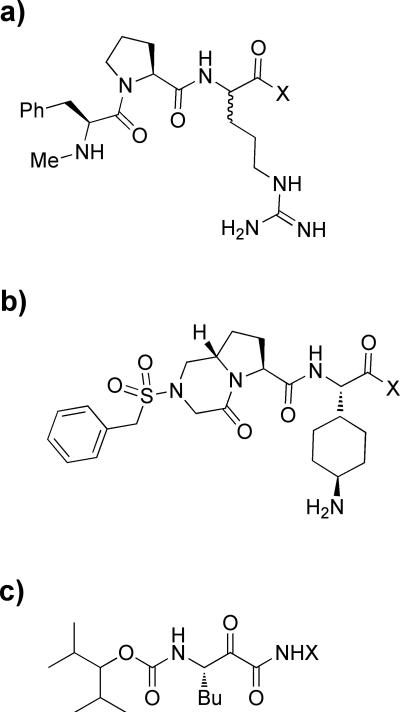
Here we analyze implication of W1 and W2 indices to the mechanism of serine and cysteine proteases, with direct consequence on different binding trends of RCA inhibitors to these enzyme families. The reaction core of CS of the considered RCA inhibitors is the carbonyl group C=O (Fig. 2). The varied substituent X in CS modulates with opposite effects the electrophilicity of the carbon atom, and PA/pKa of the carbonyl oxygen. This is clearly illustrated by the negative slope of the correlation trend of W2 – W1 (PA/pKa) vs. W1 (electrophilicity) for thrombin and cathepsin K inhibitors (Fig. 3).
Figure 2.
The RCA inhibitors with varied substituent X at the carbonyl group – the reaction core of the CS fragment. Serine protease thrombin inhibitors: a) 21 compounds in the training set (Table 5 in ref. 12), and b) 9 compounds 2b-f,h-k in the test set (Table 1 in ref. 13). c) Inhibitors of cathepsin K.[14] The full set of compounds in ref. 14 is split into 23 molecules for the training set: 13, 14, 18-20, 22, 24-32, 34-40, 42; and 7 compounds for the test set: 15, 16, 21, 23, 33, 41, 43.
Figure 3.

Variation of substituent X causes opposite trends in W2 – W1 (PA/pKa) vs. W1 (electrophilicity). a) Thrombin, b) Cathepsin K.
Our method accounts for both covalent interactions of CS in the enzyme active site by W1 and W2, and non-covalent CS interactions by conventional 2D non-covalent and topological descriptors implemented in most drug design software. The QSAR models were generated and optimized by Genetic Function Approximation (GFA),[10] implemented in Accelrys Discovery Studio (DS)[11] (See details in SI). GFA selects the most relevant indices dominating the inhibitors binding trend. Covalent indices W1 or W2 were identified by GFA as an obligatory part of the optimal QSAR model since the varied X substituent considerably modifies the electron distribution on the CS reactivity center.
The best QSAR model of the serine protease thrombin, identified by GFA on 21 inhibitors in the training set (Fig. 2a)[12] and 9 inhibitors in the test set (Fig. 2b),[13] contains W1 and W2 in combination with conventional 2D descriptors (Fig. 4a and Table S1 in SI). Ser hydroxyl forms a thermodynamically stable TC(O-) with RCA's. W1 accounts for the modulation of electrophilicity of the carbonyl group by the varied X. A linear combination of W1 and W2 indices, (1-λ)W1 + λW2, where 0 ≤ λ ≤ 1, corresponds to the stabilization of TC(O-) in the active site of serine proteases by hydrogen bonds in the oxyanion hole. Sequential exclusion of W1 and W2 indices from the QSAR model (Fig. 4 and Table S1) demonstrates that for a strong nucleophile – Ser hydroxyl anion, W1 accounting for the modulation of electrophilicity dominates the inhibitors binding trend. Contribution of H-bonds in the oxyanion hole to the TC(O-) stabilization is much smaller than the energy released in the enzyme-inhibitor covalent bond formation. Thus, in serine proteases W2 plays a minor role in comparison with W1, so W2 can be considered as a non-covalent descriptor slightly improving the prediction (Fig. 4a vs. 4c and Table S1).
Figure 4.

Correlations of experimental and calculated pKi's in QSAR models for thrombin, generated on the training set (empty circles and solid line) and examined on the test set (filled circles and dashed line) of varied CS's. a) W1, W2 and 2D descriptors (generated with the eq. pKicalc = -41.9167+ 0.3181* ALogP + 0.6647* Molecular Solubility + 23.6342* Molecular Fractional Polar SASA -19.2693 * Molecular Fractional Polar Surface Area - 0.2777* W1 - 0.1486*W2; see Table S1 in Supporting Information); b) W2 and 2D descriptors; c) W1 and 2D descriptors; d) W1 only; e) 2D descriptors only. Equation of correlation for the training set is located at the upper left corner of the graph, and that of the test set is at the lower right corner.
In sharp contrast, the W1 index was not identified by the GFA in the cysteine protease. W2 plays an exclusive role in the QSAR model of the cathepsin K series of inhibitors (Fig. 5 and Table S4),[14] divided into 23 molecules for a training set and 7 for a test set (Fig. 2c). We previously observed a similar effect for the human rhinoviral 3C cysteine protease.[8b] Why is the W1 index irrelevant for cysteine proteases or, in other words, why a cysteine nucleophile cannot stabilize the anionic TC(O-) in contrast to a serine nucleophile?
Figure 5.

Correlations of experimental and calculated pIC50's in QSAR models for cathepsin K, generated on the training set (empty circles and solid line) and examined on the test set (filled cirles and dashed line) of varied CS's. a) W2 and 2D descriptors (generated with the eq. pIC50calc = 10.882 − 0.54604 * Num H Acceptors + 0.44135 * W2 − 0.24293 * Num H Donors*W2; see Table S4 in Supporting Information); b) W2 only; c) 2D descriptors only. Equation of correlation for the training set is located at the upper left corner of the graph, and that of the test set is at the lower right corner.
By definition, the W2 index accounts for two energetic effects – formation of the enzyme-inhibitor covalent bond and PA/pKa of TC(OH). We demonstrated previously that the reduced ability of a thiolate anion to stabilize anionic TC(O-) in comparison with hydroxide is due to the larger extent of electron back-donation directed from the electrophile's (carbonyl group) HOMOA to the nucleophile's LUMOD.[6a] Therefore, the energy of the enzyme-inhibitor covalent bond plays a minor role in the inhibitors binding trend and the W1 descriptor is absent in QSAR models for a cysteine protease. Another important observation differentiating serine and cysteine proteases is the opposite signs of the linear regression coefficients for W1 in serine, and W2 in cysteine proteases in the QSAR models (Table S4). Comparing this observation with the graphs in Figure 3, it is obvious that in cysteine protease the effect of X variation on the pKa of TC(OH) dominates the RCA inhibitors binding trend. This stems from redistribution of electron density between atomic orbitals of the reactivity centers in the formed tetrahedral complex.[6a,15] The absolute atomic electronegativity of sulfur is slightly lower than that of carbon (6.22 vs. 6.27, respectively), in contrast to the highly electronegative oxygen (7.54).[16] Therefore, the electron density redistribution between the S and C reactivity centers in the formed TC(OH) should be either negligible or directed from sulfur to carbon, depending on the valent surrounding (X substituent) of the electrophilic center. In the O and C pair in TC(O-), the electronic flow is directed towards the oxygen atom. We previously demonstrated by ab initio QM calculations that indeed the summarized charge transfer to the carbonyl fragment is considerably larger for HS- than for HO- nucleophile.[6a]
We have applied QSAR analysis as a mechanistic tool to support the suggestion that the covalent tetrahedral complex in cysteine proteases has a neutral form TC(OH),[5c, 7] in contrast to the anionic TC(O-) in serine proteases. We explained why the varied substituent X at the carbonyl group in CS has different influence on the binding trend of RCA inhibitors of serine and cysteine proteases. Detailed mechanistic analysis of the physical nature of the W1 and W2 indices validates their use for rational design of chemical sites of RCA inhibitors for proteases. Validation of the relevance of the generated QSAR models is presented in the Supporting Information.
Acknowledgement
We thank Prof. Hanoch Senderowitz from Bar Ilan University for fruitful discussions.
Footnotes
This research was supported by NIH grant GM081329.
QSAR - a mechanistic tool for proteases. New covalent QSAR descriptors W1 and W2 for enzyme inhibition serve as a mechanistic tool in the study of Ser and Cys proteases, providing support to an ionic tetrahedral complex for the former and a neutral (protonated) tetrahedral complex for the latter.
References
- 1.Hedstrom L. Chem. Rev. 2002;102:4501. doi: 10.1021/cr000033x. [DOI] [PubMed] [Google Scholar]
- 2.Christianson DW, Lipscomb WN. J. Am. Chem. Soc. 1988;110:5560. doi: 10.1021/ja00263a052. [DOI] [PubMed] [Google Scholar]
- 3.a Shokhen M, Arad D. J. Mol. Model. 1996;2:390. [Google Scholar]; b Shokhen M, Albeck A. Proteins. 2000;40:154. doi: 10.1002/(sici)1097-0134(20000701)40:1<154::aid-prot170>3.0.co;2-v. [DOI] [PubMed] [Google Scholar]
- 4.Maryanoff BE, Costanzo MJ. Bioorg. Med. Chem. 2008;16:1562. doi: 10.1016/j.bmc.2007.11.015. [DOI] [PubMed] [Google Scholar]
- 5.a Otto H-H, Schirmeister T. Chem. Rev. 1997;97:133. doi: 10.1021/cr950025u. [DOI] [PubMed] [Google Scholar]; b Shokhen M, Khazanov N, Albeck A. Proteins. 2009;77:916. doi: 10.1002/prot.22516. [DOI] [PMC free article] [PubMed] [Google Scholar]; c Shokhen M, Khazanov N, Albeck A. Proteins. 2011;79:975–985. doi: 10.1002/prot.22939. [DOI] [PubMed] [Google Scholar]
- 6.a Shokhen M, Arad D. J. Mol. Model. 1996;2:399. [Google Scholar]; b Howard E, Kollman PF. J. Am. Chem. Soc. 1988;110:7195. [Google Scholar]
- 7.Frankfater A, Kuppy T. Biochemistry. 1981;20:5517. doi: 10.1021/bi00522a026. [DOI] [PubMed] [Google Scholar]
- 8.a Ozeri R, Khazanov N, Perlman N, Shokhen M, Albeck A. ChemMedChem. 2006;1:631. doi: 10.1002/cmdc.200600029. [DOI] [PubMed] [Google Scholar]; b Shokhen M, Khazanov N, Albeck A. ChemMedChem. 2006;1:639. doi: 10.1002/cmdc.200600030. [DOI] [PubMed] [Google Scholar]
- 9.Stewart JJP. MOPAC2009, Stewart Computational Chemistry. Colorado Springs, CO, USA: 2008. HTTP://OpenMOPAC.net. [Google Scholar]
- 10.Rogers D, Hopfinger AJ. J. Chem. Inf. Comput. Sci. 1994;34:854. doi: 10.1021/ci00020a041. [DOI] [PubMed] [Google Scholar]
- 11.Discovery Studio Modeling Environment, Release 2.5. Accelrys Software Inc.; San Diego: 2009. [Google Scholar]
- 12.Costanzo MJ, Almond HR, Jr., Hecker LR, Schott MR, Yabut SC, Zhang HC, Andrade-Gordon P, Corcoran TW, Giardino EC, Kauffman JA, Lewis JM, de Garavilla L, Haertlein BJ, Maryanoff BE. J. Med. Chem. 2005;48:1984. doi: 10.1021/jm0303857. [DOI] [PubMed] [Google Scholar]
- 13.Bachand B, Tarazi M, St-Denis Y, Edmunds JJ, Winocour PD, Leblond L, Siddiqui MA. Bioorg. Med. Chem. Lett. 2001;11:287. doi: 10.1016/s0960-894x(00)00636-3. [DOI] [PubMed] [Google Scholar]
- 14.Tavares FX, Boncek V, Deaton DN, Hassell AM, Long ST, Miller AB, Payne AA, Miller LR, Shewchuk LM, Wells-Knecht K, Willard DH, Jr., Wright LL, Zhou H-Q. J. Med. Chem. 2004;47:588. doi: 10.1021/jm030373l. [DOI] [PubMed] [Google Scholar]
- 15.a Parr RG, Donnelly RA, Palke WE. J. Chem. Phys. 1978;68:3801. [Google Scholar]; b Donnelly RA, Parr RG. J. Chem. Phys. 1978;69:4431. [Google Scholar]; c Liu G-H, Parr RG. J. Am. Chem. Soc. 1995;117:3179. [Google Scholar]
- 16.Pearson RG. Inorg. Chem. 1988;27:734. [Google Scholar]


