

Abstract
We previously demonstrated a correlation between the frequency of CX3CR1-expressing human natural killer (NK) cells and disease activity in multiple sclerosis and showed that CX3CR1high NK cells were more cytotoxic than their CX3CR1neg/low counterparts. Here we aimed to determine whether human NK cell fractions defined by CX3CR1 represent distinct subtypes. Phenotypic and functional NK cell analyses revealed that, distinct from CX3CR1high, CX3CR1neg/low NK cells expressed high amounts of type 2 cytokines, proliferated robustly in response to interleukin-2 and promoted a strong up-regulation of the key co-stimulatory molecule CD40 on monocytes. Co-expression analyses of CX3CR1 and CD56 demonstrated the existence of different NK cell fractions based on the surface expression of these two surface markers, the CX3CR1neg CD56bright, CX3CR1neg CD56dim and CX3CR1high CD56dim fractions. Additional investigations on the expression of NK cell receptors (KIR, NKG2A, NKp30 and NKp46) and the maturation markers CD27, CD62L and CD57 indicated that CX3CR1 expression of CD56dim discriminated between an intermediary CX3CR1neg CD56dim and fully mature CX3CR1high CD56dim NK cell fractions. Hence, CX3CR1 emerges as an additional differentiation marker that may link NK cell maturation with the ability to migrate to different organs including the central nervous system.
Keywords: chemokines, CX3CR1, natural killer cell maturation, natural killer cell phenotypes, natural killer cells
Introduction
The chemokine receptor CX3CR1 is the only member of the CX3C subfamily.1 Its exclusive ligand fractalkine (CX3CL1) exists as a transmembrane glycoprotein as well as in soluble form. CX3CR1 is expressed on monocytes, dendritic cells, natural killer (NK) cells, as well as cytotoxic and also activated helper T cells, preferentially on T helper type 1 (Th1) -like cells, but not on B cells.2–4 CX3CL1 and its receptor are implicated in several human pathological conditions including atherosclerosis,5–7 age-related macular degeneration,8,9 allograft rejection,10,11 rheumatic diseases12,13 and cytomegalovirus-related vascular endothelial damage.14 In rodent models of brain pathologies, the CX3CR1/CX3CL1 axis has been related to both pathological leucocyte migration into the central nervous system (CNS)15,16 as well as neuroprotective mechanisms.17,18 In experimental autoimmune encephalomyelitis, a mouse model of multiple sclerosis, CX3CL1/CX3CR1 interactions govern the selective recruitment of potential protective NK cells into the brain.19 Multiple sclerosis is an inflammatory demyelinating disease of the CNS with an unclear pathogenesis.20 A hallmark of the disease is the abundant infiltration of leucocytes into the CNS, which leads to demyelination as well as axonal and neuronal damage.21 The role of NK cells in multiple sclerosis development is not established. However, it has become evident that, apart from their potential contribution to tissue injury, NK cells may be involved in the regulation of the autoimmune attack,22,23 as suggested by the findings of Huang et al. 19 In line with these findings,19 we correlated the frequency of circulating CX3CR1-positive NK cells with disease activity in patients with multiple sclerosis.24 We also reported that NK cells with a high expression of CX3CR1 were more cytotoxic than NK cells showing a negative/low receptor expression,24 indicating that CX3CR1 expression may dissect functionally different NK cell subsets. To investigate this and further contribute to the elucidation of the role of NK cells and CX3CR1 in neuroinflammation, we determined the phenotypic and functional characteristics of CX3CR1neg/low and CX3CR1high expressing NK cells.
Material and methods
Culture medium and reagents
Cells were cultured in serum-free AIM-V medium (Gibco-Invitrogen, Karlsruhe, Germany), complete medium (RPMI-1640 supplemented with 2 mm l-glutamine, 100 U/ml penicillin, 100 μg/ml streptomycin, 10% fetal calf serum, and 1% HEPES) or AB medium [RPMI-1460 supplemented with 2 mm l-glutamine, 100 U/ml penicillin, 100 μg/ml streptomycin, 5% AB serum (Lonza, Walkersville, MD), and 0·5% Ciprobay (Bayer Vital GmbH, Leverkusen, Germany)]. Interleukin-2 (IL-2) was purchased from Hoffmann-La Roche (Basel, Switzerland); IL-12 and transforming growth factor-β1 (TGF-β1; from R&D, Minneapolis, MN); IL-15 and Fractalkine from PreproTech (Rocky Hill, NJ); IL-21 from Biosource (Camarillo, CA) and IL-18 as well as anti-human CX3CR1 (phycoerythrin-labelled) from MBL (Nagoya, Japan). Rat serum was purchased from DakoCytomation (Hamburg, Germany) and human Fc fragment was purchased from Calbiochem (Merck Chemicals Ltd., Darmstadt, Germany). The antibody mix containing anti-CD3 fluorescein isothiocyanate (FITC)/anti-CD16CD56 phycoerythrin (PE), the anti-human antibodies CD3 peridinin chlorophyll protein (PerCP), CD4 PerCP, CD16 FITC/Pacific Blue, CD25 allophycocyanin (APC), CD14 APC, CD40 FITC and HLA-DR FITC, CD62L APC, the isotype control IgG2b PE and streptavidin APC were purchased from Becton-Dickinson (Heidelberg, Germany). Biotin anti-human CD11c, CD86 PE, CD56 FITC and biotin CD27 were purchased from eBioscience (San Diego, CA). The APC-labelled anti-human CD57, KIR2DL1/2DS1, KIR3DL1/3DL2, NKp30 and NKp46 were purchased from Miltenyi Biotech (Bergisch-Gladbach, Germany). The antibody against human KIR3DL1/3DS1 was purchased from Beckman Coulter GmbH (Krefeld, Germany) and anti-human KIRDL2/2DS2/2DL3 and NKG2A were from R&D.
Isolation of PBMCs and preparation of NK cells and monocytes
Peripheral blood mononuclear cells (PBMCs) were isolated from buffy coats by density gradient centrifugation (Percoll, Nycomed Pharma, Roskilde, Denmark) according to the manufacturer's instructions. The NK cells were negatively sorted from freshly isolated PBMCs using the NK isolation kit (Miltenyi Biotech). Monocytes were positively sorted from freshly isolated PBMCs using CD14 MicroBeads (Miltenyi Biotech) according to the manufacturer's instructions. The purity of enriched NK cells and monocytes was confirmed using flow cytometric analysis and was always > 90%.
Flow cytometry analysis
For the determination of the activation levels of the different CX3CR1-expressing subpopulations of NK cells, freshly isolated PBMCs were washed and incubated with anti-CD3 PerCP, anti-CD16 FITC, anti-CD25 APC and anti-CX3CR1 PE antibodies for 20 min at room temperature. After washing, cells were analysed on a FACSCanto.
For the analysis of CX3CR1 expression on whole NK cells and phenotypic characterization of CX3CR1high and CX3CR1neg/low NK cells, freshly isolated PBMCs were washed and stained with antibodies against CD3, CD56, CD16, CX3CR1 and CD62L, CD57, CD27, NKG2A, panKIR (KIR2DL1/2DS1/2DL2/2DS2/2DL3/3DL1/3DL2/3DS1), NKp30 and NKp46. For the analysis of monocytes from the NK cell : monocyte co-culture, cells were blocked with Fc fragments for 10 min and subsequently stained with antibodies against human CD14, CD11c, CD40, CD86 and HLA-DR according to standard procedures. Flow cytometric analyses were performed on a FACSCanto. Data were analysed using the FlowJo software (Tree Star, Inc., Ashland, OR).
Quantitative real-time RT-PCR
Magnetically sorted NK cells were stained with a PE-labelled anti-human CX3CR1 antibody and sorted into CX3CR1neg/low-expressing and CX3CR1high-expressing fractions on a FACSAria Cell Sorting System (Becton-Dickinson, Heidelberg, Germany). Sorted NK cells were then adjusted to 1·6 × 106 per ml and incubated in 100 ng/ml PMA and 1 μg/ml ionomycin for 4 hr. Cells were then harvested and total RNA was isolated using the RNeasy Mini kit (Qiagen, Hilden, Germany) according to the manufacturer's instructions. RNA was then transcribed to cDNA with random hexamers using TaqMan Reverse Transcription Reagents (Applied Biosystems, Darmstadt, Germany). Quantitative real-time RT-PCR was performed on the ABI PRISM 7000 Sequencing Detection System (Applied Biosystems) using the qPCR Mastermix Plus (Eurogentec, Seraing, Belgium). The comparative threshold method (comparative Ct method) was used to quantify the results obtained by real-time RT-PCR. Data were normalized to the corresponding housekeeping gene beta-actin. Primers and probes (FAM-TAMRA-labelled) that were used are listed in Table 1. The probes were labelled with the reporter dye carboxyfluorescein (FAM) at the 5′-end and with the quencher dye tetramethylrhodamin (TAMRA) at the 3′-end (Table 1). For granulocyte–macrophage colony-stimulating factor (GM-CSF), TaqMan Gene Expression Assays (Applied Biosystems) were used.
Table 1.
Primers and probes for real time RT-PCR
| Name | Primer | Sequence 5′→3′ | Company |
|---|---|---|---|
| Beta-actin | Forward | GGC ACC CAG CAC AAT GAA G | TIB MOLBIOL, Germany |
| Reverse | GCC GAT CCA CAC GGA GTA CT | TIB MOLBIOL, Germany | |
| Probe | TCA AGA TCA TTG CTC CTC CTG AGC GC | Microsynth, Germany | |
| Interleukin-5 | Forward | ATA GCC AAT GAG ACT CTG AGG ATT C | TIB MOLBIOL, Germany |
| Reverse | TCC ACA GTA CCC CCT TGC A | TIB MOLBIOL, Germany | |
| Probe | TCA GGG AAT AGG CAC ACT GGA GAG TCA AAC | MWG GmbH, Germany | |
| Interleukin-10 | Forward | CAA GTT GTC CAG CTG ATC CTT CAT | MWG GmbH, Germany |
| Reverse | GGC AAC CTG CCT AAC ATG CTT | MWG GmbH, Germany | |
| Probe | AAA GAA AGT CTT CAC TCT GCT GAA GGC ATC TCG | MWG GmbH, Germany | |
| Interleukin-13 | Forward | GCC CTC AGG GAG CTC ATT G | TIB MOLBIOL, Germany |
| Reverse | TGC AGC CTG ACA CGT TGA TC | TIB MOLBIOL, Germany | |
| Probe | TCA ACA TCA CCC AGA ACC AGA AGG CTC | MWG GmbH, Germany | |
| Interferon-γ | Forward | CAG GTC ATT CAG ATG TAG CGG ATA A | MWG GmbH, Germany |
| Reverse | AGG AGA CAA TTT GGC TCT GCA TT | MWG GmbH, Germany | |
| Probe | TTT CTG TCA CTC TCC TCT TTC CAA TTC TTC AAA | MWG GmbH, Germany | |
| Tumour necrosis factor-α | Forward | TCT CGA ACC CCG AGT GAC AA | MWG GmbH, Germany |
| Reverse | TCA GCC ACT GGA GCT GCC | MWG GmbH, Germany | |
| Probe | TGT AGC CCA TGT TGT AGC AAA CCC TCA AGC | MWG GmbH, Germany | |
| CX3CR1 | Forward | TGA CTG GCA GAT CCA GAG GTT | MWG GmbH, Germany |
| Reverse | TTC TGT CAC TGA TTC AGG GAA CTG | MWG GmbH, Germany | |
| Probe | AGT CCA CGC CAG GCC TTC ACC A | MWG GmbH, Germany |
For determination of the CX3CR1 expression on NK cells in the presence of cytokines, purified NK cells were cultured in serum-free media in IL-2, IL-12, IL-15, IL-18, IL-21, or TGF-β, respectively, for 20–22 hr (concentrations are listed in Table 2). Afterwards, cells were harvested, washed, and total RNA was isolated as mentioned above. The CX3CR1 mRNA levels were assessed by quantitative real-time RT-PCR and normalized to the housekeeping gene beta-actin. The primers and FAM-TAMRA-labelled probe for CX3CR1 are listed in Table 1. All samples were run in duplicates.
Table 2.
Concentrations of used cytokines
| c1 | c2 | c3 | |
|---|---|---|---|
| Transforming growth factor-β | 0·1 ng/ml | 1 ng/ml | 10 ng/ml |
| Interleukin-18 | 1 ng/ml | 10 ng/ml | 100 ng/ml |
| Interleukin-15 | 50 ng/ml | 100 ng/ml | 200 ng/ml |
| Interleukin-12 | 1 ng/ml | 10 ng/ml | 100 ng/ml |
| Interleukin-2 | 10 U/ml | 50 U/ml | 100 U/ml |
| Interleukin-21 | 10 ng/ml | 30 ng/ml | 100 ng/ml |
Proliferation assays
Ninety-six-well flat-bottom plates were coated with 1 μg/ml anti-CD3, incubated for 2 hr at 37° and washed afterwards with PBS. CD4-positive T cells from freshly isolated PBMCs were positively selected using CD4 MicroBeads (Miltenyi) and incubated with 2·5 μm carboxyfluorescein succinimidyl ester (CFSE) in RPMI (Gibco, Invitrogen GmbH, Darmstadt, Germany) supplemented with 1% HEPES for 10 min at 37° in 5% CO2. The NK cells from the same donor were negatively selected using the NK cell isolation Kit (Miltenyi). Purity of enriched cells was assessed and was always > 90%. Thereafter NK cells were FACS-sorted into CX3CR1neg/low-expressing and CX3CR1high-expressing NK cells. Ratios of effector (NK cells) to target (T) cells ranging from 1 : 12·5 to 1 : 50 were plated together with aCD28 (2·5 μg/ml) and incubated for 72 hr at 37° in 5% CO2. Cells were then harvested and stained with an antibody against human CD4 conjugated with PerCP. Percentage of proliferating CD4-positive cells was analysed by flow cytometry.
For determination of the IL-2 response of NK cells, presorted CX3CR1neg/low-expressing and CX3CR1high-expressing NK cells were incubated in a 96-well flat bottom plate without or with IL-2 (100 U/ml) for 72 hr at 37° in 5% CO2. [3H]Thymidine (Amersham, Braunschweig, Germany) was then added at a dose of 0·5 μCi to each well. After 18 hr, incorporation of radioactivity was measured in counts per minute (c.p.m.) with a Microbeta β counter (Wallac ADL, Freiburg, Germany).
For the analysis of NK cell proliferation using CFSE, freshly isolated NK cells were stained with CD56, CD16, CD3 and CX3CR1 and subsequently FACS-sorted into CX3CR1neg CD56bright, CX3CR1neg CD56dim and CX3CR1high CD56dim NK cell fractions. Sorted NK cell fractions (1 × 10⁶ cells/ml) were incubated with CFSE as described above for T cells. Labelled cells were plated in 96-well plates and stimulated with and without 100 U/ml IL-2 at 37° in 5% CO2 for 5 days. Afterwards proliferating NK cells were determined by flow cytometry.
Co-culture of monocytes and NK cells
Freshly isolated NK cells were sorted into CX3CR1neg/low and CX3CR1high fractions and were adjusted to 1 × 10⁶ per ml and used as effector cells. Freshly magnetically sorted monocytes were also adjusted to 1 × 10⁶ per ml and used as target cells. Cells were plated at the ratio of 3 : 1 (effector : target cell) and incubated for 36 hr at 37° in 5% CO2. Cultures with only monocytes served as a control. To facilitate the separation of monocytes from the plate after the culturing period, cells were incubated for 1 hr in ice-cold PBS in the refrigerator. Cells were than carefully harvested, washed with PBS and stored in FACS buffer (PBS containing 0·5% BSA; pH 7·2–7·4) for the subsequent flow cytometric analysis.
Statistical analysis
The Mann–Whitney U-test was used to calculate P-values for intergroup comparison of two groups for real-time RT-PCR data on cytokine profiles and flow cytometry data on CD25 expression. The Wilcoxon test was used to calculate P-values for real-time RT-PCR data on modulation of CX3CR1 by cytokines. The Kruskal–Wallis non-parametric one-way analysis of variance was performed to assess the relation between multiple groups. Specific associations between groups were assessed with the Mann–Whitney U-test for non-parametric data. Bonferroni–Holm corrections were also performed for multiple Mann–Whitney U-test comparisons. The calculations were carried out using spss 12.0 and 18.0 software for Windows (SPSS, Chicago, IL). A P-value of < 0·05 was regarded as significant.
Results
Human CX3CR1neg/low and CX3CR1high NK cells differ in their cytokine signature, activation status and proliferative response
To address whether the expression of CX3CR1 on human NK cells is associated with a certain cytokine profile and therefore with a particular function, we analysed the expression of cytokines such as interferon-γ (IFN-γ), tumour necrosis factor-α (TNF-α), GM-CSF, IL-5, IL-10 and IL-13 in CX3CR1neg/low and CX3CR1high NK cell fractions. The NK cells were magnetically sorted from freshly isolated PBMCs and FACS-sorted into CX3CR1neg/low and CX3CR1high fractions, incubated with mitogens (PMA/ionomycin), and analysed by quantitative real-time RT-PCR. CX3CR1neg/low NK cells expressed significantly higher amounts of IL-5, IL-10, IL-13, GM-CSF and TNF-α compared with CX3CR1high NK cells (Fig. 1a). Compared with CX3CR1high, CX3CR1neg/low NK cells expressed approximately 30 times more IL-5, up to 15 times more of the regulatory cytokine IL-10, about four times more TNF-α and more than twice as much GM-CSF. The expression of IL-13 was more than 100 times higher by CX3CR1neg/low than by CX3CR1high NK cells. No differences were observed between the two fractions in the expression of IFN-γ (Fig. 1a).
Figure 1.
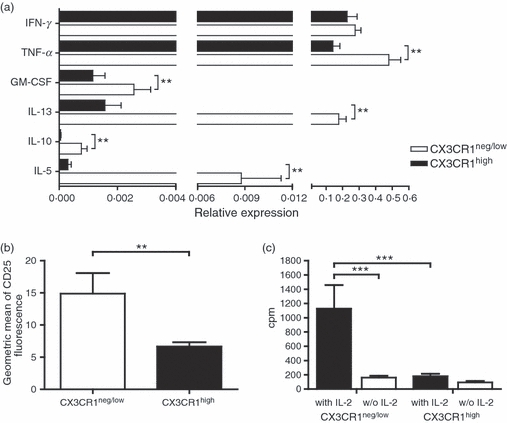
Human CX3CR1neg/low and CX3CR1high natural killer (NK) cells show different pattern of cytokine expression, different levels of surface CD25 and different proliferative capacities. (a) Magnetically isolated NK cells were FACS-sorted into CX3CR1neg/low and CX3CR1high fractions and incubated with mitogens (PMA/Ionomycin) for 4 hr. Gene expression of interferon-γ (IFN-γ), tumour necrosis factor-α (TNF-α), granulocyte–macrophage colony-stimulating factor (GM-CSF), interleukin-13 (IL-13), IL-10 and IL-5 of CX3CR1neg/low NK cells (white bar) compared with CX3CR1high NK cells (shaded bar) was analysed using real-time RT-PCR. The data are normalized to the housekeeping gene b-actin and are expressed as the mean relative expression of at least four independent experiments ± SEM. **P < 0·01. (b) CD25 expression on CD56+ CD16+ CD3− CX3CR1neg/low and CD56+ CD16+ CD3− CX3CR1high expressing cells was determined by flow cytometry. The y-axis shows the mean fluorescence intensity of the CD25 staining. The figure shows a higher expression of CD25 on CX3CR1neg/low NK cells compared with CX3CR1high NK cells. Data from six independent experiments ± SEM are represented. **P < 0·01. (c) The figure shows the proliferative response to IL-2 of the CX3CR1neg/low and CX3CR1high NK cell fractions. NK cells were incubated with or without IL-2 (100 U/ml) for 72 hr. Proliferation response was assessed by [3H]thymidine uptake in triplicates and shown as the mean c.p.m. of four independent experiments ± SEM. Data show a strong IL-2-mediated proliferation of CX3CR1neg/low NK cells exclusively. ***P < 0·001.
To determine whether CX3CR1neg/low and CX3CR1high NK cell populations may differ in their activation status, we analysed CD25 expression on both NK cell subsets in freshly isolated PBMCs using flow cytometric analysis. We measured a significantly higher expression of CD25 on CX3CR1neg/low-expressing NK cells compared with their CX3CR1high counterparts (Fig. 1b). As CD25 is the alpha subunit of the high-affinity IL-2 receptor, we questioned whether proliferative response to IL-2 may also differ between the CX3CR1neg/low and CX3CR1high NK cell populations. To measure proliferation, NK cell subsets were sorted combining MACS and FACS sorting procedures. Sorted CX3CR1neg/low and CX3CR1high cells were then incubated for 72 hr with and without recombinant IL-2. We observed a complete lack of response of CX3CR1high NK cells to IL-2 whereas the CX3CR1neg/low fraction strongly proliferated in the presence of IL-2 (Fig. 1c).
CX3CR1neg/low and CX3CR1high NK cells do not influence the phenotype of monocytes but differentially modulate their co-stimulatory capacities
To determine whether CX3CR1neg/low and CX3CR1high NK cells are functionally distinct subsets, we investigated how these two subtypes influence T-cell proliferation and monocyte function in vitro. We performed proliferation assays with positively selected human CD4+ T cells activated by anti-CD3/anti-CD28 antibodies in the presence of sorted autologous CX3CR1high or CX3CR1neg/low NK cells in different ratios. There was no effect of either CX3CR1high or CX3CR1neg/low NK cells on the proliferative T-cell response (data not shown). Yet, this does not exclude a possible distinct cytotoxic action of the NK cell fractions on autologous T cells. However, NK cell-mediated T-cell cytotoxicity could not be assessed because this can only be achieved using cytokine-activated NK cells25,26 a pre-activation that, in turn, would affect the CX3CR1high and CX3CR1neg/low phenotypes investigated here.
Next, we examined whether these NK cell subsets could differentially influence the phenotype and hence the antigen-presenting activity of human monocytes. The MACS-sorted monocytes were co-cultured with MACS/FACS-sorted autologous CX3CR1high and CX3CR1neg/low NK cells in a 1 : 3 ratio. After 36 hr, the expression of CD14, HLA-DR, CD86 and CD40 was assessed on non-lymphocytic CD11c-positive cells using flow cytometry. Figure 2(a) shows that after 36 hr of co-incubation of NK cells/monocytes, neither CX3CR1high nor CX3CR1neg/low NK cells affected the expression of the monocyte marker CD14. Hence, monocytes retain their phenotype after co-culturing with NK cells over a period of 36 hr and did not differentiate into dendritic cells. Furthermore, we found that both CX3CR1high and CX3CR1neg/low induced down-regulation of CD86 expression and a slight decrease of HLA-DR on monocytes (Fig. 2b). Interestingly, in contrast to the CX3CR1high fraction, CX3CR1neg/low NK cells promoted a 2·5-fold increase of CD40 expression (Fig. 2b), indicating that the CX3CR1neg/low NK cells differ from the CX3CR1high subset in their ability to influence the co-stimulatory capacities of monocytes.
Figure 2.
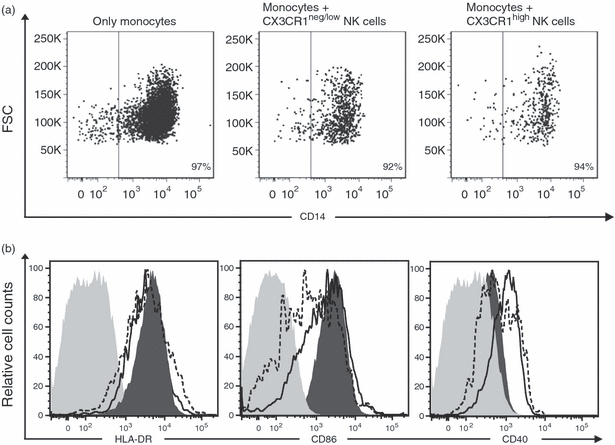
CX3CR1neg/low and CX3CR1high natural killer (NK) cells do not modulate CD14 expression on monocytes but differentially influence monocytic co-stimulatory capacities. Sorted monocytes were incubated with autologous CX3CR1negative/low and CX3CR1high for 36 hr. Expression of CD14, HLA-DR and co-stimulatory molecules CD86 and CD40 was analysed on CD11c-positive non-lymphocytic cells using flow cytometry. (a) The dot plots show that CD14 expression on monocytes remained unaffected after co-culture without or with CX3CR1neg/low and CX3CR1high NK cells. (b) Histograms show the expression of the different markers/molecules on monocytes cultured without NK cells (filled dark grey histogram), after co-culturing with CX3CR1neg/low NK cells (solid line) and CX3CR1high NK cells (dashed line). Control staining is shown as filled, light grey histograms. Data are representative of three independent experiments.
CX3CR1neg/low NK cells differ from the CD56bright CD16− subset
A few years ago, Cooper et al.27 identified two distinct subsets of human NK cells based on different levels of expression of CD56. While CD56dim CD16bright NK cells (representing 90% of peripheral blood NK cells) primarily function as potent cytolytic effector cells, CD56bright CD16−/dim NK cells represent a minor subset of poorly cytolytic NK cells that briskly secrete diverse cytokines such as IFN-γ, TNF-α or IL-10. The CX3CR1high and CX3CR1neg/low populations appear to show similar features to the CD56dim and CD56bright, respectively, so we asked whether expression of the chemokine receptor and expression intensity of CD56 define the same NK cell subsets. Using conventional flow cytometric analysis, we confirmed that CX3CR1high NK cells were CD56dim NK cells. However, we showed that CX3CR1neg/low NK cells encompassed not only all CD56bright cells (CD16+ and CD16−) but also a large subpopulation (up to 60%) of CD56dim CD16bright NK cells (Fig. 3a). It was important to exclude the possibility that the presence of CD56dim cells in the CX3CR1neg/low fraction was not caused by inclusion in the analysis of cells expressing low amounts of CX3CR1. We therefore restricted our examination to NK cells that completely lacked CX3CR1 expression. We found that about 45% of the CX3CR1-negative cells were CD56dim (Fig. 3b). These data indicate that CX3CR1neg/low NK cells include not only the classical immunomodulatory CD56bright population but also a high percentage of CD56dim cells. Hence, our data identified three distinct NK cell subsets based on their expression of CX3CR1 and CD56: CX3CR1neg CD56bright, CX3CR1neg CD56dim and CX3CR1high CD56dim NK cells. The analysis of the CD25 expression (Fig. 3c) and proliferative capacities in response to IL-2 measured by CFSE dilution assays (Fig. 3d) of these three populations indicated that CX3CR1neg CD56dim NK cells may represent an intermediary phenotype between CX3CR1neg CD56bright and CX3CR1high CD56dim NK cells. Notably, compared with the CX3CR1high CD56dim population, the CX3CR1neg CD56dim fraction strongly proliferated, indicating that lack of proliferative capacity may correlate better with the magnitude of CX3CR1 expression than with reduced density of CD56 expression.
Figure 3.
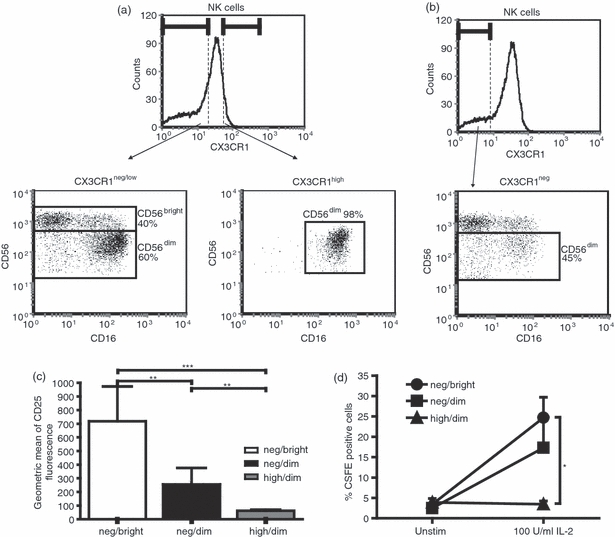
CX3CR1neg/low natural killer (NK) cells encompass a CD56bright and a CD56dim NK cell fraction. (a) CD56 expression on CX3CR1neg/low and CX3CR1high NK cells was determined using flow cytometry. The dot plots demonstrate that about 40% of all CX3CR1neg/low cells were CD56bright while 60% were CD56dim. Almost all CX3CR1high cells were CD56dim. (b) From the CX3CR1neg NK cells, about 45% were CD56dim. Hence, gating on CX3CR1neg and CX3CR1high cells, three NK cell fractions can be defined based on CD56 expression: CX3CR1neg CD56bright, CX3CR1neg CD56dim and CX3CR1high CD56dim NK cells. Data are representative of four independent experiments. (c) CD25 expression on CX3CR1neg CD56bright (neg/bright), CX3CR1neg CD56dim (neg/dim) and CX3CR1high CD56dim (high/dim) was determined in freshly isolated peripheral blood mononucelar cells (PBMCs). Flow cytometric analyses revealed CX3CR1neg CD56dim as an intermediary phenotype (black bar), which showed an intermediate significantly distinct expression of CD25 when compared with neg/bright-expressing NK cells (white bar) and high/dim-expressing NK cells (grey bar). The data are normalized to b-actin and are shown as the mean relative expression of 11 independent experiments ± SEM. *P < 0·05. (d) Proliferative capacity of CX3CR1neg CD56bright, CX3CR1neg CD56dim and CX3CR1high CD56dim NK cell fractions was measured by CSFE dilution after 5 days of stimulation with or without 100 U/ml interleukin-2 (IL-2). CX3CR1negCD56bright (neg/bright) and CX3CR1neg CD56dim (neg/dim) NK cells proliferate strongly in the presence of IL-2, whereas no proliferation was detected in the CX3CR1high CD56dim (high/dim) fraction. The data are shown as the mean percentage of proliferating cells of eight independent experiments ± SEM. *P < 0·05
Degree of CX3CR1 expression defines different maturation stages of CD56dim NK cells
To further characterize the distinct CX3CR1neg CD56bright, CX3CR1neg CD56dim and CX3CR1high CD56dim NK cell fractions, we assessed the expression of killer cell immunoglobulin-like receptors (KIR, including KIR2DL1/2DS1/2DL2/2DS2/2DL3/3DL1/3DL2/3DS1), NKG2A and NKp30 and NKp46 on these three NK cell populations using flow cytometry (Fig. 4a). The majority of CX3CR1neg CD56bright NK cells did not express KIR on the surface; however, more than 95% of these NK cells were high expressers of NKp30 and NKp46, and about 80% expressed high levels of NKG2A. In all samples investigated, the grade of CX3CR1 expression in the CD56dim NK cell fraction coincided with a decrease in the expression of NKp30, NKp46 and NKG2A and with an increased KIR expression (Fig. 4a). Hence, CX3CR1neg CD56dim NK cells appear to represent a phenotypic stage between proliferating, cytokine-producing NKG2A/NKp30/NKp46-expressing NK cells and non-proliferating KIR-expressing NK cells.
Figure 4.
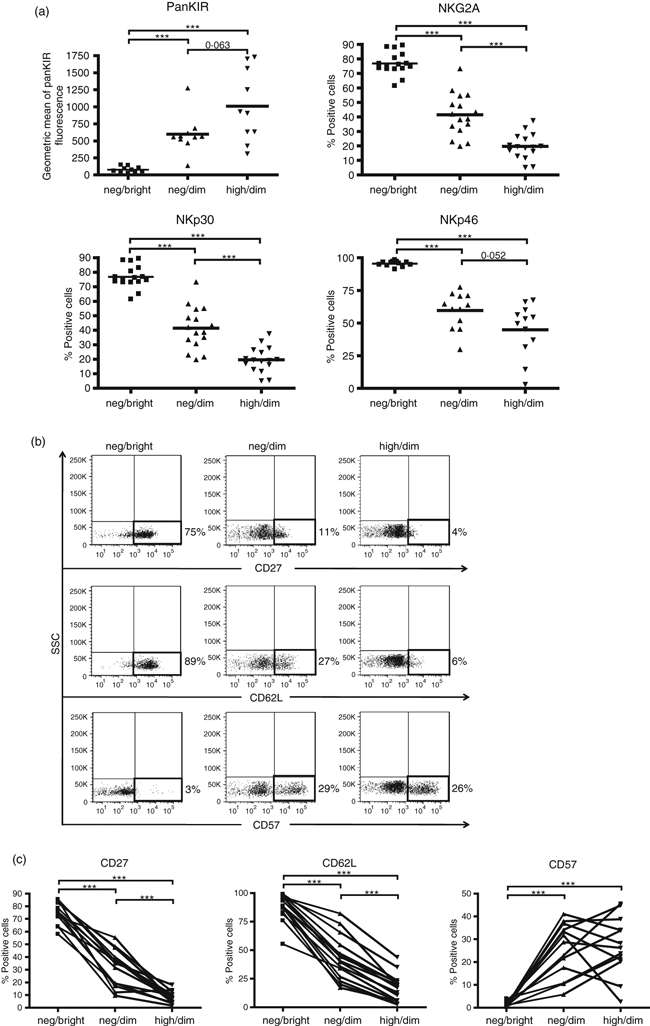
CX3CR1neg CD56bright, CX3CR1neg CD56dim and CX3CR1high CD56dim natural killer (NK) cells show different patterns of NK cell receptors and maturation markers. (a) NK cell receptor expression on the three NK cell subsets was determined by flow cytometry. CX3CR1neg CD56dim (neg/dim) show an intermediate expression of NKp30, NKp46, NKG2A and KIR2DL1/2DS1/2DL2/2DS2/2DL3/3DL1/3DL2/3DS1 (indicated as panKIR) compared with neg/bright and high/dim-expressing NK cells. Data from at least 10 independent experiments are shown. **P < 0·01, ***P < 0·001. (b) The panel shows flow cytometric analysis of peripheral blood mononuclear cells stained for CD62L, CD57 and CD27, gated first for CD3− CD56+ CD16+ cells and gated subsequently for CX3CR1neg CD56bright (neg/bright), CX3CR1neg CD56dim (neg/dim) and CX3CR1high CD56dim (high/dim) NK cells. The figures are representative of at least 13 independent donors. (c) Percentage of CD62L-, CD57- and CD27-expressing in CX3CR1neg CD56bright (neg/bright), CX3CR1neg CD56dim (neg/dim) and CX3CR1high CD56dim (high/dim) NK cells was determined using flow cytometry. Data of at least 13 independent experiments and representative dot plots are shown. **P < 0·01, ***P < 0·001.
As the expression of CD27, CD62L and CD57 has been shown to characterize different steps of NK cell maturation,28–31 we addressed how CX3CR1 expression is related to the expression of these recently identified maturation markers. We monitored the surface expression of CD27, CD62L and CD57 on CX3CR1neg CD56bright, CX3CR1neg CD56dim and CX3CR1high CD56dim NK cells using flow cytometry. The majority of CX3CR1neg CD56bright NK cells expressed CD27 and CD62L and were negative for CD57. However, in the CX3CR1neg CD56dim, we observed a strong reduction of CD27 and CD62L, and increased expression of CD57. Interestingly, although the expression of CD57 did not differ between CX3CR1neg CD56dim and CX3CR1high CD56dim NK cells, both CD27 and CD62L expression were further decreased in the CX3CR1neg CD56dim fraction when compared with the CX3CR1high CD56dim population (Fig. 4b,c).
Hence, the expression pattern of CD27 and CD62L on CX3CR1neg CD56bright, CX3CR1neg CD56dim and CX3CR1high CD56dim NK cells indicates that these three phenotypes indeed reflect distinct stages of NK cell maturation. Additional studies combining analysis of CX3CR1 expression with other NK cell markers are needed to establish and understand the sequential stages of NK cell differentiation.
Cytokines responsible for NK cell activation induce down-regulation of CX3CR1 expression
We previously showed that the frequency of CX3CR1-expressing NK cells correlated with disease activity of multiple sclerosis.24 However, to understand the relationship between pathology and degree of receptor expression, additional information on CX3CR1 regulation is required. We address here the question of how the immune milieu may influence CX3CR1 expression on NK cells. We assessed the effect on CX3CR1 of different cytokines known to modulate NK cell activity, including the related cytokines IL-2, IL-15 and IL-21, the IFN-γ-inducing cytokines IL-12 and IL-18 as well as the inhibitory cytokine TGF-β. CX3CR1 gene expression was quantified by real-time RT-PCR. Negatively selected resting NK cells were incubated for 20–22 hr with different cytokine concentrations (see Table 2). Our data showed that while IL-2 and IL-15 induced a strong down-regulation of CX3CR1 in a concentration-dependent way, IL-21 had no effect (Fig. 5a). Both IL-12 and TGF-β1 also promoted a concentration-dependent down-regulation CX3CR1 expression (Fig. 5a). Data for IL-18 showed a trend towards CX3CR1 down-regulation but did not reach statistical significance. Next, we investigated the effects of the most relevant cytokines, IL-2, IL-15, IL-12 and TGF-β on the surface expression of CX3CR1. Magnetically sorted NK cells were stimulated for 24 hr without any additives, or in the presence of IL-2 (100 U/ml), IL-15 (200 ng/ml), IL-12 (100 ng/ml) and TGF-β (10 ng/ml), respectively. CX3CR1 expression was analysed using flow cytometry. The protein data confirmed the observation on gene expression levels, showing a cytokine-dependent down-regulation of surface CX3CR1 on NK cells (Fig. 5b). Moreover, the strongest CX3CR1 down-regulation was observed in the presence of IL-15 and TGF-β, which also confirmed data obtained by PCR. Hence, most cytokines inducing activation/proliferation of NK cells negatively influence CX3CR1 expression, indicating a dynamic relation between CX3CR1high and CX3CR1neg/low subsets.
Figure 5.
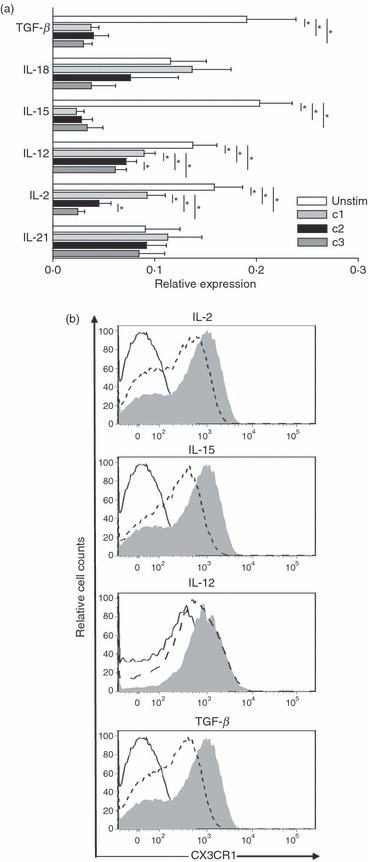
Natural killer (NK) cell-activating cytokines induce down-regulation of CX3CR1 expression. The NK cells were cultured without or in the presence of different concentrations of the indicated cytokines for 20–22 hr (see Table 2 for cytokine concentrations). (a) Expression of CX3CR1 was determined by quantitative real-time RT-PCR. The data are normalized to the housekeeping gene beta-actin, and are expressed as the mean relative expression of at least four independent experiments ± SEM. Interleukin-2 (IL-2), IL-12, IL-15 and transforming growth factor-β (TGF-β) promoted a significant dose-dependent down-regulation of the receptor. Down-regulation of CX3CR1 promoted by IL-18 did not reach statistical significance and IL-21 did not show any effect on CX3CR1 expression. *P < 0·05. (b) Expression of surface CX3CR1 on NK cells was monitored using flow cytometry. Solid lines represent unstained controls; shaded areas, unstimulated NK cells; dashed lines, NK cells stimulated with the highest concentration of the respective cytokines (100 U/ml IL-2; 200 ng/ml IL-15; 100 ng/ml IL-12; 10 ng/ml TGF-β). One representative experiment of at least three is shown.
Discussion
In our previous study, we observed an association between the expression of CX3CR1 on NK cells and multiple sclerosis. To further elucidate the involvement of CX3CR1-expressing NK cells in disease, we aimed here to characterize the phenotype and functionality of CX3CR1high and CX3CR1neg/low NK cell populations. We demonstrated that CX3CR1high and CX3CR1neg/low NK cell phenotypes are distinct from the NK1/NK2 or CD56dim CD56bright NK cells, two NK cell pairs identified previously.27,32,33 Similarly to NK2 cells, CX3CR1neg/low NK cells expressed high levels of IL-5 and IL-13, but also of IL-10 (Fig. 1), shown to be produced by NK1 cells.32 Furthermore, CX3CR1neg/low NK cells expressed similar amounts of IFN-γ but significantly more GM-CSF and TNF-α than CX3CR1high (Fig. 1a), hence differing also from the cytokine profile of CD56bright CD56dim subsets. Furthermore, we showed a high expression of the activation marker CD25 on CX3CR1neg/low NK cells (Fig. 1b), which was accompanied by a very strong proliferative response to IL-2 in vitro (Fig. 1c).
Next, we asked to what extent CX3CR1high and CX3CR1neg/low NK cell subsets could differentially affect the adaptive immune response. In our experiments, human NK cells, independent of their CX3CR1 expression, were unable to influence proliferation of autologous activated T cells (data not shown) but modulated the co-stimulatory capacities of monocytes (Fig. 2b) without affecting monocytic phenotype (Fig. 2a). In this approach, we did not activate NK cells with either IL-2 or IL-15 to exclude the possible effects of these cytokines on CX3CR1high and CX3CR1neg/low phenotypes. We showed that after 36 hr of co-culturing both CX3CR1high and CX3CR1neg/low NK cells induced down-regulation of CD86 and HLA-DR on monocytes, whereas up-regulation of CD40 was induced principally by CX3CR1neg/low NK cells (Fig. 2b). This is in agreement with the results by Zhang et al.34 who recently reported the up-regulation of CD40 on monocytes co-cultured with NK cells, especially CD56bright NK cells. Yet 36 hr of co-culturing was obviously too short for observing possible differentiation of monocytes into dendritic cells as reported previously.34 The CX3CR1neg/low NK cell fraction parallels CD56bright NK cells, in terms of both proliferative capacities35 and monocyte modulation. However, the analysis of the co-expression of CD56 and CX3CR1 revealed that while all CX3CR1high NK cells were indeed CD56dim CD16high, the CX3CR1neg/low fraction encompassed both CD56dim CD16low and CD56bright CD16neg/low NK cells (Fig. 3a). Our data suggest the existence of distinct NK cell populations based on CD56 and CX3CR1 expression: CX3CR1neg CD56bright, CX3CR1neg CD56dim and CX3CR1high CD56dim NK cells. Interestingly, the analysis of surface CD25 expression and of the proliferative response indicated that these three fractions represented distinct NK cell phenotypes (Fig. 3c,d). These findings were also confirmed by examination of the expression of different NK receptors on CX3CR1neg CD56bright, CX3CR1neg CD56dim and CX3CR1high CD56dim NK cells. All the analysed receptors showed a similar expression pattern, progressively increasing for KIR and gradually decreasing for NKp30, NKp46 and NKG2A from CX3CR1neg CD56bright to CX3CR1high CD56dim (Fig. 4a). These data verified that CX3CR1neg CD56dim NK cells indeed represent an intermediate phenotype distinct from the CX3CR1high CD56dim subset. Several recent publications have reported on markers characterizing different stages of NK cell maturation, including CD27,28 CD94,36 CD62L29 and CD57.30,31 Expression analysis of CD27, CD62L and CD57 on CX3CR1neg CD56bright, CX3CR1neg CD56dim and CX3CR1high CD56dim NK cells showed that, from the fractions investigated here, only the CX3CR1high CD56dim subset parallels the mature phenotype as defined by the lack of CD27 and CD62L and the acquisition of CD57 (Fig. 4b,c). According to our previous data,24 we focused here on different NK cell fractions selected on the basis of the magnitude of CX3CR1 expression (CX3CR1neg and CX3CR1high). Even though our data indicate that the whole CX3CR1-positive fraction has a similar phenotype to CX3CR1high-expressing NK cells, further analyses are needed to demonstrate this equivalence.
Interestingly, with regards to CD57 expression, the intermediary CX3CR1neg CD56dim fraction appears to encompass different stages of differentiation. Additional investigations of this intermediate population will be needed to determine whether the CX3CR1neg CD56dim CD57− phenotype may differ from the CX3CR1neg CD56dim CD57+.
Moreover, we present here evidence for cytokine-mediated regulation of CX3CR1 in NK cells. We showed that not only IL-15, but also IL-2 down-regulated CX3CR1 expression on human NK cells at the RNA (Fig. 5a) and protein (Fig. 5b) levels. Although they may contradict the murine data published so far,37 our results are in agreement with the identical effects of these structurally related cytokines on human resting NK cells observed by Dunne et al.38 In mice, it has been reported that whereas IL-2 induces increased expression of CX3CR1 on NK cells, IL-15 down-regulated the receptor expression despite their structural similarities. No effect was observed when NK cells were stimulated with IL-21 (Fig. 5a), although this cytokine shares the gamma-chain of the receptor, among others, with IL-2 and IL-15.39 It is possible that IL-21 affects CX3CR1 expression only in synergy with other cytokines, as was also reported for other effects of IL-21 on NK cell biology.40,41 We also observed a down-regulation of CX3CR1 gene and protein expression on NK cells induced by TGF-β (Fig. 5a,b), which, on the one hand, appeared to contradict the effects reported in rats42 but, on the other hand, were consistent with the reported inhibitory effects of TGF-β on human NK cells.43,44 Hence, a different regulation of NK cell function and CX3CR1 expression in rodents and humans seems to be probable. Similarly, we observed a down-regulation of CX3CR1 expression by IL-12, an additional cytokine involved in NK cell immunomodulation,45 suggesting that most cytokines known to induce NK cell proliferation/activation promote CX3CR1 down-regulation.
In summary, our data show the existence of distinct NK cell phenotypes depending on the magnitude of CX3CR1 expression. The NK cell phenotypes defined by CX3CR1 expression differ in their cytolytic activity, cytokine profile, proliferative response and their impact on monocyte functionality. Moreover, we identified three different stages of NK cell maturation based on the expression of CX3CR1 and CD56. While the CX3CR1neg CD56bright phenotype is exclusively characteristic for immature NK cells, the magnitude of CX3CR1 expression on CD56dim NK cells discriminates between intermediary CX3CR1neg CD56dim and fully mature CX3CR1high CD56dim NK cells. Hence, our study demonstrates that CX3CR1 can be used in conjunction with CD56 and with other novel maturation markers to delineate NK cell phenotypes characteristic for the sequential stages of human NK cell maturation.
Acknowledgments
This work was supported by grants from the Charité (Rahel-Hirsch Stipend to C.I-D.), the Graduate Research School GRK1258 and the German Research Council (SFB 650). We thank Bibiane Seeger and Thordis Hohnstein for excellent technical support, Alexander Brandt for help with the statistical analyses, Lena Mann for reading the manuscript as a native English speaker and Jason Millward for critical reading of the manuscript.
Glossary
Abbreviations:
- APC
allophycocyanin
- CFSE
carboxyfluorescein succinimidyl ester
- CNS
central nervous system
- c.p.m.
counts per minute
- GM-CSF
granulocyte–macrophage colony-stimulating factor
- IFN
interferon
- IL-2
interleukin-2
- NK cell
natural killer cell
- neg
negative
- PBMC
peripheral blood mononuclear cell
- PE
phycoerythrin
- PerCP
peridinin chlorophyll protein
- TGF
transforming growth factor
- Th1
T helper type 1
- TNF
tumour necrosis factor
Disclosures
The authors have no conflict of interest.
References
- 1.Cardona AE, Ransohoff RM. Chemokine receptor CX3CR1. UCSD-Nat Mol Pages. 2009 doi: 10.1038/mp.a000633.01. [Google Scholar]
- 2.Fraticelli P, Sironi M, Bianchi G, et al. Fractalkine (CX3CL1) as an amplification circuit of polarized Th1 responses. J Clin Invest. 2001;107:1173–81. doi: 10.1172/JCI11517. [DOI] [PMC free article] [PubMed] [Google Scholar]
- 3.Nishimura M, Umehara H, Nakayama T, et al. Dual functions of fractalkine/CX3C ligand 1 in trafficking of perforin+/granzyme B+ cytotoxic effector lymphocytes that are defined by CX3CR1 expression. J Immunol. 2002;168:6173–80. doi: 10.4049/jimmunol.168.12.6173. [DOI] [PubMed] [Google Scholar]
- 4.Dichmann S, Herouy Y, Purlis D, Rheinen H, Gebicke-Harter P, Norgauer J. Fractalkine induces chemotaxis and actin polymerization in human dendritic cells. Inflamm Res. 2001;50:529–33. doi: 10.1007/PL00000230. [DOI] [PubMed] [Google Scholar]
- 5.Moatti D, Faure S, Fumeron F, et al. Polymorphism in the fractalkine receptor CX3CR1 as a genetic risk factor for coronary artery disease. Blood. 2001;97:1925–8. doi: 10.1182/blood.v97.7.1925. [DOI] [PubMed] [Google Scholar]
- 6.McDermott DH, Halcox JP, Schenke WH, Waclawiw MA, Merrell MN, Epstein N, Quyyumi AA, Murphy PM. Association between polymorphism in the chemokine receptor CX3CR1 and coronary vascular endothelial dysfunction and atherosclerosis. Circ Res. 2001;89:401–7. doi: 10.1161/hh1701.095642. [DOI] [PubMed] [Google Scholar]
- 7.Landsman L, Bar-On L, Zernecke A, et al. CX3CR1 is required for monocyte homeostasis and atherogenesis by promoting cell survival. Blood. 2009;113:963–72. doi: 10.1182/blood-2008-07-170787. [DOI] [PubMed] [Google Scholar]
- 8.Tuo J, Smith BC, Bojanowski CM, Meleth AD, Gery I, Csaky KG, Chew EY, Chan CC. The involvement of sequence variation and expression of CX3CR1 in the pathogenesis of age-related macular degeneration. FASEB J. 2004;18:1297–9. doi: 10.1096/fj.04-1862fje. [DOI] [PMC free article] [PubMed] [Google Scholar]
- 9.Tuo J, Bojanowski CM, Zhou M, et al. Murine ccl2/cx3cr1 deficiency results in retinal lesions mimicking human age-related macular degeneration. Invest Ophthalmol Vis Sci. 2007;48:3827–36. doi: 10.1167/iovs.07-0051. [DOI] [PMC free article] [PubMed] [Google Scholar]
- 10.Simeoni E, Vassalli G, Seydoux C, Ramsay D, Noll G, von Segesser LK, Fleury S. CCR5, RANTES and CX3CR1 polymorphisms: possible genetic links with acute heart rejection. Transplantation. 2005;80:1309–15. doi: 10.1097/01.tp.0000178378.53616.ca. [DOI] [PubMed] [Google Scholar]
- 11.Cao G, Lu Y, Gao R, Xin Y, Teng D, Wang J, Li Y. Expression of fractalkine, CX3CR1, and vascular endothelial growth factor in human chronic renal allograft rejection. Transplant Proc. 2006;38:1998–2000. doi: 10.1016/j.transproceed.2006.06.081. [DOI] [PubMed] [Google Scholar]
- 12.Umehara H, Tanaka M, Sawaki T, et al. Fractalkine in rheumatoid arthritis and allied conditions. Mod Rheumatol. 2006;16:124–30. doi: 10.1007/s10165-006-0471-9. [DOI] [PubMed] [Google Scholar]
- 13.Murphy G, Caplice N, Molloy M. Fractalkine in rheumatoid arthritis: a review to date. Rheumatology (Oxford) 2008;47:1446–51. doi: 10.1093/rheumatology/ken197. [DOI] [PubMed] [Google Scholar]
- 14.Bolovan-Fritts CA, Spector SA. Endothelial damage from cytomegalovirus-specific host immune response can be prevented by targeted disruption of fractalkine-CX3CR1 interaction. Blood. 2008;111:175–82. doi: 10.1182/blood-2007-08-107730. [DOI] [PMC free article] [PubMed] [Google Scholar]
- 15.Soriano SG, Amaravadi LS, Wang YF, et al. Mice deficient in fractalkine are less susceptible to cerebral ischemia-reperfusion injury. J Neuroimmunol. 2002;2:59–65. doi: 10.1016/s0165-5728(02)00033-4. [DOI] [PubMed] [Google Scholar]
- 16.Sunnemark D, Eltayeb S, Nilsson M, Wallstrom E, Lassmann H, Olsson T, Berg AL, Ericsson-Dahlstrand A. CX3CL1 (fractalkine) and CX3CR1 expression in myelin oligodendrocyte glycoprotein-induced experimental autoimmune encephalomyelitis: kinetics and cellular origin. J Neuroinflammation. 2005;2:17. doi: 10.1186/1742-2094-2-17. [DOI] [PMC free article] [PubMed] [Google Scholar]
- 17.Mizuno T, Kawanokuchi J, Numata K, Suzumura A. Production and neuroprotective functions of fractalkine in the central nervous system. Brain Res. 2003;2:65–70. doi: 10.1016/s0006-8993(03)02867-1. [DOI] [PubMed] [Google Scholar]
- 18.Cardona AE, Pioro EP, Sasse ME, et al. Control of microglial neurotoxicity by the fractalkine receptor. Nat Neurosci. 2006;9:917–24. doi: 10.1038/nn1715. [DOI] [PubMed] [Google Scholar]
- 19.Huang D, Shi FD, Jung S, et al. The neuronal chemokine CX3CL1/fractalkine selectively recruits NK cells that modify experimental autoimmune encephalomyelitis within the central nervous system. FASEB J. 2006;20:896–905. doi: 10.1096/fj.05-5465com. [DOI] [PubMed] [Google Scholar]
- 20.Infante-Duarte C, Waiczies S, Wuerfel J, Zipp F. New developments in understanding and treating neuroinflammation. J Mol Med. 2008;86:975–85. doi: 10.1007/s00109-007-0292-0. [DOI] [PubMed] [Google Scholar]
- 21.Zipp F, Aktas O. The brain as a target of inflammation: common pathways link inflammatory and neurodegenerative diseases. Trends Neurosci. 2006;29:518–27. doi: 10.1016/j.tins.2006.07.006. [DOI] [PubMed] [Google Scholar]
- 22.Morandi B, Bramanti P, Bonaccorsi I, Montalto E, Oliveri D, Pezzino G, Navarra M, Ferlazzo G. Role of natural killer cells in the pathogenesis and progression of multiple sclerosis. Pharmacol Res. 2008;57:1–5. doi: 10.1016/j.phrs.2007.11.003. [DOI] [PubMed] [Google Scholar]
- 23.Flodstrom-Tullberg M, Bryceson YT, Shi FD, Hoglund P, Ljunggren HG. Natural killer cells in human autoimmunity. Curr Opin Immunol. 2009;21:634–40. doi: 10.1016/j.coi.2009.09.012. [DOI] [PubMed] [Google Scholar]
- 24.Infante-Duarte C, Weber A, Kratzschmar J, et al. Frequency of blood CX3CR1-positive natural killer cells correlates with disease activity in multiple sclerosis patients. FASEB J. 2005;19:1902–4. doi: 10.1096/fj.05-3832fje. [DOI] [PubMed] [Google Scholar]
- 25.Molinero LL, Domaica CI, Fuertes MB, Girart MV, Rossi LE, Zwirner NW. Intracellular expression of MICA in activated CD4 T lymphocytes and protection from NK cell-mediated MICA-dependent cytotoxicity. Hum Immunol. 2006;67:170–82. doi: 10.1016/j.humimm.2006.02.010. [DOI] [PubMed] [Google Scholar]
- 26.Cerboni C, Zingoni A, Cippitelli M, Piccoli M, Frati L, Santoni A. Antigen-activated human T lymphocytes express cell-surface NKG2D ligands via an ATM/ATR-dependent mechanism and become susceptible to autologous NK- cell lysis. Blood. 2007;110:606–15. doi: 10.1182/blood-2006-10-052720. [DOI] [PubMed] [Google Scholar]
- 27.Cooper MA, Fehniger TA, Turner SC, Chen KS, Ghaheri BA, Ghayur T, Carson WE, Caligiuri MA. Human natural killer cells: a unique innate immunoregulatory role for the CD56bright subset. Blood. 2001;97:3146–51. doi: 10.1182/blood.v97.10.3146. [DOI] [PubMed] [Google Scholar]
- 28.Vossen MT, Matmati M, Hertoghs KM, et al. CD27 defines phenotypically and functionally different human NK cell subsets. J Immunol. 2008;180:3739–45. doi: 10.4049/jimmunol.180.6.3739. [DOI] [PubMed] [Google Scholar]
- 29.Juelke K, Killig M, Luetke-Eversloh M, et al. CD62L expression identifies a unique subset of polyfunctional CD56dim NK cells. Blood. 2010;116:1299–307. doi: 10.1182/blood-2009-11-253286. [DOI] [PubMed] [Google Scholar]
- 30.Bjorkstrom NK, Riese P, Heuts F, et al. Expression patterns of NKG2A, KIR, and CD57 define a process of CD56dim NK-cell differentiation uncoupled from NK-cell education. Blood. 2010;116:3853–64. doi: 10.1182/blood-2010-04-281675. [DOI] [PubMed] [Google Scholar]
- 31.Lopez-Verges S, Milush JM, Pandey S, et al. CD57 defines a functionally distinct population of mature NK cells in the human CD56dim CD16+ NK-cell subset. Blood. 2010;116:3865–74. doi: 10.1182/blood-2010-04-282301. [DOI] [PMC free article] [PubMed] [Google Scholar]
- 32.Peritt D, Robertson S, Gri G, Showe L, Aste-Amezaga M, Trinchieri G. Differentiation of human NK cells into NK1 and NK2 subsets. J Immunol. 1998;161:5821–4. [PubMed] [Google Scholar]
- 33.Cooper MA, Fehniger TA, Caligiuri MA. The biology of human natural killer-cell subsets. Trends Immunol. 2001;22:633–40. doi: 10.1016/s1471-4906(01)02060-9. [DOI] [PubMed] [Google Scholar]
- 34.Zhang AL, Colmenero P, Purath U, et al. Natural killer cells trigger differentiation of monocytes into dendritic cells. Blood. 2007;110:2484–93. doi: 10.1182/blood-2007-02-076364. [DOI] [PMC free article] [PubMed] [Google Scholar]
- 35.Carson WE, Fehniger TA, Caligiuri MA. CD56bright natural killer cell subsets: characterization of distinct functional responses to interleukin-2 and the c-kit ligand. Eur J Immunol. 1997;27:354–60. doi: 10.1002/eji.1830270203. [DOI] [PubMed] [Google Scholar]
- 36.Yu J, Mao HC, Wei M, et al. CD94 surface density identifies a functional intermediary between the CD56bright and CD56dim human NK-cell subsets. Blood. 2010;115:274–81. doi: 10.1182/blood-2009-04-215491. [DOI] [PMC free article] [PubMed] [Google Scholar]
- 37.Barlic J, Sechler JM, Murphy PM. IL-15 and IL-2 oppositely regulate expression of the chemokine receptor CX3CR1. Blood. 2003;102:3494–503. doi: 10.1182/blood-2003-03-0946. [DOI] [PubMed] [Google Scholar]
- 38.Dunne J, Lynch S, O'Farrelly C, Todryk S, Hegarty JE, Feighery C, Doherty DG. Selective expansion and partial activation of human NK cells and NK receptor-positive T cells by IL-2 and IL-15. J Immunol. 2001;167:3129–38. doi: 10.4049/jimmunol.167.6.3129. [DOI] [PubMed] [Google Scholar]
- 39.Habib T, Nelson A, Kaushansky K. IL-21: a novel IL-2-family lymphokine that modulates B, T, and natural killer cell responses. J Allergy Clin Immunol. 2003;112:1033–45. doi: 10.1016/j.jaci.2003.08.039. [DOI] [PubMed] [Google Scholar]
- 40.Parrish-Novak J, Foster DC, Holly RD, Clegg CH. Interleukin-21 and the IL-21 receptor: novel effectors of NK and T cell responses. J Leukoc Biol. 2002;72:856–63. [PubMed] [Google Scholar]
- 41.de Rham C, Ferrari-Lacraz S, Jendly S, Schneiter G, Dayer JM, Villard J. The proinflammatory cytokines IL-2, IL-15 and IL-21 modulate the repertoire of mature human natural killer cell receptors. Arthritis Res Ther. 2007;9:R125. doi: 10.1186/ar2336. [DOI] [PMC free article] [PubMed] [Google Scholar]
- 42.Chen S, Luo D, Streit WJ, Harrison JK. TGF-β1 upregulates CX3CR1 expression and inhibits fractalkine-stimulated signaling in rat microglia. J Neuroimmunol. 2002;2:46–55. doi: 10.1016/s0165-5728(02)00354-5. [DOI] [PubMed] [Google Scholar]
- 43.Bellone G, Aste-Amezaga M, Trinchieri G, Rodeck U. Regulation of NK cell functions by TGF-β1. J Immunol. 1995;155:1066–73. [PubMed] [Google Scholar]
- 44.Rook AH, Kehrl JH, Wakefield LM, Roberts AB, Sporn MB, Burlington DB, Lane HC, Fauci AS. Effects of transforming growth factor beta on the functions of natural killer cells: depressed cytolytic activity and blunting of interferon responsiveness. J Immunol. 1986;136:3916–20. [PubMed] [Google Scholar]
- 45.Agaugue S, Marcenaro E, Ferranti B, Moretta L, Moretta A. Human natural killer cells exposed to IL-2, IL-12, IL-18, or IL-4 differently modulate priming of naive T cells by monocyte-derived dendritic cells. Blood. 2008;112:1776–83. doi: 10.1182/blood-2008-02-135871. [DOI] [PubMed] [Google Scholar]