

Abstract
Mutans streptococci (MS) are key organisms associated with the etiology of dental caries. Using probabilities that were tested by oversampling, we designed this study to determine the minimal number of MS isolates from an individual required to evaluate diversity of genotypes. MS isolates were genotyped by repetitive extragenic palindromic-polymerase chain-reaction (rep-PCR). Analysis of 20 isolates from individuals resulted in a mean of 1.6 and 2.4 genotypes in children (N = 12) and adults (N = 10), respectively. In a follow-up study, reducing the number of isolates to 7-10 resulted in a theoretical probability of up to 78% for detecting up to 4 genotypes. A mean of 1.5 genotypes was found in 35 children and 10 adults. These findings provide evidence for the design of studies of MS genotyping that can serve as a model for the analysis of genotypes within individuals.
Keywords: Streptococcus mutans, microbial genetics, caries, biostatistics, plaque/plaquebiofilms, genotypes
Introduction
The incidence of dental caries in the US has declined significantly since 1970. Widespread fluoridation has been credited for the majority of this reduction; nevertheless, 70% of children develop active caries by age 17 (Marthaler, 2004). Caries is especially prevalent in certain children from population demographics where access to dental care is poor.
As a means of understanding the infectious nature of caries, the concept of diversity was introduced. “Diversity” refers to the number of genotypes (or phenotypes, i.e., bacteriocin types) within an individual. To identify diversity of the MS group, investigators have used numerous typing methods. Examples of MS and other eubacteria genotyping techniques previously utilized include genomic analysis, pulsed-field gel electrophoresis (PFGE), and polymerase chain-reaction (PCR)-based genomic fingerprinting. PFGE provides useful genotypic profiles, and is considered the gold standard for strain level identification, but is labor-intensive (Alam et al., 1999). One PCR method, repetitive extragenic palindromic-PCR (rep-PCR), amplifies many uniquely sized amplicons representing regions between target-non-coding, repetitive sequences in the genome (Healy et al., 2005). An advantage is that rep-PCR requires as little as 50 ng of DNA to rapidly produce highly specific, sensitive, and consistent gene profiles. Thus, this method provides an efficient means to analyze diversity of MS among populations in longitudinal research (Moser et al., 2010).
A primary challenge in the assessment of oral bacterial genotypes for an individual who may have multiple genotypes is the determination of how many bacterial isolates are required from the individual to provide a representative sampling of the genetic diversity. Numerous genotyping experiments have indicated that most children have fewer than 3 MS genotypes, and adults have fewer than 4 (Emanuelsson et al., 1998; Kozai et al., 1999; Mattos-Graner et al., 2001; Lembo et al., 2007; Mitchell et al., 2009). However, no studies have systematically documented the minimum numbers of isolates required from each individual for an accurate demonstration of the individual’s genetic diversity.
The purpose of this study was to determine the number of genotypes present in an individual by oversampling (i.e., 20 isolates per individual) from a group of children and adults. A genotyping method based on rep-PCR was selected because of its potential not only to produce reliable numbers of MS isolates from large genotypes, but also to allow for the construction of an extensive MS gene library.
Materials & Methods
Participants & Sample Collections
The sample population was a high-caries-risk community in Perry County, Alabama, with no regular access to dental care for children. The study population was drawn from children from kindergarten classes (5-6 yrs old) of a public elementary school. Samples were also collected from a group of adults in this community, who may or may not have been related to the children in this study. The study was approved by the University of Alabama at Birmingham (UAB) Institutional Review Board, with participants and parents of children providing assent (children) and informed consent (parents).
Power Calculations
The study was designed to provide information on the number of specific genotypes from plaque of individuals. Using probability estimates (Fig. 1) based on the assumption that all genotypes are equally distributed among a sample (i.e., such as a plaque sample), then each genotype (k) is equally likely to be collected, and thus to identify each of k genotypes from n samples, the probability (P) is:
Figure 1.
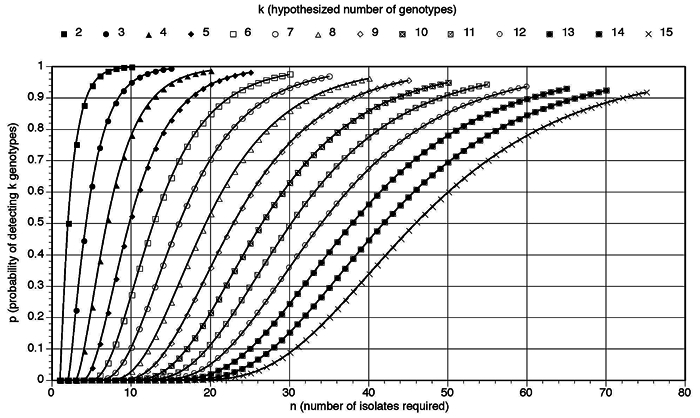
The number of isolates (n) estimated to be required to obtain a probability (p) of observing at least one of each hypothesized genotype (k) using the formula in the Power Calculations section of MATERIALS & METHODS.
Thus, from this equation, it was determined that 20 isolates would be sufficient to provide 99% power of identifying up to 4 genotypes. With 20 isolates, the probability of observing at least 5 genotypes, if they exist, is 94%, and thus, we had ample power to assess whether there were more than 4 genotypes likely to be present.
Isolation of Mutans Streptococci (MS)
We used mesial, distal, buccal, lingual, and occlusal surfaces of multiple primary and/or permanent molars of children to collect pooled plaque samples, using sterile toothpicks, and subsequently transferred samples to 1 mL of reduced transport medium (Syed and Loesche, 1972). Adult plaque samples were pooled from permanent molar teeth. The plaque samples were stored on ice while transported 100 miles to the UAB School of Dentistry in Birmingham, AL. The plaque samples were processed within 24 hrs of collection by vortexing and sonication (Vibra Cell, Sonics & Materials Inc., Newtown, CT, USA) for 30 sec on ice at an amplitude of 50. Samples were serially diluted in 0.05 M potassium phosphate buffer and plated on Mitis Salivarius agar (Difco/Beckton Dickinson, Sparks, MD, USA) containing 200 units/liter of Bacitracin and 20% sucrose (Gold et al., 1973). Bacterial plating was performed with a Spiral plater (Spiral System™ Inc., Cincinnati, OH, USA). Culture plates were incubated at 37°C under anaerobic conditions (80% N2, 10% CO2, 10% H2) for 48 hrs (Lennette et al., 1974).
Individual MS colonies were selected based on morphological appearance for inoculation into Todd-Hewitt Broth (THB) (Beckton Dickinson, Sparks, MD, USA). Isolates were incubated for 24 hrs under anaerobic conditions, then stored at −80°C for future processing. Twenty frozen MS isolates per individual were plated onto Todd-Hewitt Agar (THA) and grown anaerobically at 37°C for 48 hrs. Isolated colonies were then inoculated into THB and incubated anaerobically for 18-24 hrs. All isolates were confirmed MS prior to genotyping by means of SYBR Green real-time PCR according to a method described previously (Yoshida et al., 2003).
Extraction of DNA for rep-PCR
The THB inocula were centrifuged at 2800 rcf for 20 min to pellet cells. THB was removed, and cells were washed by re-suspension in 1 mL of TE buffer (10 mM Tris-HCl, 1 mM EDTA, pH 7.6) followed by centrifugation at 21,000 rcf for 5 min. TE buffer was removed, and final cell pellets were saved at −20°C until ready to be extracted. DNA was extracted with the Ultra Clean™ Microbial DNA Isolation Kit (MoBio Laboratories, Carlsbad, CA, USA). Quantitation of DNA was performed by a Nanodrop 1000 (Thermo Scientific, Wilmington, DE, USA). We controlled the quality of DNA by maintaining a minimum value of 1.7 and 0.9, respectively, for 260/280 ratio and for 260/230 (an estimate of protein contamination).
rep-PCR and DNA Chip Application
Rep-PCR was performed with the DiversiLab streptococcus kit (bioMerieux, Durham, NC, USA) and ABI9700 (Applied Biosystems, Foster City, CA, USA) with a gold block according to the following parameters: initial denaturation of 94°C for 2 min; 35 cycles of denaturation at 94°C for 30 sec; annealing at 50°C for 30 sec; extension at 70°C for 90 sec; and a final extension at 70°C for 3 min. PCR reaction volume was a total 25 µL, including 2 µL of 25-45 ng/µL of purified genomic DNA. DNA amplicons from rep-PCR were separated on microfluidics chips and an Agilent 2100 Bioanalyzer (Agilent Technologies, Palo Alto, CA, USA) with the DNA Chip kit (bioMerieux, Inc., Durham, NC, USA) (Bou et al., 2000; Healy et al., 2005). In addition to sample DNA, a molecular-weight ladder and Ingbritt C (S. mutans positive control) were run on each chip to ensure consistency of results, similar to the method used in an AP-PCR analysis of MS (Li et al., 2001). A negative control was run on the first chip processed for each rep-PCR batch of samples to ensure absence of contamination in the PCR.
Analysis of DNA Fingerprints
Virtual gel images of each strain were generated by DiversiLab v 3.3 software (bioMerieux, Inc., Durham, NC, USA), and the Pearson correlation coefficient method was used to determine distance matrices for similarity calculation of DNA band intensity and location. The unweighted-pair group methodology with arithmetic mean (UPGMA) was utilized to create dendrograms, which provided a hierarchical cluster representation of similarities between samples and indicated strain level groupings of the MS. The criteria used to determine distinct genotypes were defined by rep-PCR results that differed based on major or minor banding differences (i.e., greater than or fewer than 100 fluorescence units, respectively). If two isolates differed by one major band or more than two minor bands, they were distinct (Moser et al., 2010). The DiversiLab Web site stored the reports that were generated and included dendrograms, virtual gel image, electropherograms, and scatter plots to aid in interpretation of the data.
Follow-up Study
Based on the initial analysis of 20 isolates from 12 index children and 10 adults, further analyses were done with samples from 35 additional children and 10 adults, with a smaller number of isolates from each plaque sample, i.e., 7-10 isolates.
Results
All isolates used for rep-PCR were confirmed to be S. mutans by SYBR Green PCR (Yoshida et al., 2003). Representative rep-PCR results illustrating the diversity of genotypes of the individuals are shown in Fig. 2. The Table shows the results of rep-PCR analyses: Twelve child samples with 20 isolates from plaque samples resulted in the observation of five children who had only 1 genotype (42%), while seven had 2 (58%) genotypes (mean = 1.6 genotypes). Three of 10 adults had a single genotype (30%), two had 2 genotypes (20%), four had 3 genotypes (40%), and one had 5 genotypes (10%) (mean = 2.4 genotypes).
Figure 2.
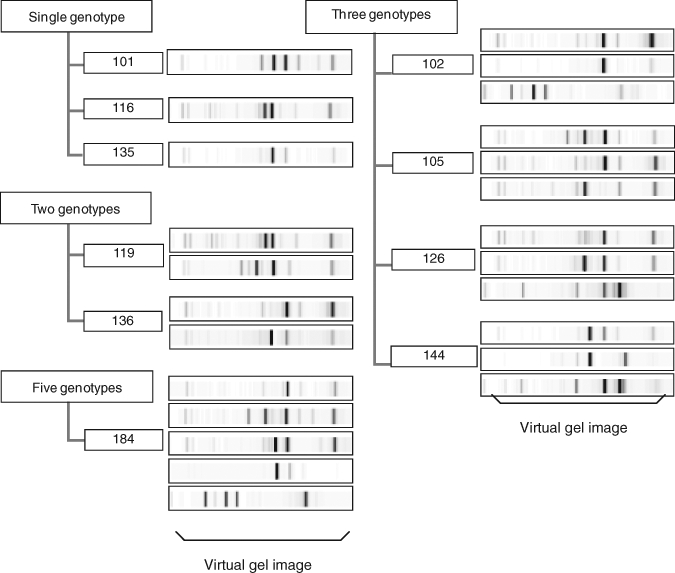
Representative rep-PCR results from 10 individuals who had 20 isolates per individual analyzed. Virtual gel images represent DNA fingerprint patterns of MS isolates that were amplified with the automated rep-PCR system analyzed with DiversiLab software, version 3.3. The numbers identify individuals who participated in this study.
Table.
Diversity of Genotypes by Individuals and Sample Sizes
| 20 MS Isolates of 12 Children and 10 Adults (N = 22, total 440 isolates) | |||||
|---|---|---|---|---|---|
| Number of Genotypes |
1 |
2 |
3 |
5 |
Mean Genotypes |
| Number of children | 5a | 7a | 0 | 0 | 1.6 |
| % individuals in group | 42 | 58 | 0 | 0 | |
| Number of adults | 3b | 2b | 4b | 1b | 2.4 |
| % individuals in group | 30 | 20 | 40 | 10 | |
| Total individuals by genotypes | 8 | 9 | 4 | 1 | 2.0 |
| Overall % of individuals |
36 |
36 |
23 |
5 |
|
| 7-10 Isolates of 35 Children and 10 Adults (N = 45, total 473 isolates) | |||||
| Number of Genotypes |
1 |
2 |
3 |
4 |
Mean Genotypes |
| Number of children | 22a | 10a | 1 | 2 | 1.5 |
| % individuals in group | 63 | 29 | 3 | 6 | |
| Number of adults | 6b | 3b | 1b | 0b | 1.5 |
| % individuals in group | 60 | 30 | 10 | 0 | |
| Total individuals by genotypes | 28 | 13 | 2 | 2 | 1.5 |
| Overall % of individuals | 62 | 29 | 4 | 4 | |
No significant difference between 20 and 7-10 isolates of child groups by Fisher’s exact test (p = 0.3111).
No statistically significant differences between 20 and 7-10 isolates of adult groups by Fisher’s exact test (p = 0.3698).
The predicted numbers of isolates required for the identification of different numbers of genotypes, assuming that the MS are equally distributed in the dental plaque in the oral cavity, are illustrated in Fig. 1. Based on these calculations, the results from the analyses carried out with 20 isolates per sample in children and adults—that is, analysis of 20 isolates—therefore constituted oversampling for the group tested. Further, 7 to 10 isolates were determined to be a reasonable number of isolates to collect per individual (i.e., up to 51 to 78% probability of identifying 4 genotypes when they exist). Thus, based on the findings from the first 12 children and 10 adults, additional isolates from plaque samples collected from 35 additional children and 7 to 10 MS isolates per child (385 total isolates) were analyzed by rep-PCR. This analysis resulted in the identification of 22 children who had a single genotype (63%), 10 had 2 genotypes (29%), one had 3 genotypes (3%), and two had 4 genotypes (6%) (Table). The average number of genotypes from this sample was 1.5 per child. Ten additional adults had plaque samples collected, yielding 7-10 MS isolates (88 total isolates) that were analyzed by rep-PCR. Six of these were found to have 1 genotype (60%), three had 2 genotypes (30%), and one had 3 genotypes (10%), with an average of 1.5 genotypes per adult. No differences were found between 20 and 7-10 isolates with Fisher’s exact test in children (p = 0.3111) and in adults (p = 0.3698).
Discussion
Rep-PCR has been introduced to genomic analysis with numerous benefits over PFGE and AP-PCR. PFGE, which uses restriction enzymes to digest the genome, gel electrophoresis, and pattern analysis by direct DNA staining or DNA hybridization, requires long run times and thus is best only when there are limited sample numbers (Louws et al., 1999). AP-PCR has been utilized to demonstrate the diversity of bacterial genotypes in several scientific fields using arbitrary primers that amplify variable sizes of PCR products, but, due to problems with reproducibility, AP-PCR is not practical for a large longitudinal population study to verify genotype characteristics (Bou et al., 2000; Moser et al., 2010). However, rep-PCR effectively and consistently generates genotypic profiles using a nanogram scale of genomic DNA and is able to compare data longitudinally and potentially between laboratories (Louws et al., 1999; Healy et al., 2005). The findings presented herein demonstrated the usefulness of rep-PCR in identifying genotypic differences of MS (S. mutans) isolated from plaque from children and adults.
The primary objective of this study was to determine the minimal number of isolates required per individual for rep-PCR analysis to demonstrate diversity of MS in a population at a time-point and be confident that more types are not missed. The first approach to this study focused on using 20 isolates per individual to screen the pertinent number of genotypes. From probability computations, assuming 5 or fewer genotypes per individual, 20 isolates were considered to be oversampling of this group of individuals. By oversampling (i.e., 20 isolates), adults were found to have more diversity than children, with a range of 1-5 genotypes and a mean of 2.4 genotypes per person. Therefore, 20-isolate analyses found that, at most, 5 genotypes (adults) were distinguished, but, on average, fewer than 3 were distinguished in children and adults. Had there been 6 genotypes, there was nearly an 85% probability of all 6 being detected. Upon oversampling, analysis of 20 isolates per individual demonstrated an average of fewer than 2 and 3 MS genotypes, respectively for children and adults. This finding is similar to (Li and Caufield, 1995; Kozai et al., 1999) or less than the number of genotypes reported in other studies (i.e., fewer than 3 and 4, respectively, for children and adults) (Emanuelsson et al., 1998; Mattos-Graner et al., 2001; Kohler et al., 2003; Redmo Emanuelsson et al., 2003; Napimoga et al., 2005; Lembo et al., 2007; Liu et al., 2007; Mitchell et al., 2009). These differences may be due to the population of study or the method we used. In this regard, the population that participated in the study was from a high-caries-risk, ‘poor access to dental care’ group of African-Americans. Therefore, the representativeness of this study to other populations, including previous studies that focused on MS genotypes, may explain the differences observed.
The initial pilot data functioned as a model to estimate the power calculation to optimize effective numbers of isolates for an individual. Using the data obtained and referring to the probability figure, we determined that 7-10 isolates was a reasonable number (and more practical than 20 isolates) for testing additional samples. In this regard, 7 isolates would provide 83% power of identifying up to 3 genotypes, while 10 isolates would have 78% power of identifying 4 genotypes; therefore, we continued our analysis with a group of samples from 35 children and 10 adult samples with 7-10 isolates to observe how well the genotypes were identified. The adult samples that had 7 to 10 isolates exhibited a genotype numbers similar to those of both child groups, with 83 to 95% probability of detecting 3 genotypes. Although the data were not statistically different for comparison of 20 and 7-10 isolates, for the adult sets of isolates, there were fewer genotypes identified with the 7-10 isolates as compared with the 20-isolate sampling. Therefore, analysis of the data suggests that sample sizes of 7-10 are sufficient numbers of isolates from younger (i.e., the children in this study) individuals at a single time-point for genetic diversity to be determined. However, further analysis may be indicated to better establish diversity in older individuals (i.e., adults).
In conclusion, MS genotypes within individuals were efficiently analyzed by highly integrated rep-PCR and the microfluidics LabChip® assay to obtain representative genotypes from the oral microflora. By oversampling (20 isolates), the findings support the notion that representative genotypes are also detected by collecting 7-10 MS isolates per sample, especially in 5- to 6-year-old children. These results provide information that will be used in future longitudinal studies as a database of MS genotypes and establishment of a library of genotypes in children and family households. Additionally, the methods using probability estimates provide a useful model for other microbiological studies involving the genetic diversity of indigenous micro-organisms in nature.
Acknowledgments
This investigation was supported by Research Grant DE016684 from the NIDCR and the NIH T32 Dental Academic Research Training (DART) Program (DE017607) (KC). This manuscript was prepared as part of a thesis which will be submitted to the graduate faculty, University of Alabama at Birmingham, School of Dentistry, in partial fulfillment of the requirements for the Master of Science degree. We especially appreciate all the clinical and laboratory participants of this study: Ms. Stephanie McLean, Dr. Bibi Rahima, Ms. Tonya Wiley, Dr. Steve Mitchell, Dr. Sonia Makhija, Dr. Rosalyn Bassett, Ms. Mary Slater, Ms. Frances Jackson, and the pediatric dental residents of the UAB.
References
- Alam S, Brailsford SR, Whiley RA, Beighton D. (1999). PCR-based methods for genotyping viridans group streptococci. J Clin Microbiol 37:2772-2776 [DOI] [PMC free article] [PubMed] [Google Scholar]
- Bou G, Cervero G, Dominguez MA, Quereda C, Martinez-Beltran J. (2000). PCR-based DNA fingerprinting (REP-PCR, AP-PCR) and pulsed-field gel electrophoresis characterization of a nosocomial outbreak caused by imipenem- and meropenem-resistant Acinetobacter baumannii. Clin Microbiol Infect 6:635-643 [DOI] [PubMed] [Google Scholar]
- Emanuelsson IR, Li Y, Bratthall D. (1998). Genotyping shows different strains of mutans streptococci between father and child and within parental pairs in Swedish families. Oral Microbiol Immunol 13:271-277 [DOI] [PubMed] [Google Scholar]
- Gold OG, Jordan HV, Van Houte J. (1973). A selective medium for Streptococcus mutans. Arch Oral Biol 18:1357-1364 [DOI] [PubMed] [Google Scholar]
- Healy M, Huong J, Bittner T, Lising M, Frye S, Raza S, et al. (2005). Microbial DNA typing by automated repetitive-sequence-based PCR. J Clin Microbiol 43:199-207 [DOI] [PMC free article] [PubMed] [Google Scholar]
- Kohler B, Lundberg AB, Birkhed D, Papapanou PN. (2003). Longitudinal study of intrafamilial mutans streptococci ribotypes. Eur J Oral Sci 111:383-389 [DOI] [PubMed] [Google Scholar]
- Kozai K, Nakayama R, Tedjosasongko U, Kuwahara S, Suzuki J, Okada M, et al. (1999). Intrafamilial distribution of mutans streptococci in Japanese families and possibility of father-to-child transmission. Microbiol Immunol 43:99-106 [DOI] [PubMed] [Google Scholar]
- Lembo FL, Longo PL, Ota-Tsuzuki C, Rodrigues CR, Mayer MP. (2007). Genotypic and phenotypic analysis of Streptococcus mutans from different oral cavity sites of caries-free and caries-active children. Oral Microbiol Immunol 22:313-319 [DOI] [PubMed] [Google Scholar]
- Lennette E, Spaulding E, Truant J. (1974). Manual of clinical microbiology. 2nd ed. Washington, DC: American Society for Microbiology [Google Scholar]
- Li Y, Caufield PW. (1995). The fidelity of initial acquisition of mutans streptococci by infants from their mothers. J Dent Res 74:681-685 [DOI] [PubMed] [Google Scholar]
- Li Y, Caufield PW, Emanuelsson IR, Thornqvist E. (2001). Differentiation of Streptococcus mutans and Streptococcus sobrinus via genotypic and phenotypic profiles from three different populations. Oral Microbiol Immunol 16:16-23 [DOI] [PubMed] [Google Scholar]
- Liu Y, Zou J, Shang R, Zhou XD. (2007). Genotypic diversity of Streptococcus mutans in 3- to 4-year-old Chinese nursery children suggests horizontal transmission. Arch Oral Biol 52:876-881 [DOI] [PubMed] [Google Scholar]
- Louws F, Rademaker J, de Bruijn F. (1999). The three Ds of PCR-based genomic analysis of phytobacteria: diversity, detection, and disease diagnosis. Annu Rev Phytopathol 37:81-125 [DOI] [PubMed] [Google Scholar]
- Marthaler TM. (2004). Changes in dental caries 1953-2003. Caries Res 38:173-181 [DOI] [PubMed] [Google Scholar]
- Mattos-Graner RO, Li Y, Caufield PW, Duncan M, Smith DJ. (2001). Genotypic diversity of mutans streptococci in Brazilian nursery children suggests horizontal transmission. J Clin Microbiol 39:2313-2316 [DOI] [PMC free article] [PubMed] [Google Scholar]
- Mitchell SC, Ruby JD, Moser S, Momeni S, Smith A, Osgood R, et al. (2009). Maternal transmission of mutans streptococci in severe-early childhood caries. Pediatr Dent 31:193-201 [PMC free article] [PubMed] [Google Scholar]
- Moser SA, Mitchell SC, Ruby JD, Momeni S, Osgood RC, Whiddon J, et al. (2010). Repetitive extragenic palindromic PCR for study of Streptococcus mutans diversity and transmission in human populations. J Clin Microbiol 48:599-602 [DOI] [PMC free article] [PubMed] [Google Scholar]
- Napimoga MH, Höfling JF, Klein MI, Kamiya RU, Gonçalves RB. (2005). Transmission, diversity and virulence factors of Streptococcus mutans genotypes. J Oral Sci 47:59-64 [DOI] [PubMed] [Google Scholar]
- Redmo Emanuelsson IM, Carlsson P, Hamberg K, Bratthall D. (2003). Tracing genotypes of mutans streptococci on tooth sites by random amplified polymorphic DNA (RAPD) analysis. Oral Microbiol Immunol 18:24-29 [DOI] [PubMed] [Google Scholar]
- Syed SA, Loesche WJ. (1972). Survival of human dental plaque flora in various transport media. Appl Microbiol 24:638-644 [DOI] [PMC free article] [PubMed] [Google Scholar]
- Yoshida A, Suzuki N, Nakano Y, Kawada M, Oho T, Koga T. (2003). Development of a 5′ nuclease-based real-time PCR assay for quantitative detection of cariogenic dental pathogens Streptococcus mutans and Streptococcus sobrinus. J Clin Microbiol 41:4438-4441 [DOI] [PMC free article] [PubMed] [Google Scholar]