Abstract
This paper reports the use of a two-dimensional (2D) capacitive micro-machined ultrasound transducer (CMUT) to acquire radio frequency (RF) echo data from relatively large volumes of a simple ultrasound phantom to compare 3D elasticity imaging methods. Typical 2D motion tracking for elasticity image formation was compared to three different methods of 3D motion tracking, with sum-squared difference (SSD) used as the similarity measure. Differences among the algorithms were the degree to which they tracked elevational motion: not at all (2D search), planar search, combination of multiple planes, and plane independent guided search. The cross correlation between the pre-deformation and motion-compensated post-deformation RF echo fields was used to quantify motion tracking accuracy. The lesion contrast-to-noise ratio was used to quantify image quality. Tracking accuracy and strain image quality generally improved with increased tracking sophistication. When used as input for a 3D modulus reconstruction, high quality 3D displacement estimates yielded accurate and low noise modulus reconstruction.
Keywords: 3D Motion Tracking, CMUT, Strain Imaging, Modulus Reconstruction, Elasticity Imaging, Speckle Tracking
Introduction
Strain imaging has shown promise in differentiating breast tumors (Garra et al. 1997). A multi-institution study on breast elastography concluded that viewing axial strain images along with conventional ultrasound images aids in differentiation between malignant and benign solid breast masses (Burnside et al. 2007). One-dimensional (1D) and 1.25D array transducers (Wildes et al. 1997) are the standard for most ultrasound imaging applications. 2D strain images can be readily formed from radio frequency (RF) data acquired with these transducers by obtaining an RF echo frame, deforming the tissue, obtaining another RF frame, and then tracking the motion that occurred among those two frames of RF data. Echo signal decorrelation limits the ability to track motion among frames of RF echo data. A major source of signal decorrelation is out-of-plane motion (motion that is perpendicular to the imaging plane) (Insana et al. 1997; Chen et al. 2005; Rao and Varghese 2008). Thus, it is highly desirable to acquire volumetric data to better track tissue motion, as well as to view the lesion in multiple parallel planes and/or perpendicular planes to further aid with diagnosis. When trying to include a third spatial dimension in strain imaging, two major problems arise: obtaining a 3D data set, and tracking motion between 3D data sets.
Various methods have been used to obtain a volume of 3D RF data with varying amounts of success. Translating a 1D array in the elevation direction may be the simplest to do, but creating volumes without plane-to-plane rotation or shear motion is difficult. Insana et al. (1997), Deprez et al. (2009), and Richards et al. (2009), used laboratory fixtures to scan a rectangular phantom for 3D tracking, but this approach has limited clinical applicability. Lindop et al. (2006), used an optical position sensor to track the position of the 1D ultrasound transducer and place the acquired 2D data within a 3D volume. The transducer was moved in the elevation direction acquiring about 3 cm of data in 10 seconds (Lindop et al. 2006). Significant artifacts were apparent when viewing the strain volume in the perpendicular direction. Sweeping a 1D array in the elevation direction with transducers such as the Siemens C7F2 provides data points in a curvilinear grid with non-uniform spacing. This curvilinear sampling also adds an element of complexity that ideally would be avoided. There is a tradeoff with these devices between spatial and temporal sampling that results (potentially) in spatial over-sampling in some areas and under-sampling (for motion tracking) in others, though recent advances with rocked arrays have been promising (Fisher et al. 2007; Bharat et al. 2008; Treece et al. 2008). The GE system used in Treece's work has the advantage of relatively fast acquisition times (Treece et al. 2008), while the Siemens system used in Bharat's work has the advantage of using a clinical transducer with the stepper motor as an integral part of the transducer handle that is controlled directly by the ultrasound machine (Bharat et al. 2008). Both systems suffer from a fixed elevational focus and mechanical steering of the beam in the elevation direction. That approach is inherently slower than a system that uses electronic steering since mechanical steering cannot utilize parallel receive beams in the elevation direction.
Other methods of acquiring a volume include using a 1.5D array with stepping of the aperture in elevation or using a 1.75D array (Wildes et al. 1997) with steering the beam in elevation. With these techniques, a few scan planes could be acquired, but an appreciable volume cannot be obtained (Konofagou and Ophir 2000). 2D arrays show promise for acquiring a 3D volume. Simulations of 1.5D (Konofagou and Ophir 2000) and 2D transducers (Konofagou and Ophir 2000; Chen et al. 2005) have been performed for various applications. 2D piezoelectric transducers have been manufactured for cardiac applications (Ramm et al. 1991), but the relatively low operating frequency and small aperture of these transducers is not well suited for breast imaging. The advent of capacitive micro-machined ultrasound transducers (CMUTs) has created an opportunity to manufacture reliable, relatively low cost 2D array systems with the ability to obtain high frequency rectilinear 3D data quickly and easily (Oralkan 2003; Daft 2005).
Block-matching algorithms (BMA) are an efficient way to track relative motion due to the fact that the heuristic search is performed only in limited regions, with a priori knowledge, and not the entire image (Zhu and Hall 2002; Chen and Varghese 2009). A normalized cross correlation (NCC) metric has proven popular for motion tracking, but the high computational cost makes surrogate metrics desirable. Sum-squared difference (SSD), sum-absolute difference (SAD), and other metrics (Viola and Walker 2003) have been implemented for motion tracking with lower computational cost and higher speed image formation compared to NCC.
When presented with 3D RF data, 1D, 2D, or 3D tracking can be performed to estimate motion. 1D (Dotti et al. 1976), 2D (Morrison et al. 1983; Trahey et al. 1987) and 3D (Bashford and vonRamm 1996) tracking were first used in ultrasound to track blood flow as an alternate method to Doppler or to compensate for unwanted physiological motion. 1D tracking (Wilson and Robinson 1982; Bonnefous and Pesque 1986; Ophir et al. 1991) is an application of the simple 1D time delay estimation problem (Carter 1987) to motion tracking. With axial deformation, 1D motion tracking estimates the dominant motion along the acoustic beam direction. This approach ignores the fact that a stress applied to any surface of a 3D object generally results in 3D motion. 1D tracking is accurate provided the off-axis motion is well within the width of the given acoustic beam, but it suffers from significant decorrelation error (due to 3D motion). 2D tracking (Morrison et al. 1983; Zhu and Hall 2002; Chen et al. 2009) recognizes the limitation of 1D tracking and tracks motion within the restrictions of the data available from a 1D array transducer. Two dimensional tracking has demonstrated the ability to track relatively large deformations (>2% strain) in simple media (Chaturvedi et al. 1998). For a review of the early history of 1D and 2D motion tracking in elastography see Hein and O'Brien (1993).
3D tracking has been used to create a 2D strain image (Insana et al. 1997; Konofagou and Ophir 2000; Chen et al. 2005) that is higher in quality than can be obtained with 2D tracking. 3D strain volumes have also been formed for deformations of approximately 0.1% (Bharat et al. 2008), 0.5% (Lindop et al. 2006), and 1% (Treece et al. 2008).
We present here 2D and 3D strain images acquired with a 2D CMUT array and compare the performance of several different motion tracking strategies. The accuracy of the displacement estimates (i.e. registration of the pre- and post-deformation RF signals) is measured by comparing cross correlation between the pre-deformation and motion-compensated post-deformation RF echo signal. The quality of the resulting strain image is measured by the contrast to noise ratio metric. As a particularly demanding test of displacement field accuracy, the modulus distribution within the phantom was reconstructed from the measured displacement fields. Modulus inversion is sensitive to the noise and therefore is a good test for the data quality (Zhu et al. 2003; Oberai et al. 2004). The inverse elasticity problem is solved to recover the shear modulus distribution within the imaged volume of the phantom using the methods described in Richards et al. (2009). The strain presented in this paper is the absolute magnitude of the axial strain and unless otherwise noted, “strain” and “axial strain” have been used interchangeably.
Materials and Methods
Experiment
A prototype 9-MHz 2D CMUT array (see Fig. 1) connected to a Siemens SONOLINE™ Antares (Siemens Health Care, Inc. Ultrasound Division, Mountain View, CA) was used to acquire RF echo data from a 100mm × 100mm × 70mm oil-in-gelatin phantom containing two 10mm diameter spherical inclusions that have a 5:1 elastic contrast with the background (Madsen et al. 2003; Madsen et al. 2006). The phantom was also constructed to be nearly incompressible. The prototype transducer [described by Daft et al. (2005)] is a 2D array of CMUT cells where the cells are energized by electrodes on opposing surfaces. On one surface, the electrodes consist of a 1D array of 192 electrodes in the lateral direction. On the opposing surface, the electrodes consist of a 1D array of 280 electrodes in the elevation direction. It measures 40mm laterally by 30mm in elevation. The electrodes in the lateral direction are connected via high-pass filters to the ultrasound front-end for conventional 1D array beam forming and image formation and to ground via low-pass filters. The electrodes in the elevation direction are connected to voltage bias circuits via low-pass filters and to ground via high-pass filters. The bias circuits control which cells are active and the voltage polarity also controls the polarity of the signals from the cells. This allows the CMUT array to operate as a typical 1D linear array for an individual azimuthal scan plane (nominally operating like the Siemens VF13-5 transducer) and bias circuits are used to move the scan plane in elevation with the polarity of the voltage bias controlled to implement a Fresnel lens (Daft et al. 2003) to focus in elevation. An estimate of the pulse-echo beam width near the center of the spherical target (-6dB width is 0.4mm laterally and 0.6mm in elevation) was obtained from the cross correlation of RF lines of data from the uniform speckle field of the phantom used in this work. The ultrasound system was used to acquire 140 image planes with 312 lines/plane of RF data (119 μm spacing). The elevation aperture is stepped sequentially by the bias circuitry between each image plane to obtain parallel scan planes (214μm spacing) thus acquiring a 3D volume of RF echo data for a 40mm (axial) × 37mm (lateral) × 30mm (elevation) volume. Volume acquisition took about 3 seconds.
Fig. 1.
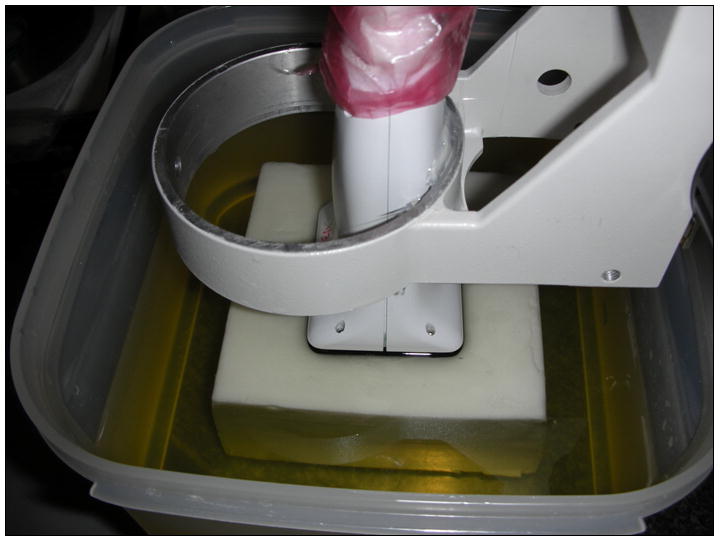
A photograph of the 2D capacitive micro-machined ultrasound transducer (CMUT) above the elasticity phantom. The transducer is attached to a fixture that can be moved in the axial direction in order for the transducer to compress the phantom.
The transducer was mounted in a fixture, and nine volumes of RF data were acquired. An initial deformation of about 2% axial strain was applied to establish contact between the transducer and phantom surface. Between each volume acquisition, a controlled axial deformation of 3mm (resulting in volume average strains between 1% and 2%) was applied to the phantom. This resulted in eight strain volumes and about 13% total strain applied to the phantom. The deformation step size choice is a tradeoff between low displacement signal at low deformations, and greater chance of motion tracking errors at high deformation. A 2% axial strain is a good compromise for phantom experiments like ours. The phantom was free to move in either the lateral or elevation directions when compressed.
Tracking Algorithms
Motion in the phantom was tracked with off-line data processing using four approaches: 2D block matching in single planes (pairing the same pre- and post-deformation planes; z = z′ in Fig. 2), 3D tracking in the ‘best’ plane (select pairing of pre- and post-deformation planes), 3D tracking combining block matching results from two planes, and 3D lateral guidance tracking. The first three methods use 2D lateral guidance (Jiang and Hall 2006; Jiang and Hall 2007) with a 2D kernel. The 3D lateral guidance method (Jiang and Hall 2006; Jiang and Hall 2007) employed a 2D kernel with a 3D search. More details on each of these tracking strategies follow.
Fig. 2.
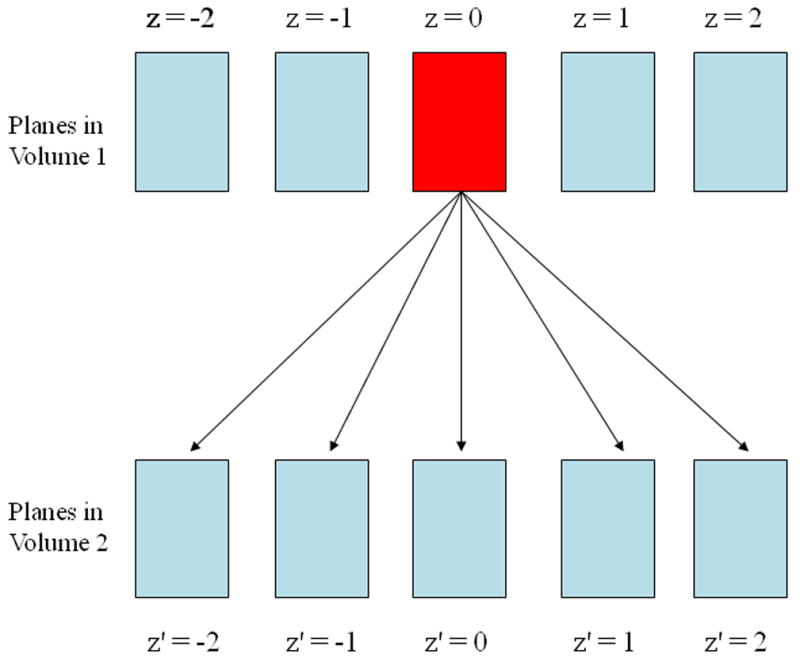
A plane in the reference radio frequency (RF) data is compared to multiple planes in the deformed volume. Multiple SSD maps are obtained. This is used for the best plane and multi-plane tracking techniques.
The 2D block matching algorithm
The 2D lateral guidance algorithm used in this work (Jiang and Hall 2006; Jiang and Hall 2007) employs a predictive search strategy, similar to that previously described (Zhu and Hall 2002). The concept assumes that an estimated displacement vector in one spatial location can be used to guide speckle tracking in the immediate neighborhood because of the continuity of tissue motion and spatial correlation of the RF echo data. The lateral guidance search strategy uses a two step process for motion tracking.
The first step performs a search using the SSD cost function with relatively large 2D (approx. 1mm long by 1mm wide) tracking kernels along the central column of the 3D ROI. Instead of selecting the minimum SSD value for each search region, as in typical block matching algorithms, the Viterbi algorithm (Viterbi 1967) is used to efficiently minimize a cost function among all possible displacement estimates for a short segment (approximately 5mm long) along the central column. The cost function (Jiang and Hall 2009) is
| (1) |
Where α is an adaptively chosen scale factor, Ec is a measure of speckle similarity that is minimized with high speckle similarity and Es is a measure of motion smoothness that is minimized with high motion continuity (Jiang and Hall 2009). For each displacement vector, the continuity cost is estimated by computing the gradient of the displacement vector using a forward finite difference scheme. The anisotropy of lateral versus axial tracking accuracy is not considered in the current implementation and is a subject of ongoing research.
In the second step, the initial column of displacement estimates is used to predict displacements for the adjacent, spatially correlated A-line. This prediction allows the search region to be reduced to a 3×3 RF sample grid thereby drastically improving computational efficiency. The axial separation of the coordinates between adjacent displacement estimates is 16 RF samples. On the 3×3 grid, the differences in the axial displacements between adjacent estimates is ±1 sample for a maximum local axial strain of 1/16 or about 6% (Zhu and Hall 2002). Smaller search kernels (0.2mm long and 1mm wide) are used in this step to improve tolerance to local signal decorrelation. Sub-sample estimates are obtained by quadratic fitting of the correlation function separately for each direction. At this point, the motion tracking task can be split into two processors in parallel requiring no inter-process communication.
For simple 2D tracking, deformation in the third dimension is ignored and pre- and post-deformation planes of RF data are paired sequentially. The 2D lateral guidance algorithm also forms the basis for the first two 3D motion tracking techniques.
The 3D best plane tracking algorithm
This algorithm is a simple extension of the 2D lateral guidance algorithm. A 2D plane of RF data, z, is selected from the reference data set. The SSD values are computed for the corresponding search regions in the deformed RF data plane, z′, just as in the 2D lateral guidance algorithm. The SSD cost function was used in 3D tracking because it is a good compromise between speed and accuracy of the estimates (Viola and Walker 2003). The minimum SSD value for each search region was stored for later comparison. The 2D block matching was repeated with the same reference plane and different post-deformation planes (see Fig. 2) to obtain sets of different displacement estimates, dyZ,Z′, dyZ,Z,+1, etc. and different SSD maps, SSDZ,Z′, SSDZ,Z′+1, etc. While the number of post-deformation reference planes could include every plane in the volume, we found that five post-deformation planes was an ample number to search for this data set.
SSD values were compared for corresponding search regions among the multiple planes of post-deformation data (see Fig. 3). A counter was associated with each of the post-deformation RF data planes. The counter was incremented for the plane with the lowest SSD value (among planes) in a particular search region. After completing searches in the entire 2D plane, the RF plane that had the highest counter value was then deemed the “best plane” and the displacement estimates obtained in that plane were then used to generate a strain image. This was repeated for all planes in the reference RF data volume to obtain a volume of strain data.
Fig. 3.
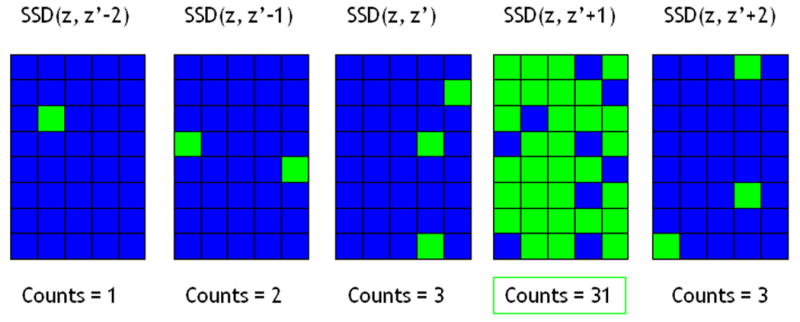
This illustration shows how the sum-squared difference (SSD) map with the most “counts” is deemed the “best plane” and displacement estimates from that plane are used to obtain a strain image. Bright green blocks symbolize a “match” (count) for lowest SSD value for that search region as compared to the other SSD maps. Real data is much more densely populated.
The 3D best plane motion tracking method works well when there is translation or uniform strain in the elevation direction. It does not track well where there is significant non-uniform motion in the elevation direction (e.g., due to tissue inhomogeneity and boundary conditions). For most planes, the number of ‘counts’ in one plane was at least an order of magnitude more than the second-best plane. But sometimes the second best plane had a large region with lower SSD values than the best plane.
The 3D multi-plane tracking algorithm
This algorithm is also an extension of the 2D lateral guidance algorithm and also searches for the minimum SSD values in corresponding search regions for several adjacent planes of RF data. However, a single plane of displacement estimates was constructed from a combination of the displacement estimates from the plane with the largest number of minimum SSD values (the “best plane”) and the displacement estimates from the second-best plane in the region where it had lower SSD values than the best plane. This algorithm is designed to tolerate limited elevational shear and rotation motion. Some of the data from this phantom experiment appeared to demonstrate relative movement between the top and bottom of the phantom in the elevation direction for which this algorithm is well-suited.
The 3D lateral guidance tracking algorithm
This algorithm is a logical extension of the 2D lateral guidance algorithm. An initial search was performed along an a-line near the center of the volume of RF echo data using a relatively large (approx. 1mm long by 1mm wide) 2D tracking kernel from the reference volume to perform a 3D search in the post-deformation volume. The SSD values in each search region are stored and the Viterbi algorithm (Viterbi 1967) is used to efficiently minimize the cost function (Eqn. 1) among all possible displacement estimates (axial, lateral, and elevation) for that segment (step 1 in Fig. 4). The resulting 3D displacement vector is used to predict displacements of adjacent RF samples in the elevation plane (step 2 in Fig. 4), using relatively small 2D tracking kernels (0.2mm long and 1mm wide) similar to the 2D guided search, but with a 3×3×3 (3D) search region. The resulting axial-elevation plane of displacement estimates is then used to similarly predict displacements for the adjacent RF echo data in the lateral directions (step 3 in Fig 4). This is also performed using 3×3×3 (3D) search regions and 2D tracking kernels. In each step, the axial, lateral, and elevation displacements are computed for that location.
Fig. 4.
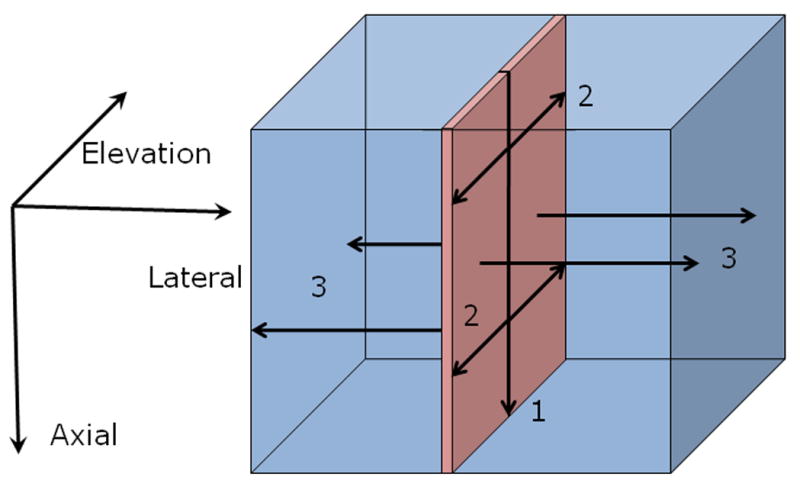
This illistration shows how the motion is tracked using the 3D lateral guidance tracking. The first step involves getting a single vector of high quality 3D displacement estimates using the Viterbi algorithm. The second step involves using these displacements to guide the search for the 3D displacements in neighboring RF data in the axial-elevational plane. Once the plane has been computed, the third step uses the previous estimates as a guide to search for the adjacent displacement estimates in the axial-lateral planes.
The last step is the same for all four algorithms. After the displacement estimates were calculated, axial strain is computed from the axial displacement estimates by determining the slope of axial displacements, in a least square sense, over a 2mm linear regression window. This is done for each A-line (Kallel and Ophir 1997).
The axial strain is used because the tracking in the axial direction is less noisy than the other directions. This is due to several facts. The RF echo signal is more densely sampled in the axial direction (samples are separated by 0.019mm × 0.128mm × 0.214mm in the axial, lateral, and elevation directions respectively). More significantly, the echo signal in the axial direction has modulation at a carrier frequency whereas the RF echo signal in the lateral and elevation direction vary only with an amplitude envelope. Experiments are generally performed so that the dominate motion is in the axial direction. These cause the axial displacement estimates to have a higher signal, and less noise, than the lateral or elevation displacement estimates. The search in the lateral and elevation directions was only used to track the appropriate sample volume (kernel) and obtain higher quality axial displacements.
Data Analysis and Processing
Motion tracking can be thought of as finding a transformation, T, that maximizes the similarity between two sets of RF data, the reference volume, αijk and the post deformation volume βijk. The aforementioned algorithms do this with different block matching strategies. By applying the displacement estimates to the deformed data T(βijk) and remapping to the coordinates of the reference data, we can register the two volumes with apparent deformations. The zero lag NCC between the reference RF echo data and this motion-compensated post-deformation RF data was used as a similarity measure between the two registered volumes of ultrasound data.
| (2) |
Where M, N, and P denote the height, width and depth of the volume. A higher NCC value between two volumes implies that two volumes with apparent deformations are better registered. Hence, it may be surmised that displacement estimates between the two RF volumes that are used for image registration are more accurate (Jiang et al. 2006; Jiang et al. 2007). This procedure was applied to each pair of reference and (consecutive) post-deformation echo fields from the experiment and the displacement fields from each of the motion tracking algorithms. This estimated NCC differs from the theoretically-predicted NCC in that it takes into consideration large displacement errors and unrecoverable deformations by rigid tracking kernels as well as the unrecoverable jitter errors (Walker and Trahey 1995).
The contrast to noise ratio (CNR) was chosen as a metric to judge the image quality. In order to compute the CNR, a region of interest (ROI) of the inclusion needed to be found as well as a ROI for the background. In order to take into consideration the quality of the entire image, it was decided to use the entire volume of the inclusion as our ROI with the background ROI being the rest of the image. The CNR between the inclusion and the background was calculated using:
| (3) |
Where ssph and sbkg are the average strain in the sphere and the background, respectively, σ is the corresponding strain standard deviation, and w is a weighting of the area of the sphere and the background to the total area given by wx = areax/areatotal. The inclusion of the weighted areas is necessary because the area of the sphere and the background are dissimilar and therefore contribute in different amounts to the noise estimate (Song et al. 2004). This CNR metric was chosen rather than the CNR metric presented in (Varghese and Ophir 1998; Bilgen 1999) because the classic metric does not take into consideration the effects of having differing size ROIs.
A semiautomatic segmentation algorithm was used to compute the ROI of the sphere. While segmentation is not the focus of this paper, the methods used here are briefly presented. Adjacent planes in the elevation direction were highly correlated. In an effort to reduce strain image noise and obtain a more reliable segmentation, in-plane strain values were averaged with strain values from the two immediately adjacent planes. In order to further reduce noise, a level set operation (Osher and Fedkiw 2003) was performed. A ‘force’ that is proportional to the mean curvature at a point is applied to the data at that point. Using this approach for several iterations, the 3D strain function, φ(x,y,z) becomes a 4D function, φ(x,y,z,t). The level set equation is given by
| (3) |
where φ is the function we are evolving (the strain), φt is the partial derivative of our function with respect to time, b is a constant that specifies how much the ‘force’ of the mean curvature affects the function, and k is the mean curvature of the function. The original strain volume is set at time t = 0, and evolved from there using a simple iterative process. A decision must be made to pick the 3D volume at a certain time where the data is sufficiently smoothed, but the overall shape of the image is not distorted (Osher and Fedkiw 2003).
Segmentation was performed using thresholding to obtain a mask of the possible inclusion. Morphological dilations and erosions were used to refine the mask. Dilation and erosion involve passing a structuring element over each pixel in the image. The structuring element is a construct that defines the neighborhood around the pixel of interest. In a morphological dilation the output pixel value is set to the maximum pixel value in the neighborhood of the input pixel. In a morphological erosion, the output pixel value is set to the minimum pixel value in the neighborhood of the input pixel. By using different combinations of dilations and erosions with different structuring elements, we were able to distinguish the inclusion from surrounding background, fill holes in the inclusion, and to disconnect “unphysical” areas of the mask (Gonzalez and Woods 1992).
Displacement estimates from the motion tracking algorithm are used to recover the shear elastic modulus distribution of the deforming material by solving the 3D inverse problem as an optimization problem. Details of this algorithm can be found in Richards et al. (2009). The inversion is solved by minimizing the difference in the estimated displacement (full 3D vector field) and that predicted by an incompressible, linear elastic model. This method utilizes finite element interpolations, the adjoint method for gradient evaluations and a quasi-Newton BFGS method of optimization. Total variation diminishing regularization was used, consistent with prior knowledge that the sought field was piecewise constant. The regularization parameter was subjectively chosen to be the value which minimized the noise in the reconstruction, while maximizing the resulting contrast (Richards et al. 2009).
Results
Generally the 3D best plane method provided a significant improvement in motion tracking accuracy over the 2D lateral guidance algorithm. The 3D multi-plane algorithm provided a small improvement over the 3D best plane method. The 3D lateral guidance algorithm provided further improvement over the other algorithms.
Fig. 5 shows example 2D strain images obtained, nominally, with the same data planes for each of the 4 motion tracking methods. Subjective improvement in image quality is demonstrated with increasing complexity of the motion tracking algorithm. A region of interest (2.53cm × 2.24cm × 1.61cm lateral, axial, and elevation respectively) was selected from the RF data to obtain strain images. A strain volume is visualized in Fig. 6 with 3 different orthogonal planes intersecting the inclusion.
Fig. 5.
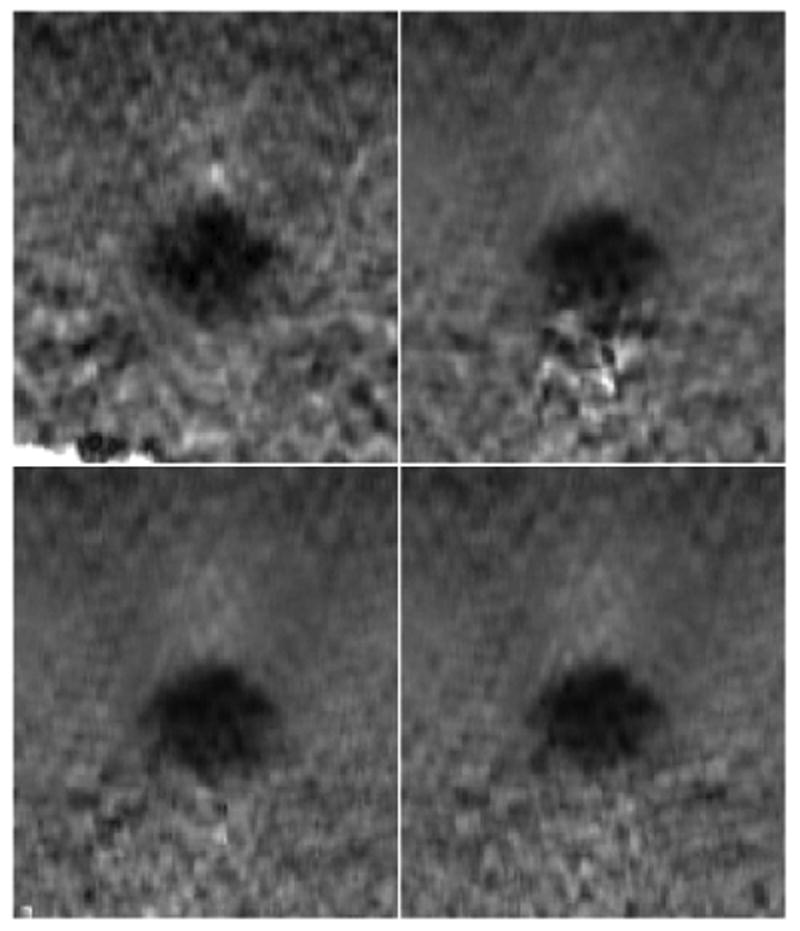
Strain images from strain volume 5, plane 69. This plane is toward the edge of inclusion. Increased contrast-to-noise ratio (CNR) was seen with increasing tracking complexity. The 2D tracking (CNR of 1.96) (top left), 3D best plane (CNR of 2.92) (top right), 3D mutli-plane (CNR of 3.30) (bottom left), and 3D lateral guidance (CNR of 3.37) (bottom right) are shown. Physical dimensions of each strain image are 2.53cm laterally and 2.24cm axially.
Fig. 6.
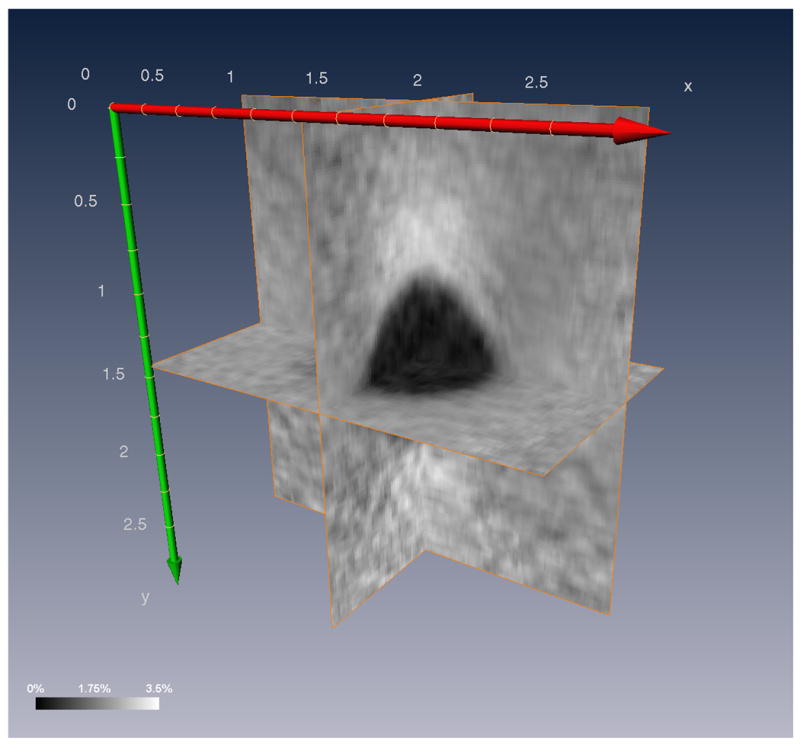
Orthogonal planes on strain volume 8 obtained using the 3D lateral guidance algorithm. Units are in centimeters.
The NCC between the motion-compensated RF data and the reference data (including the entire region of interest) are shown in Fig. 7. Among the set of deformation data, the mean NCC and their standard deviations are 0.735 ± 0.097, 0.852 ± 0.025, 0.864 ± 0.025, and 0.897 ± 0.030 for the 2D lateral guidance, 3D best plane, 3D multi-plane, and 3D lateral guidance tracking methods, respectively, demonstrating an improvement in motion tracking accuracy with an increasingly sophisticated tracking algorithm.
Fig. 7.
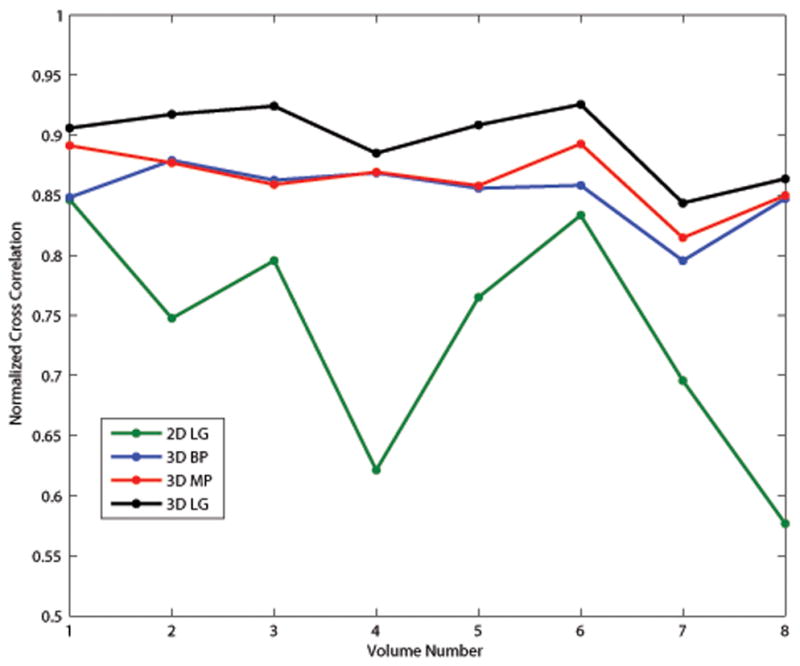
Normalized Cross correlation over the entire volume between the motion-compensated deformed RF data and the reference RF data.
The CNR was calculated for each strain image from each of the motion tracking algorithms and the results are shown in Fig. 8. The 3D lateral guidance algorithm performed better than the other algorithms for all eight volumes and provided the most consistent CNR values among the 3D algorithms. Among the set of deformation data, the mean CNR and their standard deviations are 1.68±0.52, 2.93±0.86, 3.06±0.88, 3.49±0.64 for the 2D lateral guidance, 3D best plane, 3D multi-plane, and 3D lateral guidance tracking respectively.
Fig. 8.
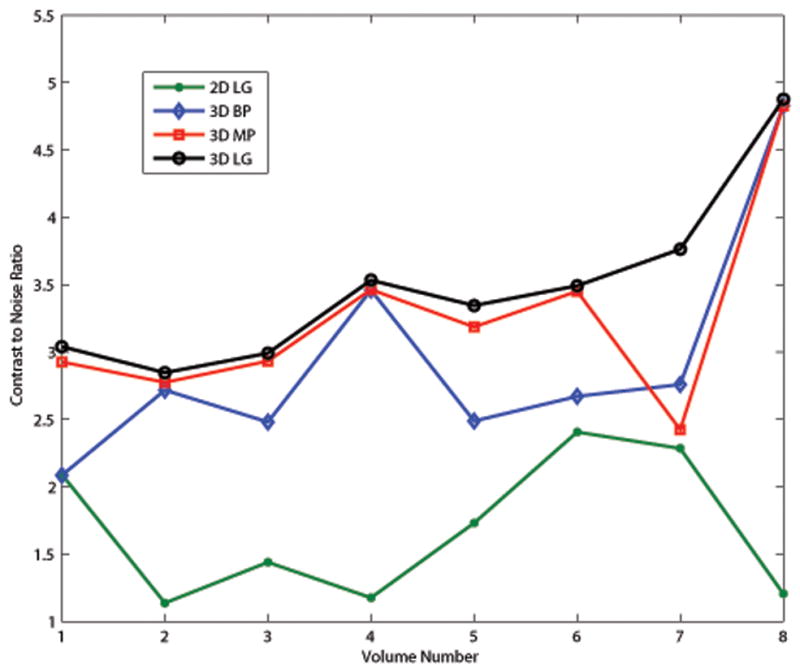
Contrast to noise ratio for different algorithms for the eight strain volumes. Differences between the 2D lateral guidance and the 3D best plane lines indicate an overall elevational translation. Differences between the 3D best plane and the 3D mutli-plane indicate a non-uniform elevational motion such as an elevation shear or rotation. The 3D lateral guidance performs on par with the 3D multi-plane and is more robust as shown in volume 7.
A 3D shear modulus image, reconstructed using the 3D lateral guidance displacement estimates and the inverse elasticity algorithm is shown in Fig. 9. The peak modulus contrast in the inclusion is 4.6, which corresponds well with the expected value of 5. For a threshold modulus contrast of 2, the size of the inclusion is approximately 0.54cm3, which also corresponded well with the expected inclusion volume.
Fig. 9.
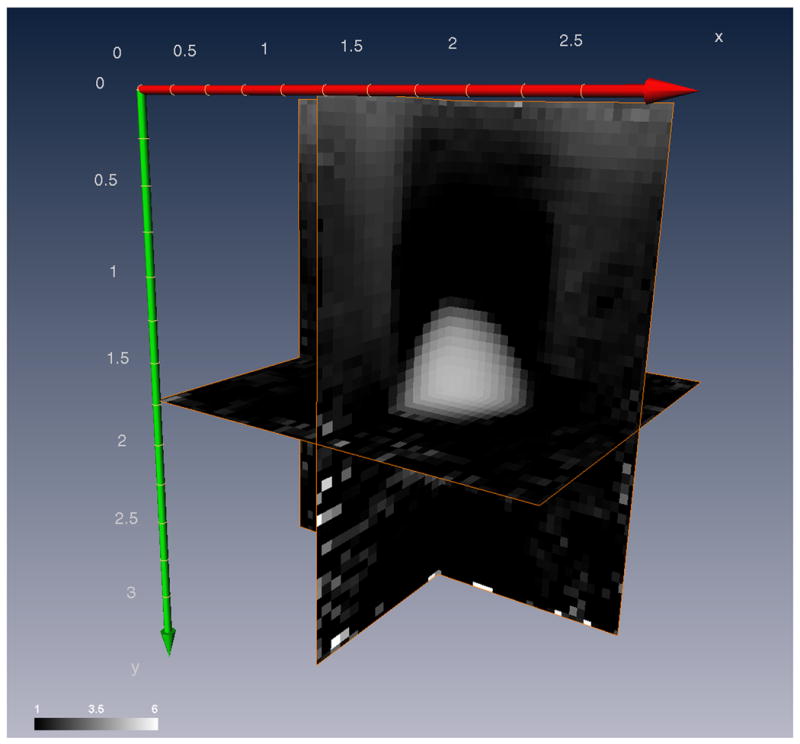
Orthogonal planes of the shear modulus volume obtained using the 3D lateral guidance displacement estimates and elasticity inversion algorithm. Units are in centimeters.
Discussion
Estimated Volume of the Inclusion
During segmentation, we tried to match the volume of the segmented lesion to the known volume of the inclusion (sphere with a 1.0cm diameter, volume of 0.524cm3). The auto-segmentation algorithm is dependent on a threshold strain value for determining the sphere boundary which results in threshold dependent volume estimates. Fig. 10 shows the estimated volume of the inclusion for three threshold values and for each deformation using the 3D lateral guidance tracking algorithm. Increasing the threshold included more voxels around the perimeter of the sphere increasing the estimated volume of the segmented lesion. Increasing the threshold value effectively increased the estimated volume of the inclusion without significantly altering the overall shape of the graph. Each strain volume had a slightly different frame average strain. Some of the variability of the estimated volume could be due to this. A dynamic thresholding technique (Gonzalez and Woods 1992) could possibly help to reduce the variance in the estimated volume throughout the sequence.
Fig. 10.
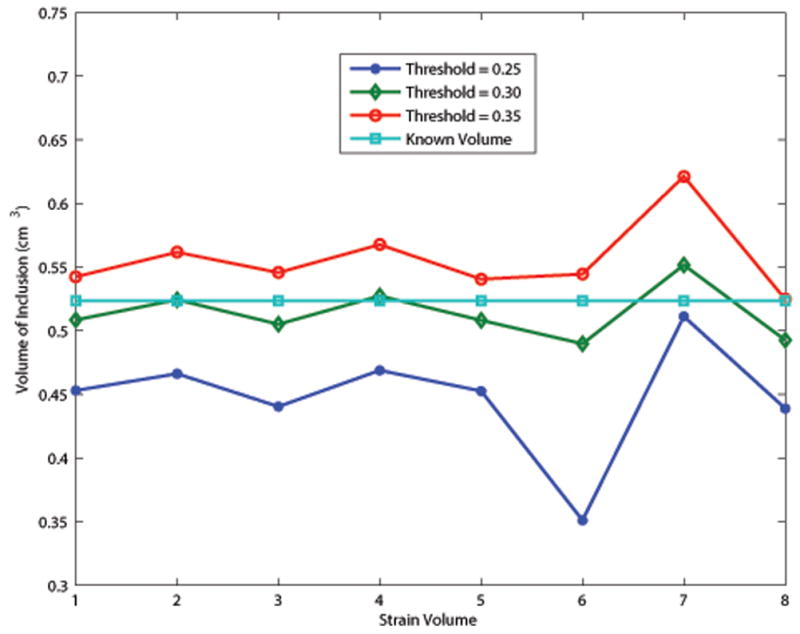
Volume of the segmented lesion using different threshold values for auto-segmentation. A value of 0.30 for the threshold gave the most accurate volume estimation.
Movement of the Centroid
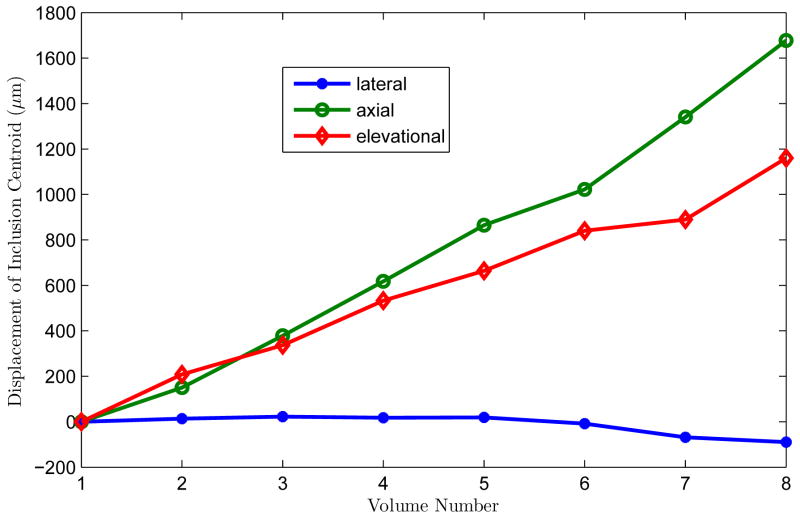
Following segmentation, the lesion centroid was determined and tracked through the sequences of deformations by using a simple center of mass calculation. The inclusion was spherical in shape, but the segmentation was not necessarily a perfect sphere, and the shape changed slightly for each compression step. In order to follow where the inclusion is located, the centroid was used since it takes into consideration the shape of the inclusion, but follows the center. The results, shown in Fig. 11, demonstrate that deformations of this phantom resulted in appreciable axial and elevation motion, but minimal lateral movement. The same general motion was observed with all motion tracking algorithms. The 3D lateral guidance algorithm provided the most reliable tracking and therefore those results are presented here.
Fig. 11.
Movement of the centroid of the spherical lesion under the nine deformations. There is appreciable motion in the axial and elevational directions.
The phantom was free to move in either lateral or elevation direction under the uniaxial compression. The fact that it moved more in the elevation direction rather than the lateral direction was not designed into the experiment; the phantom was free to move in either direction. Lateral motion has the same effect as elevation motion in 3D lateral guidance algorithm and any performance difference between lateral and elevation tracking would have been due to the different spacing of the beams in the two directions. The 2D lateral guidance algorithm could have tracked lateral motion if it had occurred (Zhu and Hall 2002) although it failed to accurately track the out-of-plane (elevation) motion.
Contrast to Noise Ratio
Problems arose when trying to compute the CNR for the 2D lateral guidance algorithm when there was significant out-of-plane motion (volumes 2-6 and 8). 2D tracking was quite poor and with many motion tracking errors the auto-segmentation failed. The lesion boundary was reasonably well defined in the proximal part of the volume, but segmentation failed in the distal section, with the segmented ‘lesion’ encompassing most of the lower volume. Because of the failed auto-segmentation with 2D tracking the segmentation from the 3D lateral guidance algorithm was used to determine the object from the background for all tracking methods when computing the CNR. The threshold value was chosen so that the volume of the inclusion matched the theoretical volume the best.
The CNR obtained from the 2D lateral guidance algorithm was the lowest among the tracking methods. The 2D lateral guidance and the 3D best plane tracking were equivalent for the first post-deformation volume because the “best planes” in the post-deformation volume were exactly the same as the planes in the pre-deformation volume (z′ was the best match to z in Fig. 2) showing that there was minimal elevational motion in this deformation.
Generally the 3D best plane method provided a significant improvement in CNR over the 2D lateral guidance algorithm. The 3D multi-plane algorithm provided a small improvement over the 3D best plane method. The 3D lateral guidance algorithm performed on par with the 3D multi-plane but it is more robust as shown in Fig. 8 volume 7.
The CNR for the 3D multi-plane tracking in strain volume 7 is much lower than the other strain volumes using that tracking technique and lower than all the other tracking techniques on that particular volume (see Fig. 8). When this algorithm combined displacement estimates from the “best plane” and the “second-best plane” a constraint placed on displacement estimates within a single plane was violated. Motion tracking in individual strain planes has an implicit continuity condition: blocks of data cannot, in effect, collide (see Eqn. 1). However, the 3D multi-plane tracking algorithm lacks this constraint, and the combined displacement estimates were discontinuous in some of the planes in that volume. The gradient of these discontinuous displacement fields produced erroneously large strain values. The mean strain in the background, sbkg, was nearly equal to the strain in the inclusion, ssph, producing a low CNR. The other three tracking algorithms do not combine displacement estimates from multiple planes and have a continuity constraint within each plane.
A 3D strain image of the phantom (Fig. 6) illustrates the high contrast to noise throughout the volume. High quality strain images can be obtained in any image plane (arbitrary position and direction) using these methods.
NCC of Motion Compensated RF Data
The 2D lateral guidance algorithm provided the least accurate motion tracking among the methods tested. Performance of the 2D tracking algorithm and the 3D best plane tracking were equivalent for the first post-deformation volume (Fig. 7). The accuracy of the 2D method throughout the rest of the 8 volumes varied considerably, but was always lower than the other methods tested. Volumes 4 and 8 had the largest average elevation displacement (approximately 200μm each over the entire volume) and not coincidently faired the worst. Tracking the out of plane motion, even in the simplest form of the best plane tracking, was able to improve the accuracy. The 3D best plane and multi-plane algorithms performed on par with each other for 5 of the 8 volumes, with the multi-plane algorithm outperforming the best plane algorithm for three of the volumes. It is interesting to note that the NCC in volume 7 is higher for the multi-plane tracking than the best plane. We saw that best plane tracking outperformed the multi-plane tracking with regards to CNR for this volume. Because the NCC is based on the displacement estimates and not the strain estimates, we do not see the large spikes caused by taking the gradient of the discontinuous data that caused the CNR to be degraded. The 3D lateral guidance provided further improvement over the other algorithms, and the highest NCC for the entire sequence.
Modulus Imaging
A 3D shear modulus image, reconstructed using the 3D lateral guidance displacement estimates and the inverse elasticity algorithm is shown in Fig. 9. The displacement estimates were accumulated over eight volumes to maximize the contrast to noise ratio (approximately 13% strain). Due to computational limitations, a region of interest (2.53cm × 3.10cm × 2.59cm lateral, axial, and elevation respectively) of the displacement fields was selected for the reconstruction and decimated, spatially, in order to accommodate a smaller finite element mesh (50 × 52 × 30). The inversion algorithm recovers only the relative modulus distribution and not the absolute modulus distribution. Therefore, Fig. 9 is shown with arbitrary units of pressure and a background modulus (or minimum value) of unity. It is also worth noting that the 3D modulus reconstruction shown in Fig. 9 was done “blind”. That is, the person performing the reconstruction was not previously aware of the contents of the phantom, the number, geometry, or size of the inclusions, nor their expected contrast, except through visualization of the strain images.
Speed of Motion Tracking Algorithms
Increasing sophistication of motion tracking algorithms generally increased the computational burden. The strain image computation times for the 2D and 3D lateral guidance algorithms are shown in Table 1 and were estimated using a pair of RF data fields that were 211 × 1600 × 71 RF samples (corresponding to 2.5cm × 3.1cm × 1.5cm) on a computer workstation (Dell Precision 390, Dell, Austin, TX) with an Intel Core 2 Duo E6300 processor running at 1.86 GHz with 4 GB of RAM.
Table 1.
A comparison of compute times for various tracking algorithms.
| Tracking Method | Compute Time |
|---|---|
| 2D Lateral Guidance | 5 min |
| 3D Lateral Guidance | 1.5 min |
The timings of the four tracking algorithms were not directly compared due to the different types of programming involved. The 2D lateral guidance and the 3D lateral guidance algorithms are written in C++ as functions (MEX) that are compiled and can be called from Matlab (The MathWorks, Natick, MA). The 3D best plane and 3D multi-plane algorithms use the 2D tracking function, but then do additional tracking in the elevation direction using Matlab scripts. These two algorithms also took substantially longer to compute than the 2D or 3D lateral guidance.
3D lateral guidance is more than 3 times faster than the 2D lateral guidance for tracking volume displacements. With the 3D guidance, there is only one initial search using the Viterbi algorithm, where as with the 2D lateral guidance, the initial displacements for each elevation plane are computed. Computing the initial displacements is computationally expensive, and is a significant fraction of the total tracking time. While the 2D version of the Viterbi algorithm is less complex than the 3D version (2D search vs. 3D search), repeated calls for every plane cause the algorithm to be slower. Also, the overhead associated with multiple memory copies (each separate plane in the 2D method) versus a single copy (entire volume in the 3D method) to Matlab may play a factor in the speed increase.
Further optimizations are possible with the 3D lateral guidance algorithm. Future work includes migrating some code to a GPU to take advantage of the parallel nature of the tracking algorithms.
Conclusions
These results demonstrate the improvement in motion tracking available through 3D tracking. Amongst the 3D tracking algorithms tested, the 3D lateral guidance provided the most robust displacement estimates that can be used to form a strain image with the best image quality. This work also demonstrates that volume data acquisition allows accurate motion tracking and axial strain image formation for an entire target (within the field of view). Volume data acquisition with 2D arrays will provide a significant advancement in the capabilities of elasticity imaging systems.
Perhaps the clearest image of the inclusion may be seen in the reconstructed modulus image. The inclusion stands out clearly against a clean background, with high contrast and spatial resolution. The recovered contrast agrees within 10% of the expected contrast, and the volume within 5% (as accurately as could be recovered given the spatial discretization used).
Supplementary Material
Acknowledgments
This study was funded in part by a grant from the NIH (R01CA100373, R21CA133488, and R21CA109440) and the NIH Radiological Sciences Training Grant (T32CA09206). We are also grateful to Siemens Health Care, Inc. Ultrasound Division for the equipment loan that made this work possible.
Appendix
Additional multimedia content is available in the form of two movie clips. Movie clip 1 shows plane by plane stepping through strain volume 7 in the elevation direction with each of the 4 tracking methods presented.
Movie clip 2 shows a strain volume with 3 orthogonal planes intersecting. Axial (green), lateral (red), and elevation (blue) axes are visible as the volume rotates. The lesion is then segmented, and the 8 strain volumes are stepped through showing the phantom being compressed. There is appreciable motion in the axial and elevation direction (up and right respectively).
References
- Bashford GR, von Ramm OT. Ultrasound three-dimensional velocity measurements by feature tracking. IEEE Transactions on Ultrasonics Ferroelectrics and Frequency Control. 1996;43:376–84. [Google Scholar]
- Bharat S, Fisher TG, Varghese T, Hall TJ, Jiang J, Madsen EL, Zagzebski JA, Lee FT. Three-dimensional electrode displacement elastography using the siemens C7F2 foursight four-dimensional ultrasound transducer. Ultrasound in Medicine and Biology. 2008;34:1307–16. doi: 10.1016/j.ultrasmedbio.2008.01.007. [DOI] [PMC free article] [PubMed] [Google Scholar]
- Bilgen M. Target detectability in acoustic elastography. IEEE Transactions on Ultrasonics Ferroelectrics and Frequency Control. 1999;46:1128–33. doi: 10.1109/58.796118. [DOI] [PubMed] [Google Scholar]
- Bonnefous O, Pesque P. Time Domain Formulation of Pulse-Doppler Ultrasound and Blood Velocity Estimation by Cross-Correlation. Ultrasonic Imaging. 1986;8:73–85. doi: 10.1177/016173468600800201. [DOI] [PubMed] [Google Scholar]
- Burnside ES, Hall TJ, Sommer AM, Hesley GK, Sisney GA, Svensson WE, Fine JP, Jiang J, Hangiandreou NJ. Differentiating Benign from Malignant Solid Breast Masses with US Strain Imaging. Radiology. 2007;245:401–10. doi: 10.1148/radiol.2452061805. [DOI] [PubMed] [Google Scholar]
- Carter GC. Coherence and time delay estimation. Proceedings of the IEEE. 1987;75:236–55. [Google Scholar]
- Chaturvedi P, Insana MF, Hall TJ. Testing the limitations of 2-D companding for strain imaging using phantoms. IEEE Trans Ultrason, Ferroelec, Freq Cont. 1998;45:1022–31. doi: 10.1109/58.710585. [DOI] [PubMed] [Google Scholar]
- Chen H, Varghese T. Multilevel hybrid 2D strain imaging algorithm for ultrasound sector/phased arrays. Medical Physics. 2009;36:2098–106. doi: 10.1118/1.3121426. [DOI] [PMC free article] [PubMed] [Google Scholar]
- Chen LJ, Treece GM, Lindop JE, Gee AH, Prager RW. A quality-guided displacement tracking algorithm for ultrasonic elasticity imaging. Medical Image Analysis. 2009;13:286–96. doi: 10.1016/j.media.2008.10.007. [DOI] [PMC free article] [PubMed] [Google Scholar]
- Chen X, Xie H, Erkamp R, Kim K, Jia C, Rubin JM, O'Donnell M. 3-D correlation-based speckle tracking. Ultrasonic Imaging. 2005;27:21–36. doi: 10.1177/016173460502700102. [DOI] [PubMed] [Google Scholar]
- Daft C, Wagner P, Panda S, Ladabaum I. Elevation bean profile control with bias polaridy patterns applied to microfabricated ultrasound transducers. 2003 IEEE Ultrasonics Symposium Procedings (2); 2003. pp. 1578–81. [Google Scholar]
- Daft CaW P, Bymaster B, Panda S, Patel K, Ladabaum I. cMUTs and electronics for 2D and 3D imaging: monolithic integration, in-handle chip sets and system implications. Ultrasonics Symposium, 2005 IEEE; 2005. pp. 463–74. [Google Scholar]
- Deprez JF, Brusseau E, Schmitt C, Cloutier G, Basset O. 3D estimation of soft biological tissue deformation from radio-frequency ultrasound volume acquisitions. Medical Image Analysis. 2009;13:116–27. doi: 10.1016/j.media.2008.07.003. [DOI] [PubMed] [Google Scholar]
- Dotti D, Gatti E, Svelto V, Ugge A, Vidali P. Blood-Flow Measurements by Ultrasound Correlation Techniques. Energia Nucleare. 1976;23:571–5. [Google Scholar]
- Fisher TG, Hall TJ, Jiang J. Volumetric Strain Imaging. 2007 IEEE Ultrasonics Symposium; 2007. pp. 355–8. [Google Scholar]
- Garra BS, Céspedes EI, Ophir J, Spratt SR, Zuurbier RA, Magnant CM, Pennanen MF. Elastography of breast lesions: initial clinical results. Radiology. 1997;202:79–86. doi: 10.1148/radiology.202.1.8988195. [DOI] [PubMed] [Google Scholar]
- Gonzalez RC, Woods RE. Digital Image Processing. Boston, MA, USA: Addison-Wesley Longman Publishing Co., Inc.; 1992. [Google Scholar]
- Hein IA, O'Brien WD. Current Time-Domain Methods for Assessing Tissue Motion by Analysis from Reflected Ultrasound Echoes - a Review. IEEE Transactions on Ultrasonics Ferroelectrics and Frequency Control. 1993;40:84–102. doi: 10.1109/58.212556. [DOI] [PubMed] [Google Scholar]
- Insana MF, Chaturvedi P, Hall TJ, Bilgen M. 3-D companding using linear arrays for improved strain imaging. Ultrasonics Symposium, 1997 Proceedings; 1997. pp. 1435–8. [Google Scholar]
- Jiang J, Hall TJ. A parallelizable real-time motion tracking algorithm with applications to ultrasonic strain imaging. Physics in Medicine and Biology. 2007;52:3773–90. doi: 10.1088/0031-9155/52/13/008. [DOI] [PubMed] [Google Scholar]
- Jiang J, Hall TJ. A Generalized Speckle Tracking Algorithm for Ultrasonic Strain Imaging Using Dynamic Programming. Ultrasound in Medicine & Biology. 2009;35:1863–79. doi: 10.1016/j.ultrasmedbio.2009.05.016. [DOI] [PMC free article] [PubMed] [Google Scholar]
- Jiang J, Hall TJ, Sommer AM. A novel performance descriptor for ultrasonic strain imaging: a preliminary study. IEEE transactions on ultrasonics, ferroelectrics, and frequency control. 2006;53:1088–102. doi: 10.1109/tuffc.2006.1642508. [DOI] [PMC free article] [PubMed] [Google Scholar]
- Jiang J, Hall TJ, Sommer AM. A Novel Image Formation Method for Ultrasonic Strain Imaging. Ultrasound in Medicine & Biology. 2007;33:643–52. doi: 10.1016/j.ultrasmedbio.2006.11.005. [DOI] [PMC free article] [PubMed] [Google Scholar]
- Kallel F, Ophir J. A least-squares strain estimator for elastography. Ultrasonic Imaging. 1997;19:195–208. doi: 10.1177/016173469701900303. [DOI] [PubMed] [Google Scholar]
- Konofagou E, Ophir J. Precision estimation and imaging of normal and shear components of the 3D strain tensor in elastography. Physics in Medicine and Biology. 2000;45:1553–63. doi: 10.1088/0031-9155/45/6/311. [DOI] [PubMed] [Google Scholar]
- Lindop JE, Treece GM, Gee AH, Prager RW. 3D elastography using freehand ultrasound. Ultrasound in Medicine and Biology. 2006;32:529–45. doi: 10.1016/j.ultrasmedbio.2005.11.018. [DOI] [PubMed] [Google Scholar]
- Madsen EL, Frank GR, Krouskop TA, Varghese T, Kallel F, Ophir J. Tissue-mimicking oil-in-gelatin dispersions for use in heterogeneous elastography phantoms. Ultrasonic Imaging. 2003;25:17–38. doi: 10.1177/016173460302500102. [DOI] [PubMed] [Google Scholar]
- Madsen EL, Hobson MA, Shi H, Varghese T, Frank GR. Stability of heterogeneous elastography phantoms made from oil dispersions in aqueous gels. Ultrasound in Medicine and Biology. 2006;32:261–70. doi: 10.1016/j.ultrasmedbio.2005.10.009. [DOI] [PMC free article] [PubMed] [Google Scholar]
- Morrison DC, McDicken WN, Smith DSA. A Motion Artifact in Real-Time Ultrasound Scanners. Ultrasound in Medicine and Biology. 1983;9:201–3. doi: 10.1016/0301-5629(83)90046-7. [DOI] [PubMed] [Google Scholar]
- Oberai AA, Gokhale NH, Doyley MM, Bamber JC. Evaluation of the adjoint equation based algorithm for elasticity imaging. Physics in Medicine and Biology. 2004;49:2955–74. doi: 10.1088/0031-9155/49/13/013. [DOI] [PubMed] [Google Scholar]
- Ophir J, Céspedes I, Yadzi Y, Li X. Elastography: a quantitative method for imaging the elasticity of biological tissues. Ultrasonic Imaging. 1991;13:111–34. doi: 10.1177/016173469101300201. [DOI] [PubMed] [Google Scholar]
- Oralkan O, Ergun AS, Cheng C-H, Johnson JA, Karaman M, Lee TH, Khuri-Yakub BT. Volumetric ultrasound imaging using 2-D CMUT arrays. Ultrasonics, Ferroelectrics and Frequency Control, IEEE Transactions. 2003;50:1581–94. doi: 10.1109/tuffc.2003.1251142. [DOI] [PubMed] [Google Scholar]
- Osher S, Fedkiw RP. Level set methods and dynamic implicit surfaces. New York: Springer; 2003. [Google Scholar]
- von Ramm OT, Smith SW, Pavy HG., Jr HGP. High-speed ultrasound volumetric imaging system. II. Parallel processing and image display. IEEE Transactions on Ultrasonics, Ferroelectrics and Frequency Control. 1991;38:109–15. doi: 10.1109/58.68467. [DOI] [PubMed] [Google Scholar]
- Rao M, Varghese T. Correlation analysis of three-dimensional strain imaging using ultrasound two-dimensional array transducers. Journal of the Acoustical Society of America. 2008;124:1858–65. doi: 10.1121/1.2953310. [DOI] [PubMed] [Google Scholar]
- Richards MS, Barbone PE, Oberai AA. Quantitative three-dimensional elasticity imaging from quasi-static deformation: a phantom study. Physics in Medicine and Biology. 2009;54:757. doi: 10.1088/0031-9155/54/3/019. [DOI] [PMC free article] [PubMed] [Google Scholar]
- Song XM, Pogue BW, Jiang SD, Doyley MM, Dehghani H, Tosteson TD, Paulsen KD. Automated region detection based on the contrast-to-noise ratio in near-infrared tomography. Applied Optics. 2004;43:1053–62. doi: 10.1364/ao.43.001053. [DOI] [PubMed] [Google Scholar]
- Trahey GE, Allison JW, Ramm OTv. Angle Independent Ultrasonic-Detection of Blood-Flow. IEEEe T Bio-Med Eng. 1987;34:965–7. doi: 10.1109/tbme.1987.325938. [DOI] [PubMed] [Google Scholar]
- Treece GM, Lindop JE, Gee AH, Prager RW. Freehand Ultrasound Elastography with a 3-D Probe. Ultrasound in Medicine & Biology. 2008;34:463–74. doi: 10.1016/j.ultrasmedbio.2007.08.014. [DOI] [PubMed] [Google Scholar]
- Varghese T, Ophir J. An analysis of elastographic contrast-to-noise ratio. Ultrasound in Medicine and Biology. 1998;24:915–24. doi: 10.1016/s0301-5629(98)00047-7. [DOI] [PubMed] [Google Scholar]
- Viola F, Walker WF. A comparison of the performance of time-delay estimators in medical ultrasound. IEEE Transactions on Ultrasonics Ferroelectrics and Frequency Control. 2003;50:392–401. doi: 10.1109/tuffc.2003.1197962. [DOI] [PubMed] [Google Scholar]
- Viterbi AJ. Error bounds for convolutional codes and an asymptotically optimum decoding algorithm. IEEE Transactions on Information Theory. 1967;IT-13:260–9. [Google Scholar]
- Walker WF, Trahey GE. A fundamental limit on delay estimation using partially correlated speckle signals. Ultrasonics, Ferroelectrics and Frequency Control, IEEE Transactions. 1995;42:301–8. [Google Scholar]
- Wildes DG, Chiao RY, Daft CMW, Rigby KW, Smith LS, Thomenius KE. Elevation performance of 1.25D and 1.5D transducer arrays. IEEE Trans Ultrason, Ferroelec, Freq Cont. 1997;44:1027–37. [Google Scholar]
- Wilson LS, Robinson DE. Ultrasonic Measurement of Small Displacements and Deformations of Tissue. Ultrasonic Imaging. 1982;4:71–82. doi: 10.1177/016173468200400105. [DOI] [PubMed] [Google Scholar]
- Zhu Y, Hall TJ. A modified block matching method for real-time freehand strain imaging. Ultrasonic Imaging. 2002;24:161–76. doi: 10.1177/016173460202400303. [DOI] [PubMed] [Google Scholar]
- Zhu Y, Hall TJ, Jiang JF. A finite-element approach for Young's modulus reconstruction. IEEE Transactions on Medical Imaging. 2003;22:890–901. doi: 10.1109/TMI.2003.815065. [DOI] [PubMed] [Google Scholar]
Associated Data
This section collects any data citations, data availability statements, or supplementary materials included in this article.


