

Abstract
Understanding the genetic mechanisms underlying natural variation in gene expression is a central goal of both medical and evolutionary genetics, and studies of expression quantitative trait loci (eQTLs) have become an important tool for achieving this goal1. Although all eQTL studies so far have assayed messenger RNA levels using expression microarrays, recent advances in RNA sequencing enable the analysis of transcript variation at unprecedented resolution. We sequenced RNA from 69 lymphoblastoid cell lines derived from unrelated Nigerian individuals that have been extensively genotyped by the International HapMap Project2. By pooling data from all individuals, we generated a map of the transcriptional landscape of these cells, identifying extensive use of unannotated untranslated regions and more than 100 new putative protein-coding exons. Using the genotypes from the HapMap project, we identified more than a thousand genes at which genetic variation influences overall expression levels or splicing. We demonstrate that eQTLs near genes generally act by a mechanism involving allele-specific expression, and that variation that influences the inclusion of an exon is enriched within and near the consensus splice sites. Our results illustrate the power of high-throughput sequencing for the joint analysis of variation in transcription, splicing and allele-specific expression across individuals.
Studies of gene expression variation in humans have yielded several insights into the genetic basis of natural variation in mRNA levels. In particular, much variation in gene expression levels and alternative splicing is heritable3,4, and polymorphisms that affect the expression level of a gene are most often found near the gene itself, especially near the transcription start site5-7.
Until now, all studies of gene expression variation in humans have been performed using microarrays, which generally measure expression levels using one or a few probes targeting particular parts of each gene. In contrast, the recent development of RNA sequencing (RNA-Seq) protocols using high-throughput sequencing platforms allows for relatively unbiased measurements of expression levels across the entire length of a transcript8. This technology has several advantages, including the ability to detect transcription of unannotated exons, measure both overall and exon-specific expression levels, and assay allele-specific expression.
To study variation in transcript levels at high resolution, we sequenced RNA from lymphoblastoid cell lines (LCLs) derived from 69 Nigerian individuals generated as part of the International HapMap project2. Specifically, we sequenced complementary DNA libraries prepared from the polyadenylated fraction of RNA from each individual in at least two lanes of the Illumina Genome Analyser 2 platform, and mapped reads to the human genome using MAQ v0.6.8 (ref. 9). In total, we generated 1.2 billion reads of either 35 or 46 base pairs (bp), of which 964 million reads mapped uniquely to the genome or to exon–exon boundaries (Supplementary Material and Supplementary Table 1). As an initial approximation, we estimated the expression level of a gene as the fraction of all sequencing reads that mapped to its exons (including exon–exon boundaries) divided by the ‘mappable’ length of the gene (Supplementary Material). Spearman correlations between our gene expression estimates and estimates derived from microarray data (for the 53 cell lines in common between our study and a previous study using exon microarrays10) ranged from 0.60 to 0.78 (Supplementary Fig. 3).
Although our main aim was to compare gene expression levels across individuals, we first pooled all the data to examine the completeness of current gene annotations (Supplementary Fig. 1). This pooled data set of 964 million uniquely mapped reads represents an order of magnitude deeper sequencing coverage of a tissue than any previous RNA-Seq analysis. Of all reads that mapped uniquely to the genome, 86% mapped within known exons. We examined regions of transcription outside annotated exons with respect to conservation to enrich for those regions with truly functional transcription (Supplementary Material and Supplementary Fig. 5). Overall, 4,031 regions of the genome unannotated at present show evidence of transcription and overlap highly conserved regions, as judged by analysis of an alignment of 28 vertebrate genomes11. (We define ‘unannotated’ as absent from gene models in the Ensembl, UCSC, Vega and Refseq databases.) We next used the sequence reads to examine these regions for evidence of splicing either to known exons or to other unannotated transcribed regions. We identified 992 regions (24% of the total) that show evidence of being part of spliced transcripts. Most of these (696) are spliced to known transcripts, suggesting that they are unannotated exons of known genes (Supplementary Material and Supplementary Fig. 6). In most cases the physical locations of the new exons spliced to known genes suggest that they may be untranslated regions, rather than new protein-coding exons. We next examined the full set of expressed, conserved regions for patterns of conservation consistent with a protein-coding function, using a test of the non-synonymous to synonymous sub-stitution rate (the dN/dS ratio). We identified 115 exons with strong evidence that they are protein-coding (at a false discovery rate (FDR) of 1%). One example of such an exon is presented in Fig. 1a, which shows a previously unannotated protein-coding exon in the transcription factor ZSWIM4 (dN/dS likelihood ratio 298; P < 1 × 10⁻⁷). Overall, these results indicate that, in comparison to protein-coding exons, untranslated regions (UTRs) are relatively poorly annotated in current databases.
Figure 1. Annotating genes with RNA-Seq.

a, Example of a new protein-coding exon identified by RNA-Seq. LR, likelihood ratio. For each base in a window, we plot the average rate at which it is covered in our data. Light blue denotes bases annotated as exonic in Ensembl, black indicates bases that are not. In the gene model, blue boxes represent annotated exons from Ensembl, black lines represent annotated introns. In red is the position of an inferred new protein-coding exon. Lines represent the positions of splice junctions predicted from the RNA-Seq data and supported by more than five sequencing reads; in red are those absent from current databases. Below each junction is the number of sequencing reads supporting the junction. b, New exons are more tissue-specific than annotated exons. For each exon, we estimated the fraction of either new or annotated exons observed in each tissue profiled previously12, as well as in chimpanzee LCLs (red). The grey line represents what would be expected if both annotated and unannotated exons were observed at the same rate. AD, adipose; BR, brain; BS, breast; BT, BT cell line; CO, colon; HM, HME cell line; HR, heart; LN, lymph node; LV, liver; SK, skeletal muscle; TS, testes. Data are for exons expressed at a mean rate in human LCLs between 0.1 and 0.3 reads per million; for other expression rates see Supplementary Fig. 7. c, Example of a new polyadenylation site identified by RNA-Seq. Labelled as in a. Red line shows the position of reads identified as originating in the poly-A tail. Grey line represents the position of the predicted cleavage site. d, Binding sites for CPSF are enriched upstream of predicted polyadenylation sites. We divided predicted polyadenylation cleavage sites (supported by at least two sequencing reads) into classes based on their proximity to annotated cleavage sites. For each site, we extracted the upstream 50 bases, and plot, for each position, the fraction of sequences matching the consensus AATAAA hexamer.
We looked for further support that these 4,031 unannotated transcribed regions are indeed real exons. To do so, we examined the expression of such regions in RNA-Seq data sets from several human tissues12, as well as a data set from chimpanzee LCLs (A.A.P. and Y.G., unpublished data). We found that putative exons are observed in chimpanzee LCLs at approximately the same rate as annotated exons (overall, 84% of putative new exons are also observed in chimpanzee LCLs). However, these regions are observed at a lower rate than annotated exons in the different human tissues, with the notable exceptions of lymph node and breast tissue (Fig. 1b and Supplementary Fig. 7). We interpret this as evidence that transcription of these regions is indeed conserved but more tissue-specific than that of previously annotated exons, providing a partial explanation for their absence from current gene annotations.
We used the 70 million sequence reads that did not map to the genome to find new polyadenylation cleavage sites, by identifying reads ending in strings of As or Ts and thus potentially originating in the poly-A tail (Supplementary Material). Using this approach, we identified 7,926 putative cleavage sites supported by more than one sequence read; of these, 45% fall within 10 bases of an annotated cleavage site. To test whether these predicted cleavage sites represent true sites, we calculated the distribution of the hexamer AATAAA, the binding site for the CPSF polyadenylation factor, in the 50 bases upstream of the predicted sites (this hexamer is present between 10 and 30 bases upstream of most known polyadenylation cleavage sites13). There is a 32-fold enrichment of this hexamer between 15 and 30 bases upstream of our predicted sites (Supplementary Fig. 8). An enrichment of this hexamer exists regardless of the distance of the prediction from all known cleavage sites (Fig. 1d). We defined a set of 3,481 high-confidence cleavage sites that are supported by more than one sequencing read and contain an upstream match to the CPSF hexamer. Median RNA-Seq read depth at bases upstream of these sites is markedly increased relative to bases downstream, supporting the contention that these represent true cleavage sites (Supplementary Fig. 9). On the basis of the enrichment of the CPSF motif, we estimate the FDR for the most distant class of sites (the 252 predictions falling more than 500 bases from a known cleavage site and having a match to the CPSF-binding site) as 13% (Supplementary Material). In many cases, the identified cleavage site lies hundreds of bases downstream of the annotated cleavage site; as an example, in Fig. 1c we show that a polyadenylation cleavage site used in the gene DYNLL2 lies roughly 2 kilobases (kb) beyond the annotated end of the gene, resulting in an extended 3′ UTR. Because UTRs contain important regulatory elements14, and 3′ UTR lengths are subject to precise regulatory control15,16, we suggest that the extensive use of unannotated UTRs in these cell lines has functional importance in gene regulation.
We next turned to identifying polymorphisms that influence expression levels of both previously annotated genes and unannotated exons (Supplementary Fig. 2). It is now clear that measurements of gene expression levels from RNA-Seq are correlated with measures of absolute expression level (as assayed by quantitative PCR) across a wide dynamic range12,17,18, suggesting that read counts alone could be used to assess differential expression between samples without the need for extensive processing8. However, we found that we could increase the power to detect eQTLs with a series of normalization and correction steps (Supplementary Material). Specifically, we performed an explicit correction for noise introduced by technical confounders such as GC content (Supplementary Material and Supplementary Fig. 12), as well as a correction using principal components analysis (PCA) that accounts for unmeasured confounders19,20.
For each gene, we evaluated the association between overall gene expression level (after normalization) and all 3.8 million single nucleotide polymorphisms (SNPs) genome-wide (using the genotypes from phases II and III of HapMap project). Consistent with previous reports6,21, virtually all SNPs with strong association signals lie near the corresponding gene (Supplementary Material). We then focused on SNPs in a candidate region spanning 200 kb on either side of each gene. At a gene-level FDR of 10% (corresponding to P = 2.4 × 10⁻⁵), there are 929 genes or putative new exons with ‘local’ eQTLs (within 200 kb), representing 4.6% of annotated genes and 2.3% of putative new exons. The RNA-Seq data enable visualization of the effect of an SNP on the entire gene; as an example, we show in Fig. 2a the evidence for an eQTL affecting the expression level of TSP50 (also known as PRSS50). In agreement with previous reports7, we found that SNPs that affect the overall expression level of a gene tend to fall extremely close to the gene; we estimate that 90% of SNPs that influence the expression level of a gene fall within 15 kb of the gene (Supplementary Fig. 13).
Figure 2. Loci affecting gene expression levels.
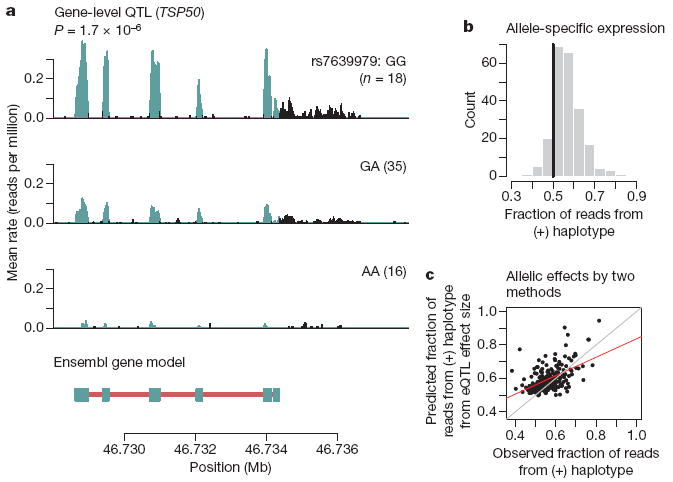
a, Example of RNA-Seq data indicative of an eQTL. Plotted is the average rate at which each base in a window surrounding TSP50 was sequenced in our data. To calculate this, we stratified individuals based on their genotype at rs7639979. Panels are labelled according to the genotype, with the number of individuals in parentheses. Bases overlapping known exons from Ensembl are in blue; non-exonic bases are in black. In the gene model below, exons from Ensembl are marked by blue boxes and introns with red lines; transcription of this gene occurs from the minus strand. b, Allele-specific expression at eQTLs. For each eQTL, we identified all the heterozygous individuals who also have heterozygous exonic SNPs, and estimated the fraction of reads coming from the high-expression (‘1’) haplotype using a beta-binomial model (Supplementary Material). Plotted is the histogram of estimated means; the black line is at 0.5, the expected fraction under the null. c, Correlation between effect sizes estimated from two methods. For each eQTL where we also have information about allele-specific expression, we estimated the allelic effect size by both an eQTL study and an allele-specific expression study (Supplementary Material). These estimates are statistically independent. Plotted for each gene is the estimated fraction of sequencing reads from the high-expression haplotype against the fraction predicted from the eQTL effect size. Red is the best-fit regression line, grey is a perfect correlation.
We evaluated whether our results replicate eQTLs previously identified in these samples using expression microarrays. To do so, we used the gene expression data from a subset of 53 individuals included in both our data set and a data set collected using Affymetrix exon microarrays10. Of the 138 SNPs identified as eQTLs at a FDR of 10% using the array data, 70% achieve nominal significance (P < 0.05, one-sided test) in our data, and the overwhelming majority (93%) show a trend in the same direction (Supplementary Fig. 14). We further compared the eQTLs identified in this study to those identified using RNA-Seq in a European population22; there is a 10–40-fold enrichment of significant eQTLs in the Nigerian sample among the top 500 associations discovered in the European sample (Supplementary Material and Supplementary Fig. 16). Taken together, these results indicate that the eQTLs we have identified are indeed due to replicable genetic effects.
We next considered the mechanism by which eQTLs act. The term ‘cis-eQTL’ has been used to describe associations between genes and nearby polymorphisms5,7,21. However, this term suggests a mechanism by allele-specific expression that could previously only be examined with independent experiments23,24. The same RNA-Seq data, however, can be used both to detect eQTLs and to assay allele-specific expression. We used the sequencing reads to determine whether heterozygotes for eQTLs show evidence of differences in expression levels from the two alleles, using the phased HapMap data to classify haplotypes as carrying the alleles associated with low- or high-expression levels. Out of 929 genes with putative cis-eQTLs, 222 contain informative exonic SNPs. Using these SNPs, we classified individual sequence reads as originating from the low- or high-expressing haplotype. Of these genes, 88% have a fraction of reads from the high-expressing haplotype greater than 0.5 (P < 2 × 10⁻¹⁶, binomial test; Fig. 2b), providing direct evidence that local eQTLs typically act by an allele-specific mechanism, namely the modulation of activity of cis-regulatory elements. Further support for this mechanism comes from the observation that the fraction of sequencing reads from the high-expressing haplotype (in heterozygotes alone) correlates with the strength of the eQTL (r = 0.52, P < 2 × 10⁻¹⁶; Fig. 2c). The correlation of the two independent estimates of the allelic effect is highest for the genes with the greatest read depth, and thus the most confidence in the predicted effect sizes (Supplementary Fig. 17).
Finally, we turned to identifying SNPs that influence the regulation of transcript isoform levels (Supplementary Fig. 2). For each exon of each gene, we treated the fraction of reads mapped to that exon (of all the reads in the gene) as a quantitative trait. This summarization effectively controls for variation in expression levels of the gene across samples. We then performed linear regressions of these fractions (after normalization and correction for confounding variables) against all polymorphisms within 200 kb of the gene. At a FDR of 10%, we found 187 genes with significant associations, indicating putative splicing QTLs (sQTLs). An example is shown in Fig. 3a, in which an SNP in the 3′ splice site of the terminal exon of OAS1 influences the inclusion of that exon. With the RNA-Seq data, we can precisely infer the effects of the disruption of this splicing signal. In this case, disruption of the 3′ splice site leads to upregulation of two alternative isoforms—one isoform that uses a cryptic 3′ splice site present upstream of the SNP, and another that excludes the final exon altogether and terminates at an upstream polyadenylation site (Fig. 3b).
Figure 3. Loci affecting isoform expression.
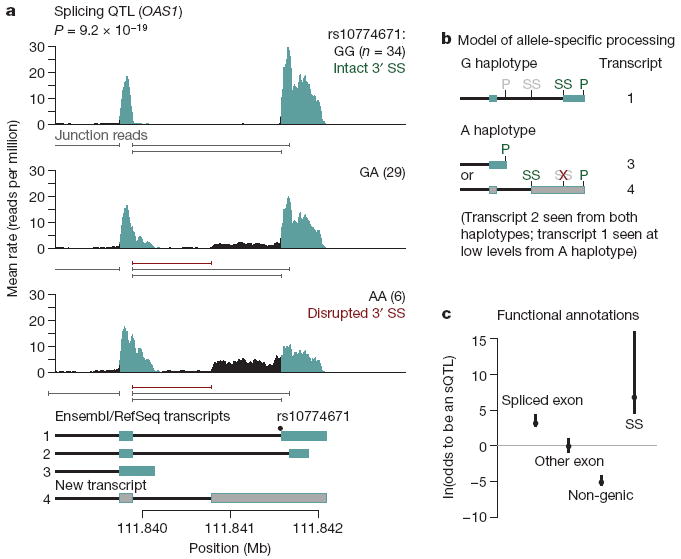
a, Example of RNA-Seq data indicative of an sQTL. Plotted is the average rate at which each base in a window surrounding the terminal two exons of OAS1 is sequenced in our data; individuals were stratified according to their genotype at rs10774671. Labels and colours are as in Fig. 2a. Below each plot are the positions of splice junctions inferred from the RNA-Seq data (Supplementary Material); in red are those absent from current databases. Below the figure are gene models from the RefSeq and Ensembl databases, as well as an inferred unannotated transcript. Annotated exons are in blue, unannotated exons in grey, introns in black. Individual transcripts are numbered for reference in b. b, The inferred model for the transcripts underlying the data in a. We plot the gene models inferred to result from splicing of transcripts from the haplotype carrying either the G or A allele at rs10444671. Gene models are numbered according to a. Shown are the positions of potential 3′ splice sites (SS) and polyadenylation sites (P). Sites in green for each transcript are used, those in grey are unused; the red ‘X’ denotes the splice site disrupted by the SNP. c, Enrichment of sQTLs in functional classes. We estimated the odds that SNPs falling in different functional classes affect the splicing of an exon, using a Bayesian hierarchical model (Supplementary Material). Plotted is the maximum likelihood estimate of the log odds ratio (relative to non-splice site intronic SNPs) for each annotation, as well as the 95% confidence intervals. The splice site annotation contains the full binding sites for the U1 snRNP and the U2AF splice factor25; for analysis restricted to the canonical two bases of the splice site, see Supplementary Fig. 19. The 95% confidence interval for the splice site annotation extends to more than 20, but has been truncated for display purposes.
We proposed that, as in the example described earlier, the mechanism of many of these associations acts through disruption of the splicing machinery. To test this, we extended a Bayesian hierarchical model used previously7 to include exon-specific effects (Supplementary Material). This model allows us to estimate the odds ratio for different types of SNPs to affect splicing. First, we considered the binding sites for the U1 small nuclear ribonucleoprotein (snRNP) and U2AF splice factor (of which the canonical splice sites are a part25); we found that SNPs throughout these binding sites are highly enriched among sQTLs relative to non-splice site intronic SNPs (log odds ratio of 7; 95% confidence interval [4.5, >20]; Fig. 3c). We considered whether SNPs within the canonical 2 bp of the splice site alone are enriched for sQTLs; we find that they are (log odds ratio of 10.5; 95% confidence interval [3.8, >20]; Supplementary Figs 18 and 19), in contrast to previous studies using exon microarrays26. Furthermore, SNPs within the spliced exon itself are also significantly enriched among sQTLs and, as expected, non-genic SNPs are markedly under-represented among sQTLs (Fig. 3c).
In summary, our results demonstrate the power of RNA-Seq data for genome annotation and analysis of variation in splicing and expression levels across individuals. Studies of variation in gene expression using microarrays have provided insight into the mechanism of action of loci associated with disease26,27; the increased sensitivity to detect variation in splicing and identify new transcripts provided by RNA-Seq will greatly enhance these efforts.
METHODS SUMMARY
cDNA libraries were prepared and sequenced as described previously28. All reads were mapped to the genome using MAQ v0.6.8 (ref. 9). For the purposes of mapping, we defined gene models according to the Ensembl database. For defining exons or polyadenylation sites as ‘new’, we compared to annotations in the Ensembl, UCSC, RefSeq and Vega databases, as downloaded from UCSC on 20 April 2009. We summarized the expression level of the gene as the number of reads mapping to the exons of the gene divided by the total number of reads in the lane, and averaged several lanes of the same individual. We quantile-normalized these fractions, and performed a linear regression of the expression measurements on the first 16 principal components of the expression matrix. The residuals from this regression were quantile-normalized and treated as the expression level of each gene. Release 27 HapMap genotypes were obtained from http://www.hapmap.org, and missing values were imputed using Bimbam29. Standard linear regressions between expression levels and posterior mean genotypes were performed in R. To detect allele-specific expression, we counted reads falling on each allele of exonic heterozygous SNPs, after excluding SNPs showing mapping biases by simulation30. We estimated the fraction of reads coming from each haplotype with a beta-binomial model. To identify sQTLs, the fraction of reads in a gene that falls in a given exon was treated as a quantitative trait. This fraction was quantile-normalized, confounding effects were removed by PCA, and linear regression was performed as for overall gene expression. The hierarchical model for exon effects was based on that described previously7. For full methods, see Supplementary Information. An overview of the methods and results is provided in Supplementary Figs 1 and 2.
Supplementary Material
Acknowledgments
We thank D. Gaffney, J. Bell, K. Bullaughey, Y. Guan and other members of the Pritchard, M. Przeworski and Stephens laboratory groups for helpful discussions, M. Domanus and P. Zumbo for sequencing support, and J. Zekos for computational assistance. J.F.D. and A.A.P. are supported by an NIH Training Grant to the University of Chicago. This work was supported by the HHMI and by NIH grants MH084703-01 to J.K. Pritchard and GM077959 to Y.G.
Footnotes
Author Contributions J.K. Pickrell performed most of the data analysis. J.C.M. contributed to the analysis of GC content and data normalizations and provided input on other aspects of data analysis. A.A.P. coordinated the cell culture and sequencing, and A.A.P. and E.N. prepared the sequencing libraries. The PCA-based normalization procedure was on the basis of results from J.-B.V., B.E.E. and M.S. J.F.D. provided software for the analysis of allele-specific expression. All authors participated in regular, detailed discussions of study design and data analysis at all stages of the study. The project was designed and supervised by Y.G. and J.K. Pritchard with regular input from M.S. The paper was written by J.K. Pickrell, Y.G. and J.K. Pritchard, with input from all authors.
Author Information Sequencing data have been deposited in Gene Expression Omnibus (GEO) under accession number GSE19480, and are also available at http://eqtl.uchicago.edu.
The authors declare no competing financial interests.
Supplementary Information is linked to the online version of the paper at www.nature.com/nature.
References
- 1.Rockman MV, Kruglyak L. Genetics of global gene expression. Nature Rev Genet. 2006;7:862–872. doi: 10.1038/nrg1964. [DOI] [PubMed] [Google Scholar]
- 2.Frazer KA, et al. A second generation human haplotype map of over 3.1 million SNPs. Nature. 2007;449:851–861. doi: 10.1038/nature06258. [DOI] [PMC free article] [PubMed] [Google Scholar]
- 3.Cheung VG, et al. Natural variation in human gene expression assessed in lymphoblastoid cells. Nature Genet. 2003;33:422–425. doi: 10.1038/ng1094. [DOI] [PubMed] [Google Scholar]
- 4.Kwan T, et al. Heritability of alternative splicing in the human genome. Genome Res. 2007;17:1210–1218. doi: 10.1101/gr.6281007. [DOI] [PMC free article] [PubMed] [Google Scholar]
- 5.Cheung VG, et al. Mapping determinants of human gene expression by regional and genome-wide association. Nature. 2005;437:1365–1369. doi: 10.1038/nature04244. [DOI] [PMC free article] [PubMed] [Google Scholar]
- 6.Stranger BE, et al. Population genomics of human gene expression. Nature Genet. 2007;39:1217–1224. doi: 10.1038/ng2142. [DOI] [PMC free article] [PubMed] [Google Scholar]
- 7.Veyrieras J-B, et al. High-resolution mapping of expression-QTLs yields insight into human gene regulation. PLoS Genet. 2008;4:e1000214. doi: 10.1371/journal.pgen.1000214. [DOI] [PMC free article] [PubMed] [Google Scholar]
- 8.Wang Z, Gerstein M, Snyder M. RNA-Seq: a revolutionary tool for transcriptomics. Nature Rev Genet. 2009;10:57–63. doi: 10.1038/nrg2484. [DOI] [PMC free article] [PubMed] [Google Scholar]
- 9.Li H, Ruan J, Durbin R. Mapping short DNA sequencing reads and calling variants using mapping quality scores. Genome Res. 2008;18:1851–1858. doi: 10.1101/gr.078212.108. [DOI] [PMC free article] [PubMed] [Google Scholar]
- 10.Huang RS, et al. A genome-wide approach to identify genetic variants that contribute to etoposide-induced cytotoxicity. Proc Natl Acad Sci USA. 2007;104:9758–9763. doi: 10.1073/pnas.0703736104. [DOI] [PMC free article] [PubMed] [Google Scholar]
- 11.Miller W, et al. 28-way vertebrate alignment and conservation track in the UCSC Genome Browser. Genome Res. 2007;17:1797–1808. doi: 10.1101/gr.6761107. [DOI] [PMC free article] [PubMed] [Google Scholar]
- 12.Wang ET, et al. Alternative isoform regulation in human tissue transcriptomes. Nature. 2008;456:470–476. doi: 10.1038/nature07509. [DOI] [PMC free article] [PubMed] [Google Scholar]
- 13.Zhao J, Hyman L, Moore C. Formation of mRNA 3′ ends in eukaryotes: mechanism, regulation, and interrelationships with other steps in mRNA synthesis. Microbiol Mol Biol Rev. 1999;63:405–445. doi: 10.1128/mmbr.63.2.405-445.1999. [DOI] [PMC free article] [PubMed] [Google Scholar]
- 14.Xie X, et al. Systematic discovery of regulatory motifs in human promoters and 3′ UTRs by comparison of several mammals. Nature. 2005;434:338–345. doi: 10.1038/nature03441. [DOI] [PMC free article] [PubMed] [Google Scholar]
- 15.Sandberg R, Neilson JR, Sarma A, Sharp PA, Burge CB. Proliferating cells express mRNAs with shortened 3′ untranslated regions and fewer microRNA target sites. Science. 2008;320:1643–1647. doi: 10.1126/science.1155390. [DOI] [PMC free article] [PubMed] [Google Scholar]
- 16.Mayr C, Bartel DP. Widespread shortening of 3′UTRs by alternative cleavage and polyadenylation activates oncogenes in cancer cells. Cell. 2009;138:673–684. doi: 10.1016/j.cell.2009.06.016. [DOI] [PMC free article] [PubMed] [Google Scholar]
- 17.Mortazavi A, Williams BA, McCue K, Schaeffer L, Wold B. Mapping and quantifying mammalian transcriptomes by RNA-Seq. Nature Methods. 2008;5:621–628. doi: 10.1038/nmeth.1226. [DOI] [PubMed] [Google Scholar]
- 18.Cloonan N, et al. Stem cell transcriptome profiling via massive-scale mRNA sequencing. Nature Methods. 2008;5:613–619. doi: 10.1038/nmeth.1223. [DOI] [PubMed] [Google Scholar]
- 19.Choy E, et al. Genetic analysis of human traits in vitro: drug response and gene expression in lymphoblastoid cell lines. PLoS Genet. 2008;4:e1000287. doi: 10.1371/journal.pgen.1000287. [DOI] [PMC free article] [PubMed] [Google Scholar]
- 20.Kang HM, Ye C, Eskin E. Accurate discovery of expression quantitative trait loci under confounding from spurious and genuine regulatory hotspots. Genetics. 2008;180:1909–1925. doi: 10.1534/genetics.108.094201. [DOI] [PMC free article] [PubMed] [Google Scholar]
- 21.Stranger BE, et al. Genome-wide associations of gene expression variation in humans. PLoS Genet. 2005;1:e78. doi: 10.1371/journal.pgen.0010078. [DOI] [PMC free article] [PubMed] [Google Scholar]
- 22.Montgomery SB, et al. Transcriptome genetics using second generation sequencing in a Caucasian population. Nature. doi: 10.1038/nature08903. this issue. [DOI] [PMC free article] [PubMed] [Google Scholar]
- 23.Ge B, et al. Global patterns of cis variation in human cells revealed by high-density allelic expression analysis. Nature Genet. 2009;41:1216–1222. doi: 10.1038/ng.473. [DOI] [PubMed] [Google Scholar]
- 24.Verlaan DJ, et al. Targeted screening of cis-regulatory variation in human haplotypes. Genome Res. 2009;19:118–127. doi: 10.1101/gr.084798.108. [DOI] [PMC free article] [PubMed] [Google Scholar]
- 25.Watson J, et al. Molecular Biology of the Gene. 6. Ch. 13. Benjamin Cummings; 2008. [Google Scholar]
- 26.Fraser HB, Xie X. Common polymorphic transcript variation in human disease. Genome Res. 2009;19:567–575. doi: 10.1101/gr.083477.108. [DOI] [PubMed] [Google Scholar]
- 27.Moffatt MF, et al. Genetic variants regulating ORMDL3 expression contribute to the risk of childhood asthma. Nature. 2007;448:470–473. doi: 10.1038/nature06014. [DOI] [PubMed] [Google Scholar]
- 28.Marioni JC, Mason CE, Mane SM, Stephens M, Gilad Y. RNA-seq: an assessment of technical reproducibility and comparison with gene expression arrays. Genome Res. 2008;18:1509–1517. doi: 10.1101/gr.079558.108. [DOI] [PMC free article] [PubMed] [Google Scholar]
- 29.Guan Y, Stephens M. Practical issues in imputation-based association mapping. PLoS Genet. 2008;4:e1000279. doi: 10.1371/journal.pgen.1000279. [DOI] [PMC free article] [PubMed] [Google Scholar]
- 30.Degner JF, et al. Effect of read-mapping biases on detecting allele-specific expression from RNA-sequencing data. Bioinformatics. 2009;25:3207–3212. doi: 10.1093/bioinformatics/btp579. [DOI] [PMC free article] [PubMed] [Google Scholar]
Associated Data
This section collects any data citations, data availability statements, or supplementary materials included in this article.