


Abstract
The genome of a multi-cellular organism acquires various functional capabilities in different cell types by means of distinct chromatin modifications and packaging states. Acquired during early development, the cell type-specific epigenotype is maintained by cellular memory mechanisms that involve epigenetic modifications. Here we present the epigenetic status of the euchromatic region of the human Y chromosome that has mostly been ignored in earlier whole genome epigenetic mapping studies. Using ChIP-on-chip approach, we mapped H3K9ac, H3K9me3, H3K27me3 modifications and CTCF binding sites while DNA methylation analysis of selected CpG islands was done using bisulfite sequencing. The global pattern of histone modifications observed on the Y chromosome reflects the functional state and evolutionary history of the sequences that constitute it. The combination of histone and DNA modifications, along with CTCF association in some cases, reveals the transcriptional potential of all protein coding genes including the sex-determining gene SRY and the oncogene TSPY. We also observe preferential association of histone marks with different tandem repeats, suggesting their importance in genome organization and gene regulation. Our results present the first large scale epigenetic analysis of the human Y chromosome and link a number of cis-elements to epigenetic regulatory mechanisms, enabling an understanding of such mechanisms in Y chromosome linked disorders.
INTRODUCTION
The human genome generates about 220 cell types and thousands of functional states. This multiplicity of phenotypic output is possible by epigenetic regulatory mechanisms that involve DNA methylation and a rich variety of histone modifications (1,2). In general, histone acetylation correlates with active state of chromatin whereas DNA methylation correlates with inactive chromatin. Histone methylation leads to active or inactive chromatin depending on the site of methylation of the histone tail (3). Tri-methylation of H3K4, H3K36 and H3K79 mark active chromatin whereas tri-methylation of H3K9, H3K27 and H3K56 mark inactive chromatin. Combinations of histone modifications provide further diversity in marking specific epigenetic signatures of a cell and are a crucial determinant of its fate (4,5). Cytosine methylation of DNA is the most widely studied epigenetic modification and has been found to be associated with tissue, germ line and cancer specific genes (1,6,7). CpG islands, the target of DNA methylation, are part of ∼60% of all promoters in the human genome (8). Histone hypoacetylation and hypermethylation at specific residues of core histone proteins are also correlated with DNA methylation, showing that there is an association between histone modifications and DNA methylation which finally determines the state of chromatin. Histone modifications, together with DNA methylation, have a vital role in organizing nuclear architecture and are involved in regulating transcription and other nuclear processes (1,9). These epigenetic marks not only reflect the cell type-specific functional state of the genome but also play an important role in maintaining that functional state during cell cycle and development (10–12).
The Y chromosome is one of the smaller chromosomes (∼57 Mb) in the human genome (13,14) and has been fascinating to researchers due to its peculiar genetics, role in sex determination and evolutionary history (15–17). Except for the small pseudoautosomal regions on both ends, no other part of the Y chromosome participates in meiotic recombination. The absence of recombination makes it very special not only for medical and forensic reasons but also to study human evolution (18). Non-recombining region of Y chromosome (NRY) or Male specific Y chromosome (MSY) has ∼40% (∼23 Mb) euchromatin and 60% (∼40 Mb) heterochromatin. It has poor gene density and has often been considered as a collection of junk DNA except for the sex-determining region. This view is gradually changing and now, many phenotypes have been attributed to the Y chromosome, including spermatogenesis, cerebral asymmetry, stature, tooth size, handedness, testoblastoma and male specific cancers (16,19–24). The pseudoautosomal regions present at the short (p) and long (q) arm contain 16 and 3 coding genes, respectively, whereas the euchromatic region of MSY contains 156 transcriptional units, half of which code for proteins. Because of internal duplications, these 78 genes code for only 27 distinct proteins (13,16). Of the 27 genes, 12 are expressed ubiquitously, 11 are expressed exclusively or predominantly in testis and the remaining 4 are expressed only in teeth and brain (16). Repeat elements are widespread in the Y chromosome and it has been postulated that some of these repeat elements may have a role in genome packaging and coordinated expression of genes (25).
These observations imply that though the Y chromosome has very few genes, it employs a variety of regulatory mechanisms for its function. Because of these features, we chose the Y chromosome for epigenetic analysis, generally neglected in whole genome epigenetic mapping studies (1,2,26,27) presumably because of the presence of many repeats and the instability of the chromosome in various cultured cell lines. To overcome both these limitations, we decided to analyze chromatin obtained from white blood cells (WBCs) of individuals and perform ChIP-on-chip using Y chromosome specific probes from both unique and duplicated regions. In this study we have mapped H3K9ac, H3K9me3, H3K27me3 histone modifications and binding sites of CTCF, a conserved chromatin protein with multiple functions including a role in chromatin domain boundary (28–31), across the euchromatic region of human Y chromosome using ChIP-on-chip technique. DNA methylation analysis of some CpG islands associated with Y-chromosome genes was also done using bisulfite sequencing method. Our results provide for the first time an epigenetic view of the MSY euchromatin. The distinct patterns of histone marks associated with different types of sequences on the chromosome are also indicative of the epigenetic mechanisms that regulate most of the genes and tandem repeats.
MATERIALS AND METHODS
Sample collection and isolation of white blood cells
Blood samples of male individuals, one each from the two distinct populations, South Indian (Tamil Nadu) and North Indian (Jammu and Kashmir) populations were collected (32). The sample collection was done as per institutional ethical guidelines. The blood samples were diluted 4 times in ELB (erythrocyte lysis buffer: 155 mM NH4Cl, 10 mM KHCO3, 0.1 mM EDTA pH 7.4) and incubated on ice for 30 min. After centrifugation at 2500 rpm for 10 min at room temperature, the supernatant was carefully removed and the pellet was re-suspended thoroughly in ELB. Again, centrifugation at 2500 rpm for 10 min at room temperature was done to pellet down white blood cells (WBCs) and the pellet was finally resuspended in 1× PBS. Cells were cross-linked immediately by incubation in 1% formaldehyde for 10 min at room temperature. Cross-linking was stopped by the addition of 125 mM glycine. For future use, cells were snap frozen and stored at −80°C.
Chromatin immuno-precipitation
Chromatin immuno-precipitation (ChIP) was carried out as per the Upstate kit (catalog 17–295) protocol. In brief, about 108 cross-linked cells were resuspended in 2 ml SDS lysis buffer containing protease inhibitors. After 10 min of incubation on ice, 200 µl aliquots were sonicated using Bioruptor (Diagenode). These aliquots were pooled, mixed well and again split into 200 µl aliquots. Then ChIP was done using H3K9Me3 (Upstate), H3K9ac (Upstate), H3K27Me3 (Upstate) and CTCF (Abcam) antibodies on WBCs of two different individuals, 8 experiments in total. To rule out experimental errors, we performed two more ChIPs with the South Indian sample, using H3K9Me3 and H3K9ac antibody. So, ten ChIP experiments were done using four antibodies for two samples and keeping two duplicates with the South Indian sample. After ChIP, DNA recovered from the bound fraction was used for the microarray experiment.
Microarray
A custom made Human Y chromosome specific microarray chip manufactured by Agilent Technologies was used. About 95 049 non-overlapping probes varying in size from 44 to 60 nt from the euchromatic region were spotted on microarray chip. The array contained 50 220 unique probes, 34 501 probes for multi-copy loci spotted once on the microarray chip and 4735 probes for multi-copy loci spotted multiple times (total 10 328). About 44 829 probes designed for multi-copy loci covered sequences like pseudoautosomal region, tandem repeats, palindromes and multi-copy TSPY gene. ChIP DNA was used for the hybridization as per the Mammalian ChIP-on-chip Protocol of Agilent Technologies. Data was extracted from scanned microarray slides using Agilent Feature Extraction Software 9. Output files from the Feature Extraction Software were used as input files for Agilent ChIP Analytics software for data extraction and visualization. Microarray data was normalized using default settings of Intra-array Lowess (intensity-dependent) normalization, Whitehead Error Model v1.0 in the ‘ChIP analytics’ software (Supplementary Figure S1). For data analysis and visualization in graphical form, human genome build May 2004 was used as per designed microarray chip probes, in custom track of UCSC genome browser (http://genome.ucsc.edu).
Bisulfite sequencing
The sodium bisulfite modification method was used to analyze DNA methylation of selected CpG island as described previously (33). In brief, DNA was digested with the appropriate enzyme and then denatured before sodium bisulfite treatment. The DNA sample was mixed with two volumes of low melting point agarose and kept at 50°C. The bisulfite modification solution (1.9 g of sodium bisulfite dissolved in 2.5 ml of water and 750 µl of 2 M NaOH) and hydroquinone solution (0.055 g dissolved in 500 µl of water) were made separately at 50°C and then combined and filtered in the dark. Beads from 10 µl aliquots of each DNA-agarose mix were made in mineral water, which was then transferred to the bisulfite modification solution. Once the beads were in the lower bisulfite solution, the tubes were incubated on ice for 30 min and then at 50°C for 3.5 h. After the incubation, the solution was removed and beads were washed before using for PCR. Two rounds of PCR were used to amplify the targets, which were then cloned in a T-overhang vector for sequencing. To obtain the methylation profile, a few clones were analyzed for each sample. The efficiency of bisulfite conversion was analyzed by calculating the percentage conversion of cytosines in non-CpG context. In our study, the non-CpG ‘C to T conversion rate’ was 97.1 ± 0.62 (standard error of mean).
Quantitative PCR
The chromatin prepared for the ChIP-on-chip study was also used to perform subsequent ChIP-qPCR validation on a panel of 13 loci selected from the array data. ChIP was performed on chromatin from 25 000 cells using LowCell ChIP Kit (Diagenode, #kch-maglow-A16) following the manufacturer’s protocol. Briefly, sonicated chromatin was incubated without any antibody (no antibody) or with 1 µg of H3K9me3 (abcam, #ab8898) or H3K27me3 (Millipore, #07-449) antibody or 2 µg of H3K9ac (abcam, #ab4441) or non-specific IgG (Diagenode, #kch-803-015) antibody bound to protein A coated paramagnetic beads. An aliquot of the same cross-linked and sonicated chromatin was kept aside as input DNA and purified in parallel. Following elution and purification of the immunoprecipitated DNA, relative abundance at target loci was estimated using Power SYBR Green qPCR Master mix (Applied Biosystems) on an ABI7900HT Fast Real-Time PCR System (2 min at 50°C; 10 min at 95°C; 40 cycles of 15 s at 94°C, 30 s at 60°C and 30 s at 68°C, followed by dissociation curve analysis). Enrichment in the ChIP DNA was determined relative to the no-antibody control using the dCt method. Enrichment was determined from three independent sets of ChIP assays performed on chromatin from the South Indian sample. Statistical significance of the enrichment was calculated using the Wilcoxon paired t-test on the raw data (34). Primer sequences for all the loci tested are provided in Supplementary Table S1.
RESULTS
Coverage of epigenetic analysis and validation
We mapped H3K9me3, H3K9ac, H3K27me3 histone modifications and CTCF binding sites on the Y chromosome of two individuals from two distinct Indian populations—from North and South India—as biological duplicates. As a technical replicate we performed anti H3K9me3 and anti H3K9ac ChIP-on-chip analysis in duplicate with the South Indian sample. Considering the experimental and biological duplicates, we found that on an average, 10 330 of H3K9me3, 12 542 of H3K9ac, 9952 of H3K27me3 and 10 497 of CTCF probes were significantly enriched, at enrichment log ratio ≥1. The global profile of epigenetic marks was found to be very similar and differences were statistically insignificant between the two individuals representing the two different populations, although a large population size analysis is needed to look for individual specific variations (Supplementary Figure S2). Here we used a biological duplicate to find out if the global epigenetic profile to see the degree of similarity between the two distantly related individuals. Considering the overall similarity in experimental and biological duplicates, we have discussed further only the data obtained from the South Indian sample.
To further validate the ChIP-on-chip experiment we performed independent ChIP assays followed by quantitative real time PCR analysis for different histone antibodies using WBCs from the blood sample used for the ChIP-on-chip study. We selected a panel of 13 loci spanning 7 unique genes (PLCXD, SRY, E1F1, DDX3Y, SMCY, UTY and PRKY) and 3 duplicated genes (TSPY, DAZ and CDY) that showed distinct epigenetic patterns in the array data and validated the trend of enrichment with histone antibodies across these loci. To validate the sharply changing pattern in PLCXD, TSPY and DAZ loci (as discussed below), we selected two probes in each case. We observed striking similarity in the two data sets between the relative enrichments of the chromatin marks across the Y-chromosome genes (Supplementary Figure S3). More than 90% of the tested unique loci showed good correlation of ChIP-on-chip results with ChIP-qPCR. The duplicated loci also showed good correlation and, more interestingly, as in case of ChIP-on-chip results, ChIP-qPCR also showed low enrichment with these antibodies. These observations not only support our results but also suggest that duplicated loci can be studied for epigenetic modifications using this approach. ChIP-qPCR results confirmed that H3K9ac mark was most abundant around the promoters of E1F1, SMCY, PRKY and DDX3Y, which are expressed in blood cells while silenced SRY gene appeared to be mostly associated with the repressive marks of hetero-chromatinization, with high methylation at H3K9 as well as H3K27. These results effectively validate the observed ChIP-on-chip patterns of the histone marks and conclusions drawn about the epigenetic patterns across the Y-chromosome from the array data.
As DNA methylation and histone methylation are linked processes we evaluated the DNA methylation status at CpG residues of specific loci to elucidate its role in gene regulation with histone modification. We performed DNA methylation analysis of 18 CpG islands present within the promoter of 9 protein-coding genes (SRY, RPS4Y1, TGIF2LY, TSPY, TBL1Y, CYorf16, DDX3Y, TMSB4Y and VCY1B) and two non-coding genes (TTTY7 and TTTY18). These loci were selected on the basis of their biological importance and observed histone marks. Among these, 6 loci had H3K9ac coinciding with unmethylated CpG islands while 11 loci had H3K9me3 coinciding with methylated CpG islands (Supplementary Table S2). As expected all tested loci followed the conventional relation between H3K9 modification and DNA methylation and further strengthened our analysis.
Global pattern of histone marks on Y chromosome and gene expression
The euchromatin region of the human Y chromosome has been divided into distinct classes of sequences, viz., pseudoautosomal, X-transposed, X-degenerate and ampliconic, on the basis of their origin (13). Globally, we observed that distinct class of sequences, distributed in different regions of the chromosome, showed distinct histone marks whereas sequences of the common origin showed similar epigenetic pattern (Figure 1). To further confirm our visual observations, we calculated average enrichment value for the histone marks in distinct classes of sequences. As expected, different classes of sequences showed a pattern similar to that obtained by visual analysis (Figure 1B). The pseudoautosomal regions present on the ends of both the arms showed predominant enrichment of H3K9ac over H3K9me3 and H3K27me3. In contrast, the X-transposed sequences were more enriched with H3K9me3, while X-degenerate region followed a pattern similar to that of pseudoautosomal region. Most interestingly, ampliconic regions showed lower enrichment with all the three histone modification marks used in this study. Although all these histone marks showed lower enrichment in the ampliconic regions, H3K9me3 was still found to be the predominant mark. The pattern of histone marks shows such a clear pattern across the chromosome that different kind of sequences can be distinguished based on the epigenetic pattern (Figure 1A). These observations suggest that evolution of different sequences in the Y chromosome have distinct epigenetic footprints. This also implies that on a global scale, during evolution, these sequences have not diverged enough to adapt different epigenetic patterns or functional states.
Figure 1.

Association of histone marks with different sequences of the Y chromosome. (A) Features of the Y chromosome are shown on the top, telomere, centromere and heterochromatin (black), and euchromatin. Different kinds of sequences in euchromatin are represented as colored blocks on the chromosome, blue (pseudoautosomal region), green (X-degenerate), red (X-transposed) and yellow (ampliconic). To visualize the data clearly, both enriched and not enriched regions have been shown for H3K9me3, H3K9ac and H3K27me3 histone modifications in dark red, blue and orange, respectively (the same convention has been followed in all the other figures also). We observe a specific global pattern of histone marks in different classes of sequences—the pseudoautosomal region is predominately enriched with H3K9ac, the X transposed is enriched with H3K9me3, the X-degenerate region shows almost equal enrichment with all marks and the ampliconic regions show a low enrichment with all histone marks, H3K9me3 being the most enriched. (B) Here we show the average enrichment of histone marks in different classes of sequences distributed along the chromosome. As visually observed in Figure 1A, different classes of sequences have a global pattern of histone marks. The pattern of histone marks in different class of sequences followed the visual observation except in the case of X-degenerate region. In visual analysis X-degenerate is enriched equally with H3K9me3 and H3K9ac but when we calculated average enrichment in different region we found that H3K9ac is more enriched than H3K9me3. In the given table, each class of sequences, from short (p) and long (q) arm are clubbed together to simplify the table.
We also analyzed the association of histone marks and CTCF enrichment upstream to the transcription start site (up to ∼1 kb upstream promoter sequence) of each gene in the different classes of sequences. The enrichment of histone marks and CTCF within 1 kb from transcriptional start site (TSS) was calculated using UCSC genome browser. Surprisingly, we observed that the genes present in a class of sequences showed a pattern of H3K9ac, H3K9me3 and H3K27me3 modifications similar to the global epigenetic pattern of that class. For example, genes present in the pseudoautosomal and X-degenerate regions were predominantly enriched with H3K9ac, genes in the X-transposed region were mostly enriched with H3K9me3 and genes in the ampliconic regions were found to be generally poor in all the examined histone marks at the TSS, with H3K9me3 showing predominant enrichment (Table 1). These observations suggest that there may be a global regulation operating to regulate one kind of sequences. Most surprisingly, a global regulation of similar kind of sequences is also borne out by the fact that genes present in same class of sequences follow same expression pattern.
Table 1.
Analysis of histone marks and CTCF binding at promoter of the genes
 |
 |
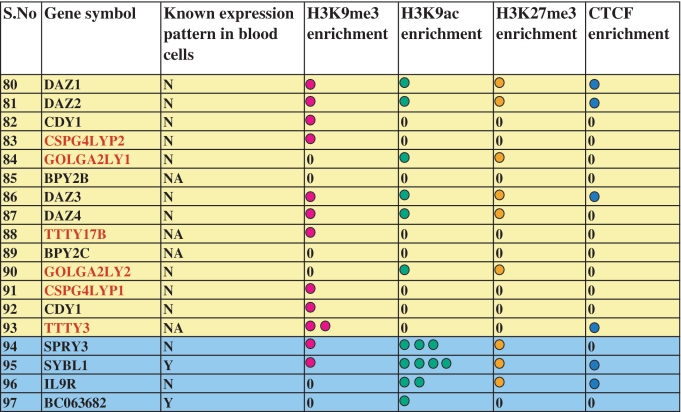 |
97 genes of the Y chromosome are listed as per their occurrence across the chromosome. Genes in rows of same color are present in the same kind of sequences in the chromosome (pseudoautosomal-blue, X-transposed-light red, X-degenerate-light green and ampliconic-yellow). Column 3 shows expression pattern of genes in whole blood and in different cell lineages of the blood. Expression status has been denoted as Y, Yes; N, No; M, Mix; NA, Not Available. Histone modifications and CTCF enrichment within 1.0 kb upstream of each gene has been listed in column 4 to 7. Number of circles in each row denotes the average enrichment of histone marks and CTCF as calculated by UCSC browser. Each colored circle shows an average enrichment value of 0.5 and 0 denotes average enrichment value less than 0.25. Globally we see that genes present in one class of sequence show similar histone modification pattern. Hyper acetylation at H3K9 was seen on promoters of genes present in pseudoautosomal and X-degenerate regions while hyper methylation at H3K9 was observed on promoters of genes present in X transposed and ampliconic regions
To further understand epigenetic output in terms of gene expression, we compared our histone modification data with gene expression data of human blood cells from the UCSC genome browser (GNF Expression Atlas 2 Data from U133A and GNF1H) (35). Hyper-acetylation of H3K9 was observed at the promoters of 44 genes, of which 28 genes are known to express in blood cells and for 2 genes expression pattern is unknown. The remaining 14 genes that do not express in blood cells indicate a different mechanism of repression that can tolerate the presence of H3K9ac. We also found that of the 47 genes associated with H3K9me3, 27 are not expressed in blood cells and for 18 genes expression data is not available. Only two genes (both the copies of PRY) are known to express in blood cells in spite of H3K9me3 enrichment. This analysis suggested that although at most of the genomic loci, H3K9me3 and H3K9ac regulate the loci as per conventional rule, there are a few exceptions. In our analysis, at many loci, the gene expression profile and H3K27me3 enrichment did not correlate well while H3K9me3 and H3K9ac showed better agreement with the expression status (Table 1). This observation suggests a mechanism whereby H3K9me3 and H3K9ac dominate over H3K27me3 modification to set the expression state of the chromatin, which can be further regulated by other sets of histone modifiers. Finally, there were instances when none of the tested modifications were enriched indicating the presence of other histone modifications and mechanisms to regulate the expression of those genes.
Tandem repeats and epigenetic modifications
The Y chromosome is full of repeats, which were initially thought to be junk, but now they are known to be important in maintaining the integrity of the Y chromosome in the absence of meiotic recombination (13). One such class of repeat is the tandem repeat which constitutes ∼10% of human genome (36). These repeats are distributed in a non-random fashion and clustered at coding regions, near the centromere and telomeres (37). A change in the number of tandem repeats is not neutral, and can affect many basic cell processes like replication, transcription and translation because they recruit several factors which can change the status of the chromatin (38,39).
Accordingly, we also took care to design probes from tandem repeat regions unique to the Y chromosome with their counterparts on the X chromosome. We found that different tandem repeats associated with the Y chromosome are marked with a specific pattern of histone modifications. Most of the repeats showed a precise and clean pattern with the tested histone marks and CTCF binding. Such tandem repeats were distributed at both genic and intergenic regions. Figure 2A shows a locus of intergenic tandem repeats present near the telomeric region of the p arm. At this locus, tandem repeat-1 (each unit: 61 bp) was not enriched with any of the tested modifications, whereas another tandem repeat-2 (each unit: 26 bp) present just next to it was enriched preferentially with H3K9ac and CTCF. Epigenetic marks changed sharply with the change of the repeat, with different repeats showing their characteristic epigenetic marks and potential functional value. Interestingly, genic tandem repeats distributed near the TSS and introns of genes also showed precise and clean association with the tested histone marks and CTCF as observed for the intergenic tandem repeats. In the case of P2RY8, PPP2R3B, CSF2R, SHOX, ASMTL, IL3RA and GTPBP6 genes, tandem repeats were clustered in the introns, while in the case of PLCXD1 and ASMTL genes, they were clustered near the TSS. For example, many tandem repeats are clustered around TSS of PLCXD1 a gene, which is expressed in blood cells. Each kind of tandem repeat has a pattern of histone modification and CTCF enrichment, which sharply changes with the change of repeat. As marked in Figure 2B, repeat-1 is highly enriched with H3K9ac and H3K27me3, whereas the upstream repeat-2 region is not enriched with any tested marks and repeat-3 is enriched only with H3K9ac and CTCF. The CpG island distributed around the TSS is enriched with H3K9ac, H3K27me3 and CTCF. Interestingly, none of the tandem repeats at this locus showed enrichment with H3K9me3. The observed pattern of H3K9ac, H3K27me3 and CTCF marks on different tandem repeats suggests a domain of active chromatin, which correlates well with the known expression of the PLCXD1 gene in blood cells. Precise and specific association of tandem repeats with different histone modifications shows that the presence of such repeats can change the status of chromatin by interacting with different factors like CTCF that can have regulatory consequences. These repeats thus appear to act as regulatory elements to recruit factors for transcriptional control of the gene. As observed in the above mentioned cases, many tandem repeats were not enriched with tested histone modifications and CTCF, suggesting involvement of other histone modifications, histone variants and factors in the regulation of such repeats. Our observation of non-conflicting histone patterns also suggests that all the copies of the repeat carry the same histone marks. Our findings imply that tandem repeats at several places in the genome can have regulatory consequences. Enrichment of CTCF at the tandem repeats suggests a role for these sequences in chromatin-mediated regulation of genome organization and transcription.
Figure 2.

Profile of histone marks and CTCF with tandem repeats. Histone modification and CTCF binding profile are shown at different genomic coordinates with the tandem repeats. (A) Different kinds of tandem repeats present next to each other are shown in the Y chromosome. Two big tandem repeats are numbered as 1 and 2. Tandem repeat 1 does not show any enrichment with the tested antibodies whereas repeat 2 is enriched with H3K9ac and CTCF. There are few more tandem repeats on the right side of the tandem repeat 2, which does not show enrichment with any of the tested antibodies. (B) Multiple tandem repeats associated with the PLCXD1 gene (blue line with arrow) have been shown with the histone modification and CTCF binding profile. Tandem repeats have been marked in the figure as 1, 2 and 3. Tandem repeat-3 enriches with anti-H3K9ac and anti-CTCF, tandem repeat-2 does not enrich with any of the tested antibodies whereas repeat-1 is enriched with anti-H3K9ac and anti-H3K27me3.
Y chromosome linked oncogenesis and epigenetic regulation
In this study, we also analyzed a critical oncogenic region, the gonadoblastoma locus on the Y chromosome (GBY), which contains an array of the Testis-specific protein Y-encoded (TSPY) and Testis transcript Y (TTTY) genes. They have been linked to gonadoblastoma in intersex patients, testicular germ cell tumors, prostate cancer and other somatic cancers (20,24). TSPY shows homology with the SET oncogenes and interacts with Cyclin B protein, suggesting its role in the regulation of cell proliferation (20). Furthermore, high expression of TSPY in testicular and prostate cancer is implicated in tumorigenesis (40). TSPY is present in an array on the short arm of the Y chromosome and its number varies from 20 to 40 (41,42). As these genes are present in an array and show a high degree of similarity in DNA sequence, we designed probes for nine copies of this gene. We designed a few unique probes and used other probes that could hybridize to all the copies of the duplicated region. Surprisingly, we found that the epigenetic marks at this region are set in a repeating pattern analogous to the repetitive unit of the TSPY genes. The repetitive pattern of H3K9me3 modification and CTCF binding at the TSPY gene cluster has a 20.7 kb epigenetic repeat unit (Figure 3). H3K9me3 is highly enriched around the start site of each TSPY gene and spreads over a 6.4 kb region. Enrichment of H3K9me3 starts about 4 kb upstream of the TSPY gene and peaks around the transcription start site, diminishing gradually towards the end of the gene. A small 1.6 kb region, present at the end of each 20.7 kb epigenetic repeat unit is also enriched with H3K9me3 and CTCF. Moreover, a ∼7.2 kb region, upstream of the gene between the two H3K9me3 rich sequences, is devoid of any modifications tested, while a 5.5 kb region (marked in blue) downstream of the gene has minimal H3K9me3 and CTCF enrichment. We also noticed overlapping CTCF binding and H3K9me3 enrichment, suggesting a link between the two, which might contribute to a locus-specific epigenetic regulatory combination. The specific and non-conflicting pattern of H3K9me3 and H3K9ac histone modifications observed suggests that all the copies of the gene are associated with a comparable epigenetic state. This implies that the regulatory sequences of TSPY genes have not diverged after expansion and a common mechanism operates at this region. We also analyzed DNA methylation at two CpG islands upstream of the TSPY gene and found that they were hyper-methylated, correlating with the repressed state of TSPY in blood cells.
Figure 3.

Epigenetic pattern and CTCF binding at TSPY gene arrays. Four genes of the TSPY array have been shown with their repetitive histone modification and CTCF distribution patterns. The profile of H3K9me3 was used to divide the whole region in the domains of 20.7 kb (written in pink) and H3K9me3 demarcates each domain. One domain has been shown below separately, divided in four parts using colored lines (black, red, green and blue). The start site of the gene is sharply enriched with H3K9me3, which shows highest peak and then further decrease towards both the sides (∼6.4 kb). In the red-labeled (∼7.2 kb) region none of the tested antibodies show any enrichment whereas in the blue labeled (∼5.5 kb) region, there is little enrichment of H3K9me3 and CTCF. The black marked ∼1.6 kb region upstream of the gene also shows H3K9me3 and CTCF enrichment.
The oncogenic GBY locus also has an array of a non-protein-coding gene, TTTY. We found that the entire TTTY array showed high enrichment of H3K9me3 in comparison with other tested histone marks (Supplementary Figure S4). As expected, the promoters of all TTTY genes at this locus also showed predominant enrichment of the H3K9me3 mark (Table 1). We analyzed the DNA methylation status in this region and found the CpGs present in the region to be methylated (Supplementary Table S2). These observations suggest that H3K9me3 and DNA methylation are necessary for repression of the TSPY and TTTY gene clusters at the GBY locus.
Epigenetic marks at sex determining gene SRY
SRY gene (Sex determining region, Y chromosome encoded), encodes a testis-determining factor essential for differentiation of Sertoli cells to induce masculinization of the embryonic gonad. Despite the key role played by SRY in genital development, its epigenetic profile has not been well studied. We found CTCF to be enriched in the region upstream of its TSS, with maximum binding within the CpG island (Figure 4). Interestingly, H3K9me3 was absent from the region of maximum CTCF binding, whereas H3K9ac and H3K27me3 were enriched. H3K9ac and H3K27me3 histone modifications taper down from the CTCF peak to the body of the gene, while enrichment of H3K9me3 starts from the transcription start site. As DNA methylation eliminates binding of CTCF to its recognition sites (43), it is interesting to note that bisulfite analysis found this CpG island to be unmethylated. High enrichment of H3K27me3 next to the CTCF binding supports the hypothesis that CTCF has the ability to recruit members of the PRC2 complex (44,45), and presents a potential mechanism for the repression of the SRY gene in blood cells. This interesting epigenetic pattern exemplifies a chromatin-mediated suppression mechanism based on recruitment of repressive factors by CTCF rather than by DNA methylation mediated gene silencing. Finally, we observed a conflicting pattern of H3K9ac and H3K9me3 marks within the gene body. This could be because SRY is expressed in the B-cell lineage but not in all other blood cell lineages. These epigenetic marks reflected a novel mechanism that represses the transcription of this gene in some blood cell lineages.
Figure 4.

Epigenetic pattern of SRY gene. Co-ordinates of the SRY gene in the chromosome are given above in the figure while the gene body has been shown below. The genomic CpG island and the clone use to analyse the methylation status of the island are shown below the gene. We see a high enrichment of H3K9me3 at the start site and in the body of the gene, while H3K9ac and H3K27me3 are enriched from the body of the gene to upstream of the gene. A very clean enrichment of CTCF was seen at the CpG island upstream of the gene.
Histone modifications at AZF locus
Almost all the ampliconic sequences on the long arm of the chromosome are collectively called the Azospermia factor (AZF). Deletion of the AZF has been observed in a number of the human male related infertility cases. This region has multiple palindromes, which go through intra-chromosomal recombination’s, resulting in deletion of the genes required for male fertility (46,47). The AZF region contains DDX3Y, DBY, XKRY, EIF1AY, RPS4Y2, RBMY, PRY, BPY, DAZ and CDY genes. Our results showed a low enrichment of all tested histone modifications in the AZF region. DDX3Y, EIF1AY and XKRY genes were enriched with H3K9ac, RBMY and CDY genes were enriched with H3K9me3, RPS4Y2 and DAZ genes showed a mixed pattern, whereas BPY did not show enrichment with any of the tested antibodies (Table 1). We found that most of the genes show a clean epigenetic pattern at different loci except the multi-copy DAZ (Figure 5) gene and the single copy RPS4Y gene. From this, we can reason that the mixed pattern at the single copy gene RPS4Y is because of the known differential expression in different blood cell lineages. Moreover, duplicated DAZ genes show enrichment with both H3K9me3 and H3K9ac, suggesting a diversion of epigenetic regulation at different loci after gene duplication, which may have led to changes in gene regulation (Figure 5). This indicates that after duplication, the regulatory elements of at least one of the copies have diverged to attain differential histone marks. The differential expression pattern of all the copies of DAZ has not been studied because of the high sequence similarity. In a preliminary study, however, polymorphic expression of DAZ gene copies was observed (48), supporting the idea that after duplication, regulatory elements of different copies of the DAZ gene have different histone modifications and therefore different regulation. As mutation in the DAZ gene region is correlated with azospermia, the function of this gene is non-redundant and essential; therefore, the cell has not adopted to silence all copies of the gene. In contrast to the TSPY gene cluster (where all the duplicated copies have non-conflicting mark), only a few copies are preferentially silenced to balance the copy number in the case of duplicated DAZ gene.
Figure 5.

Pattern of H3K9ac and H3K9me3 at DAZ gene loci. It shows DAZ gene, a duplicated gene with conflicting histone marks. The figure shows two copies of the DAZ gene, DAZ3 and DAZ4 present in opposite directions and the pattern of H3K9ac and H3K9me3 marks. Both alleles show almost equal enrichment of H3K9ac and H3K9me3 at their transcriptional start site.
DISCUSSION
Cell type-specific genome packaging defines the epigenome set during cellular differentiation. Epigenetic marks have been shown to specify the patterns of gene expression and a number of whole-genome epigenetic mapping studies of human cells have been done in the recent past to explore the functional states across genome (2,49,50). None of these, however, have explored the epigenetic signatures on the Y chromosome (1,2,26,27), presumably because of the presence of many repeats and the instability of the chromosome in various cultured cell lines. In this study, we have analyzed chromatin from WBCs and designed Y chromosome specific probes from both unique and duplicated regions to create an epigenetic map of the human Y chromosome. Unique probes were specific to unique regions of the Y chromosome, while probes for multi-copy loci were designed from sequences that are duplicated but are unique to Y chromosome and regions having homologues on X chromosome.
The evolutionary origin of the sequences that constitute the Y chromosome is known and it has been observed that genes distributed in sequences of the same origin have a similar expression pattern (13). We observed a global conservation of the epigenetic pattern associated with sequences of the same origin, which changed sharply at sequences of different origin. This implies that similar regulatory mechanisms might operate across genes that share a common origin and epigenetic profile, resulting in their similar expression pattern (35). This also insinuates that these sequences have not diverged enough to have different functions after they became part of the Y chromosome. Surprisingly, even regions of internal duplication within the Y chromosome showed non-conflicting epigenetic marks in our analysis, suggesting that after duplication, the associated loci have maintained similar regulatory environments. For instance, all copies of the TSPY and TTTY genes appear to be silenced in the WBCs by mechanisms that involve methylation of H3K9 around their promoters and methylation of DNA at associated CpG islands. This locus has been linked to oncogenesis and loss of methylation at both DNA and histone has been observed at the promoters of oncogenes in many cancers. It is possible that in the case of gonadoblastoma, the GBY locus may be hypomethylated, resulting in overexpression of TSPY and TTTY genes (51,52). Therefore, it would be interesting to test the epigenetic marks associated with this region in cancer tissues to explore the epigenetic regulation of GBY loci in different male-specific cancers.
Among the internally duplicated regions (palindromes) on the long arm, only DAZ genes at the AZF locus showed conflicting patterns of histone marks, suggesting that in these clusters, different copies of the genes may be regulated differently. It is possible that in the case of genes with non-redundant functions, mechanisms have evolved for silencing some of the copies to enable normal functioning of the cell, as an alternative to maintaining all the copies in a repressed or expressed state. The non-conflicting histone patterns observed for the rest of the duplicated genes suggest the ability of the cell to function normally with multiple copies of these genes being expressed after the duplication event. In the absence of meiotic recombination, palindromes may make the Y chromosome unstable, but our observation of very similar epigenetic marks on duplicated regions in contrast to expected results (53) indicates a regulatory mechanism at play that maintains the integrity of the Y chromosome in the absence of meiotic recombination and keeps global epigenetic regulation unchanged during evolution (16,46).
In this study, we have used profiles of histone modifications and CTCF binding to explore and correlate the transcriptional potential of most of the genes of the Y chromosome. The association of CTCF with different marks of histone and DNA methylation in the case of SRY, TSPY and tandem repeats suggests how epigenetic changes may lead to chromatin-mediated regulation of different coding and non-coding components of the genome. Interestingly, non-overlapping enrichment of H3K9me3 and DNA methylation at CpG islands of SRY and overlapping enrichment of the two at TSPY locus suggests that same epigenetic tools can be used differently at different loci. This also suggests the differential regulation of H3K9me3 modification and CTCF binding at each locus by other locus-specific factors. As observed in genic regions, we found distinct patterns of histone modifications and CTCF binding associated with different tandem repeats as well. Our data indicates that tandem repeats are capable of recruiting different kinds of chromatin modifiers, irrespective of their position, by virtue of their association with specific histone marks and this may play a role in setting the functional state of the chromatin. This suggests a non-neutral role for tandem repeats in recruiting various epigenetic regulatory factors. Since tandem repeats are known to be associated with almost every component of the genome, their epigenetic regulation can govern a large number of genomic loci by influencing many important cell processes like genome organization, replication and transcription. As CTCF is a transcriptional repressor and also binds with chromatin insulators (44), in these cases it may coordinate transcription of genes through higher order chromatin-mediated regulation.
This analysis also provides a way to study the epigenetic profile associated with multi-copy genes as a representation of the average pattern across all the copies. Analysis of ChIP data from probes representing repeated regions carries a risk of misinterpretation, however a cautious approach can yield new insights into the possible mechanisms of global epigenetic regulation. When duplicated loci carry the same epigenetic marks, the epigenetic pattern is observed to be non-conflicting with a clear association with specific marks, whereas in cases where the duplicated genes have diverged significantly and have distinct epigenetic marks, conflicting histone modifications can be expected. This strategy is, therefore, useful in identifying the diversion in epigenetic regulation at duplicated loci. As our understanding of histone marks and their functional meaning increases, it is becoming more and more apparent that the functional status of a locus is decided by a complex histone code based on a combination of multiple histone modifications (3,7). Further mapping of other known histone marks, histone variants and chromatin modifiers would, therefore, be extremely useful in understanding various Y chromosome associated diseases.
SUPPLEMENTARY DATA
Supplementary Data are available at NAR Online.
FUNDING
Council for Scientific and Industrial Research (CSIR) fellowships (to N.P.S. and R.S.); Department of Biotechnology, Government of India (grant no. BT/PR6728/Med/U2/261/2005 to R.K.M. and S.K.). Funding for open access charge: Institutional core funding of the Centre for Cellular and Molecular Biology.
Conflict of interest statement. None declared.
Supplementary Material
ACKNOWLEDGEMENTS
We thank Prof. H. Sarat Chandra for initiating the discussion that lead to this analysis.
REFERENCES
- 1.Meissner A, Mikkelsen TS, Gu H, Wernig M, Hanna J, Sivachenko A, Zhang X, Bernstein BE, Nusbaum C, Jaffe DB, et al. Genome-scale DNA methylation maps of pluripotent and differentiated cells. Nature. 2008;454:766–770. doi: 10.1038/nature07107. [DOI] [PMC free article] [PubMed] [Google Scholar]
- 2.Barski A, Cuddapah S, Cui K, Roh TY, Schones DE, Wang Z, Wei G, Chepelev I, Zhao K. High-resolution profiling of histone methylations in the human genome. Cell. 2007;129:823–837. doi: 10.1016/j.cell.2007.05.009. [DOI] [PubMed] [Google Scholar]
- 3.Jenuwein T, Allis CD. Translating the histone code. Science. 2001;293:1074–1080. doi: 10.1126/science.1063127. [DOI] [PubMed] [Google Scholar]
- 4.Ng RK, Gurdon JB. Epigenetic inheritance of cell differentiation status. Cell Cycle. 2008;7:1173–1177. doi: 10.4161/cc.7.9.5791. [DOI] [PubMed] [Google Scholar]
- 5.Turner BM. Defining an epigenetic code. Nat. Cell Biol. 2007;9:2–6. doi: 10.1038/ncb0107-2. [DOI] [PubMed] [Google Scholar]
- 6.Kondo Y, Issa JP. Epigenetic changes in colorectal cancer. Cancer Metastasis Rev. 2004;23:29–39. doi: 10.1023/a:1025806911782. [DOI] [PubMed] [Google Scholar]
- 7.Linggi BE, Brandt SJ, Sun ZW, Hiebert SW. Translating the histone code into leukemia. J. Cell. Biochem. 2005;96:938–950. doi: 10.1002/jcb.20604. [DOI] [PubMed] [Google Scholar]
- 8.Cross SH, Clark VH, Simmen MW, Bickmore WA, Maroon H, Langford CF, Carter NP, Bird AP. CpG island libraries from human chromosomes 18 and 22: landmarks for novel genes. Mamm. Genome. 2000;11:373–383. doi: 10.1007/s003350010071. [DOI] [PubMed] [Google Scholar]
- 9.Ioshikhes IP, Zhang MQ. Large-scale human promoter mapping using CpG islands. Nat. Genet. 2000;26:61–63. doi: 10.1038/79189. [DOI] [PubMed] [Google Scholar]
- 10.Francis NJ, Follmer NE, Simon MD, Aghia G, Butler JD. Polycomb proteins remain bound to chromatin and DNA during DNA replication in vitro. Cell. 2009;137:110–122. doi: 10.1016/j.cell.2009.02.017. [DOI] [PMC free article] [PubMed] [Google Scholar]
- 11.Hansen KH, Bracken AP, Pasini D, Dietrich N, Gehani SS, Monrad A, Rappsilber J, Lerdrup M, Helin K. A model for transmission of the H3K27me3 epigenetic mark. Nat. Cell Biol. 2008;10:1291–1300. doi: 10.1038/ncb1787. [DOI] [PubMed] [Google Scholar]
- 12.Aoto T, Saitoh N, Sakamoto Y, Watanabe S, Nakao M. Polycomb group protein-associated chromatin is reproduced in post-mitotic G1 phase and is required for S phase progression. J. Biol. Chem. 2008;283:18905–18915. doi: 10.1074/jbc.M709322200. [DOI] [PubMed] [Google Scholar]
- 13.Skaletsky H, Kuroda-Kawaguchi T, Minx PJ, Cordum HS, Hillier L, Brown LG, Repping S, Pyntikova T, Ali J, Bieri T, et al. The male-specific region of the human Y chromosome is a mosaic of discrete sequence classes. Nature. 2003;423:825–837. doi: 10.1038/nature01722. [DOI] [PubMed] [Google Scholar]
- 14.Tilford CA, Kuroda-Kawaguchi T, Skaletsky H, Rozen S, Brown LG, Rosenberg M, McPherson JD, Wylie K, Sekhon M, Kucaba TA, et al. A physical map of the human Y chromosome. Nature. 2001;409:943–945. doi: 10.1038/35057170. [DOI] [PubMed] [Google Scholar]
- 15.Garrigan D, Hammer MF. Reconstructing human origins in the genomic era. Nat. Rev. Genet. 2006;7:669–680. doi: 10.1038/nrg1941. [DOI] [PubMed] [Google Scholar]
- 16.Jobling MA, Tyler-Smith C. The human Y chromosome: an evolutionary marker comes of age. Nat. Rev. Genet. 2003;4:598–612. doi: 10.1038/nrg1124. [DOI] [PubMed] [Google Scholar]
- 17.Ellegren H, Parsch J. The evolution of sex-biased genes and sex-biased gene expression. Nat. Rev. Genet. 2007;8:689–698. doi: 10.1038/nrg2167. [DOI] [PubMed] [Google Scholar]
- 18.Jobling MA, Tyler-Smith C. New uses for new haplotypes the human Y chromosome, disease and selection. Trends Genet. 2000;16:356–362. doi: 10.1016/s0168-9525(00)02057-6. [DOI] [PubMed] [Google Scholar]
- 19.Wilhelm D, Koopman P. The makings of maleness: towards an integrated view of male sexual development. Nat. Rev. Genet. 2006;7:620–631. doi: 10.1038/nrg1903. [DOI] [PubMed] [Google Scholar]
- 20.Oram SW, Liu XX, Lee TL, Chan WY, Lau YF. TSPY potentiates cell proliferation and tumorigenesis by promoting cell cycle progression in HeLa and NIH3T3 cells. BMC Cancer. 2006;6:154. doi: 10.1186/1471-2407-6-154. [DOI] [PMC free article] [PubMed] [Google Scholar]
- 21.Delbridge ML, Longepied G, Depetris D, Mattei MG, Disteche CM, Marshall Graves JA, Mitchell MJ. TSPY, the candidate gonadoblastoma gene on the human Y chromosome, has a widely expressed homologue on the X - implications for Y chromosome evolution. Chromosome Res. 2004;12:345–356. doi: 10.1023/B:CHRO.0000034134.91243.1c. [DOI] [PubMed] [Google Scholar]
- 22.Crow TJ. Handedness, language lateralisation and anatomical asymmetry: relevance of protocadherin XY to hominid speciation and the aetiology of psychosis. Point of view. Br. J. Psychiatry. 2002;181:295–297. doi: 10.1192/bjp.181.4.295. [DOI] [PubMed] [Google Scholar]
- 23.Lahn BT, Page DC. Functional coherence of the human Y chromosome. Science. 1997;278:675–680. doi: 10.1126/science.278.5338.675. [DOI] [PubMed] [Google Scholar]
- 24.Lau YF. Gonadoblastoma, testicular and prostate cancers, and the TSPY gene. Am. J. Hum. Genet. 1999;64:921–927. doi: 10.1086/302353. [DOI] [PMC free article] [PubMed] [Google Scholar]
- 25.Subramanian S, Mishra RK, Singh L. Genome-wide analysis of Bkm sequences (GATA repeats): predominant association with sex chromosomes and potential role in higher order chromatin organization and function. Bioinformatics. 2003;19:681–685. doi: 10.1093/bioinformatics/btg067. [DOI] [PubMed] [Google Scholar]
- 26.Kim TH, Barrera LO, Zheng M, Qu C, Singer MA, Richmond TA, Wu Y, Green RD, Ren B. A high-resolution map of active promoters in the human genome. Nature. 2005;436:876–880. doi: 10.1038/nature03877. [DOI] [PMC free article] [PubMed] [Google Scholar]
- 27.Lister R, Pelizzola M, Dowen RH, Hawkins RD, Hon G, Tonti-Filippini J, Nery JR, Lee L, Ye Z, Ngo QM, et al. Human DNA methylomes at base resolution show widespread epigenomic differences. Nature. 2009;462:315–322. doi: 10.1038/nature08514. [DOI] [PMC free article] [PubMed] [Google Scholar]
- 28.Dunn KL, Davie JR. The many roles of the transcriptional regulator CTCF. Biochem. Cell Biol. 2003;81:161–167. doi: 10.1139/o03-052. [DOI] [PubMed] [Google Scholar]
- 29.Kim TH, Abdullaev ZK, Smith AD, Ching KA, Loukinov DI, Green RD, Zhang MQ, Lobanenkov VV, Ren B. Analysis of the vertebrate insulator protein CTCF-binding sites in the human genome. Cell. 2007;128:1231–1245. doi: 10.1016/j.cell.2006.12.048. [DOI] [PMC free article] [PubMed] [Google Scholar]
- 30.Lewis A, Murrell A. Genomic imprinting: CTCF protects the boundaries. Curr. Biol. 2004;14:R284–R286. doi: 10.1016/j.cub.2004.03.026. [DOI] [PubMed] [Google Scholar]
- 31.Holohan EE, Kwong C, Adryan B, Bartkuhn M, Herold M, Renkawitz R, Russell S, White R. CTCF genomic binding sites in Drosophila and the organisation of the bithorax complex. PLoS Genet. 2007;3:e112. doi: 10.1371/journal.pgen.0030112. [DOI] [PMC free article] [PubMed] [Google Scholar]
- 32.Reich D, Thangaraj K, Patterson N, Price AL, Singh L. Reconstructing Indian population history. Nature. 2009;461:489–494. doi: 10.1038/nature08365. [DOI] [PMC free article] [PubMed] [Google Scholar]
- 33.Hajkova P, el-Maarri O, Engemann S, Oswald J, Olek A, Walter J. DNA-methylation analysis by the bisulfite-assisted genomic sequencing method. Methods Mol. Biol. 2002;200:143–154. doi: 10.1385/1-59259-182-5:143. [DOI] [PubMed] [Google Scholar]
- 34.Yuan JS, Reed A, Chen F, Stewart CNJ. Statistical analysis of real-time PCR data. BMC Bioinformatics. 2006;7:85. doi: 10.1186/1471-2105-7-85. [DOI] [PMC free article] [PubMed] [Google Scholar]
- 35.Su AI, Wiltshire T, Batalov S, Lapp H, Ching KA, Block D, Zhang J, Soden R, Hayakawa M, Kreiman G, et al. A gene atlas of the mouse and human protein-encoding transcriptomes. Proc. Natl Acad. Sci. USA. 2004;101:6062–6067. doi: 10.1073/pnas.0400782101. [DOI] [PMC free article] [PubMed] [Google Scholar]
- 36.Benson G. Tandem repeats finder: a program to analyze DNA sequences. Nucleic Acids Res. 1999;27:573–580. doi: 10.1093/nar/27.2.573. [DOI] [PMC free article] [PubMed] [Google Scholar]
- 37.Verstrepen KJ, Jansen A, Lewitter F, Fink GR. Intragenic tandem repeats generate functional variability. Nat. Genet. 2005;37:986–990. doi: 10.1038/ng1618. [DOI] [PMC free article] [PubMed] [Google Scholar]
- 38.Pearson CE, Nichol Edamura K, Cleary JD. Repeat instability: mechanisms of dynamic mutations. Nat. Rev. Genet. 2005;6:729–742. doi: 10.1038/nrg1689. [DOI] [PubMed] [Google Scholar]
- 39.Usdin K. The biological effects of simple tandem repeats: lessons from the repeat expansion diseases. Genome Res. 2008;18:1011–1019. doi: 10.1101/gr.070409.107. [DOI] [PMC free article] [PubMed] [Google Scholar]
- 40.Su MT, Lee IW, Kuo PL. Presence of TSPY transcript and absence of transcripts of other Y chromosomal genes in a case of microscopic gonadoblastoma. Gynecol. Oncol. 2006;103:357–360. doi: 10.1016/j.ygyno.2006.05.010. [DOI] [PubMed] [Google Scholar]
- 41.Vogel T, Schmidtke J. Structure and function of TSPY, the Y-chromosome gene coding for the “testis-specific protein”. Cytogenet. Cell Genet. 1998;80:209–213. doi: 10.1159/000014982. [DOI] [PubMed] [Google Scholar]
- 42.Krick R, Jakubiczka S, Arnemann J. Expression, alternative splicing and haplotype analysis of transcribed testis specific protein (TSPY) genes. Gene. 2003;302:11–19. doi: 10.1016/s0378-1119(02)01104-6. [DOI] [PubMed] [Google Scholar]
- 43.Butcher DT, Mancini-DiNardo DN, Archer TK, Rodenhiser DI. DNA binding sites for putative methylation boundaries in the unmethylated region of the BRCA1 promoter. Int. J. Cancer. 2004;111:669–678. doi: 10.1002/ijc.20324. [DOI] [PubMed] [Google Scholar]
- 44.Phillips JE, Corces VG. CTCF: master weaver of the genome. Cell. 2009;137:1194–1211. doi: 10.1016/j.cell.2009.06.001. [DOI] [PMC free article] [PubMed] [Google Scholar]
- 45.Lutz M, Burke LJ, Barreto G, Goeman F, Greb H, Arnold R, Schultheiss H, Brehm A, Kouzarides T, Lobanenkov V, et al. Transcriptional repression by the insulator protein CTCF involves histone deacetylases. Nucleic Acids Res. 2000;28:1707–1713. doi: 10.1093/nar/28.8.1707. [DOI] [PMC free article] [PubMed] [Google Scholar]
- 46.Lange J, Skaletsky H, van Daalen SK, Embry SL, Korver CM, Brown LG, Oates RD, Silber S, Repping S, Page DC. Isodicentric Y chromosomes and sex disorders as byproducts of homologous recombination that maintains palindromes. Cell. 2009;138:855–869. doi: 10.1016/j.cell.2009.07.042. [DOI] [PMC free article] [PubMed] [Google Scholar]
- 47.Repping S, Skaletsky H, Lange J, Silber S, Van Der Veen F, Oates RD, Page DC, Rozen S. Recombination between palindromes P5 and P1 on the human Y chromosome causes massive deletions and spermatogenic failure. Am. J. Hum. Genet. 2002;71:906–922. doi: 10.1086/342928. [DOI] [PMC free article] [PubMed] [Google Scholar]
- 48.Kim B, Lee Y, Kim Y, Lee KH, Chun S, Rhee K, Seo JT, Kim SW, Paick JS. Polymorphic expression of DAZ proteins in the human testis. Hum. Reprod. 2009;24:1507–1515. doi: 10.1093/humrep/dep032. [DOI] [PubMed] [Google Scholar]
- 49.Wang Z, Zang C, Rosenfeld JA, Schones DE, Barski A, Cuddapah S, Cui K, Roh TY, Peng W, Zhang MQ, et al. Combinatorial patterns of histone acetylations and methylations in the human genome. Nat. Genet. 2008;40:897–903. doi: 10.1038/ng.154. [DOI] [PMC free article] [PubMed] [Google Scholar]
- 50.Hayashi H, Nagae G, Tsutsumi S, Kaneshiro K, Kozaki T, Kaneda A, Sugisaki H, Aburatani H. High-resolution mapping of DNA methylation in human genome using oligonucleotide tiling array. Hum. Genet. 2007;120:701–711. doi: 10.1007/s00439-006-0254-6. [DOI] [PubMed] [Google Scholar]
- 51.Irizarry RA, Ladd-Acosta C, Wen B, Wu Z, Montano C, Onyango P, Cui H, Gabo K, Rongione M, Webster M, et al. The human colon cancer methylome shows similar hypo- and hypermethylation at conserved tissue-specific CpG island shores. Nat. Genet. 2009;41:178–186. doi: 10.1038/ng.298. [DOI] [PMC free article] [PubMed] [Google Scholar]
- 52.Jiang L, Gonda TA, Gamble MV, Salas M, Seshan V, Tu S, Twaddell WS, Hegyi P, Lazar G, Steele I, et al. Global hypomethylation of genomic DNA in cancer-associated myofibroblasts. Cancer Res. 2008;68:9900–9908. doi: 10.1158/0008-5472.CAN-08-1319. [DOI] [PMC free article] [PubMed] [Google Scholar]
- 53.Graves JA. Sex chromosome specialization and degeneration in mammals. Cell. 2006;124:901–914. doi: 10.1016/j.cell.2006.02.024. [DOI] [PubMed] [Google Scholar]
Associated Data
This section collects any data citations, data availability statements, or supplementary materials included in this article.