Abstract
All known heme-thiolate proteins ligate the heme iron using one cysteine side chain. We previously found that DiGeorge Critical Region 8 (DGCR8), an essential microRNA processing factor, associates with heme of unknown redox state when overexpressed in Escherichia coli. On the basis of the similarity of the 450-nm Soret absorption peak of the DGCR8-heme complex to that of cytochrome P450 containing ferrous heme with CO bound, we identified cysteine 352 as a probable axial ligand in DGCR8. Here we further characterize the DGCR8-heme interaction using biochemical and spectroscopic methods. The DGCR8-heme complex is highly stable, with a half-life exceeding 4 days. Mutation of the conserved proline 351 to an alanine increases the rate of heme dissociation and allows the DGCR8-heme complex to be reconstituted biochemically. Surprisingly, DGCR8 binds ferric heme without CO to generate a hyperporphyrin spectrum. The electronic absorption, magnetic circular dichroism, and electron paramagnetic resonance spectra of the DGCR8-heme complex suggest a ferric heme bearing two cysteine ligands. This model was further confirmed using selenomethionine-substituted DGCR8 and mercury titration. DGCR8 is the first example of a heme-binding protein with two endogenous cysteine side chains serving as axial ligands. We further show that native DGCR8 binds heme when expressed in eukaryotic cells. This study provides a chemical basis for understanding the function of the DGCR8-heme interaction in microRNA maturation.
Keywords: Heme, Ligand Binding Protein, Metalloproteins, MicroRNA, Oxidation Reduction, RNA Binding Protein, RNA Processing, Spectroscopy, Thiol, DiGeorge Syndrome
Introduction
Heme proteins use a variety of amino acids to serve as the axial ligands (the fifth and possibly sixth ligands) for the heme iron. In many cases, such as with hemoglobins (1), soluble guanylate cyclases (2) and heme oxygenases (3), an imidazole moiety of a histidine side chain acts as the fifth ligand. Another major class of heme-binding proteins, exemplified by the cytochrome P450 proteins (4), chloroperoxidases (5), and nitric oxide synthases (6), uses a cysteine side chain as the fifth ligand. This class is called heme-thiolate proteins (7). The functions of these axial ligands include enhancing the affinity and specificity of the protein-heme interaction, modulating the redox properties of the heme, and enabling the heme to serve as catalysts, transporters, or sensors (8, 9). Often, the sixth ligand of the iron in heme is a substrate, a cargo, or a protein moiety that modulates the biological activities of the protein.
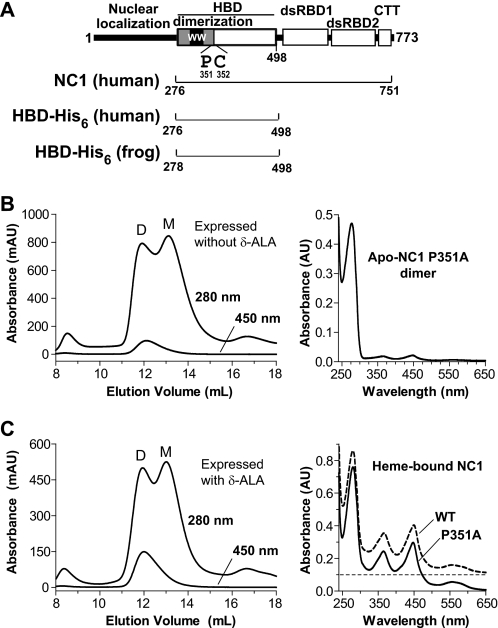
We have previously found that the RNA-binding partner protein of the Drosha nuclease in humans, called DiGeorge Critical Region 8 (DGCR8)3 (or Pasha for its insect and worm homologs), is a heme-binding protein (10). DGCR8 (11–14) and Drosha (15) are responsible for processing primary transcripts of microRNAs (pri-miRNAs) into precursor miRNAs in the first step of the miRNA maturation pathway in animals (16–18). A truncated but active form of DGCR8 named NC1, containing residues 276–751 of this 773-amino acid protein (Fig. 1A), exists as a heme-bound dimer and heme-free monomer when overexpressed in Escherichia coli (10). The heme-bound NC1 dimer is more active in reconstituted pri-miRNA processing assays than the heme-free monomer, indicating that heme is important for the function of DGCR8. Heme-binding-deficient NC1 mutants are defective in pri-miRNA processing in vitro (10, 19). DGCR8 binds heme through a heme-binding domain (HBD, amino acids 276–498) that can be expressed in a soluble, heme-bound form in the absence of other domains (Fig. 1A) (19). The HBD is not required for binding and processing pri-miRNAs in vitro and most likely serves a regulatory function (10). The N-terminal region of the HBD (amino acids 276–353) is a dimerization subdomain that includes a WW motif, which is most often involved in binding proteins with proline-containing sequences (19). The crystal structure of this domain, in the absence of heme, revealed a novel use of its WW motif for dimerization (19). Importantly, the structure showed that all the residues known to be essential for association with heme, including Cys-352 and Trp-329 (the second W in the WW motif) from both subunits, cluster on a common surface that presumably directly contacts heme.
FIGURE 1.
Characterization of the NC1 P351A mutant. A, domain structure of human DGCR8. The double-stranded RNA-binding domains (dsRBD) and C-terminal tail (CTT) are required and sufficient for cooperative association with pri-miRNAs and for triggering cleavage by the Drosha nuclease. The human NC1, HBD-His6 and frog HBD-His6 protein constructs used in this study are represented by the brackets. B, size exclusion chromatogram of NC1 P351A overexpressed in E. coli. The 367-nm absorption trace overlaps with the 450-nm one and thus is omitted from the chromatogram drawing. D and M indicate the dimer and monomer peaks. An electron absorption spectrum of the dimer peak is shown (right). C, same as B, except that 1 mm δ-ALA was added to the bacterial culture at induction.
DGCR8 appears to belong to a previously uncharacterized family of heme proteins. Heme-bound NC1 exhibits electronic absorption peaks at 450, 367, and 556 nm, with the 367-nm peak almost as intense as the strongest 450-nm peak. The Soret peak at ∼450 nm is characteristic for heme-binding proteins with a thiolate ligand contributed by a cysteine side chain (20, 21). The Soret peak of the heme-thiolate protein cytochrome P450 red-shifts to ∼450 nm when the iron in heme is reduced to the ferrous state and CO binds as the sixth ligand (22). Consistent with this precedent, mutation of a conserved Cys-352 to alanine, serine, or histidine in NC1 abolishes heme binding, implying that Cys-352 is an axial ligand of the iron in the heme (10). However, there is no obvious source of CO in the purification and storage of recombinant NC1. Furthermore, in cytochrome P450, ferrous heme ligated by a cysteine thiolate trans to CO exhibits a spectrum with the 366-nm band substantially less intense than the ∼450-nm peak. Our understanding of the DGCR8-heme interaction has been limited by a lack of in vitro heme-binding assays, as incubation of the heme-free monomer with heme does not produce the heme-bound dimer. In addition, there does not appear to be any interchange between the dimer and monomer species in vitro, regardless whether heme is present.
In this study, we used a diverse set of methods to examine the redox and ligation states of the heme in DGCR8. A mutant NC1, P351A, was shown to reversibly bind heme, forming a reconstituted complex that displays an electronic absorption spectrum similar to that of the wild-type protein. Heme dissociation and association assays revealed heretofore unknown properties of DGCR8. Most notably, DGCR8 stably binds ferric heme and exhibits the 450-nm Soret peak in the absence of CO. Spectroscopic characterization of the DGCR8 HBD reveals unique features associated with the uncommon heme coordination environment, including a narrow g anisotropy in the EPR spectrum. These results, along with SeMet substitution and mercury titration experiments, demonstrate that DGCR8 is a novel heme-binding protein with two cysteine side chains as axial ligands. Additionally, we show that DGCR8 binds heme when expressed in eukaryotic cells. The unique interaction between DGCR8 and heme provides the biochemical basis for understanding a potential mechanism for regulating miRNA maturation.
EXPERIMENTAL PROCEDURES
Reagents
Horse skeletal muscle apomyoglobin was from Sigma-Aldrich (St. Louis, MO). Hemin and δ-ALA were from MP Biomedicals (Solon, OH). l-(+)-selenomethionine was from Acros Organics (Morris Plains, NJ). Methylmercury(II) acetate (MeHgAc) was purchased as a part of a heavy atom screening kit from Hampton Research (Aliso Viejo, CA). Caution: MeHgAc is extremely toxic and should be handled with great care.
Plasmids
Site-directed mutagenesis of NC1 and human DGCR8 HBD-His6 in the pET-24a+ vector was carried out using the standard four-primer PCR method (19). The insect cell expression plasmid for His6-NC1 was generated by cloning the coding sequence for residues 276–751 of human DGCR8 into the pFastBac-HTb vector between the BamHI and EcoRI sites. The cDNA clone of the DGCR8 homolog from Xenopus laevis (frog) was obtained from Open Biosystems. The HBD coding region of the frog DGCR8 (amino acids 278–498) was amplified using PCR and was inserted into the pET-24a+ vector between the NdeI and NotI sites. The coding sequences of all plasmids were verified through sequencing.
Protein Expression and Purification
NC1 constructs were expressed and purified as described previously (10). The heme-bound proteins were expressed with 1 mm δ-ALA added at induction. The purification procedure started with two rounds of ion exchange chromatography using a SP-Sepharose HP column, and the monomer and dimer species were separated using size exclusion chromatography (SEC) and a Superdex 200 10/300 GL column (GE Healthcare).
The frog DGCR8 HBD-His6 was expressed in E. coli strain BL21(DE3) CodonPlus (Strategene) and purified using Ni-affinity chromatography followed by SEC, as reported previously for human HBD-His6 (19). The purified protein was exchanged into desired buffers for spectroscopic studies, as indicated in the figure legends, using centrifugal concentrators with a molecular mass cut-off of 30 kDa. SeMet-labeled frog DGCR8 HBD-His6 was expressed using the same vector, host strain, and procedure as described by Van Duyne et al. (23). Briefly, E. coli were cultured in M9 minimal medium containing no methionine. Six other amino acids known to inhibit methionine biosynthesis were added to the culture 15 min prior to induction. In addition, 40 μm FeCl3 and 1 mm δ-ALA were added to the medium at induction to increase the synthesis of heme and the yield of the HBD-heme complex. SeMet-labeled HBD-His6 was expressed at 25 °C overnight (∼16 h) and purified using the same procedure as that for the unlabeled protein.
The human DGCR8 HBD-His6 C430S mutant protein (hHBDC430S, used in a mercury titration experiment) was expressed and purified using the same procedure as described for the wild-type protein (19), except that the SEC was performed in the absence of reducing reagents. Prior to the mercury titration experiments, the purified HBD mutant was concentrated and exchanged into a buffer containing 50 mm EPPS (pH 8.0) and 400 mm NaCl, using a centrifugal concentrator with a molecular mass cut-off of 30 kDa. The extinction coefficient of the heme-bound hHBDC430S protein (ϵ280 nm = 31 mm−1 cm−1) was determined experimentally by measuring its absorption at 280 nm and its protein concentration using the Micro BCA protein assay kit (Pierce).
The His6-NC1 protein was expressed in Sf9 cells following the instructions in the Bac-to-Bac system (Invitrogen). His6-NC1 was purified using Ni-affinity chromatography followed by cation exchange chromatography using a SP column (GE Healthcare). The purified protein fractions were pooled, concentrated, and exchanged in a storage buffer containing 20 mm Tris (pH 8.0), 400 mm NaCl, and 1 mm DTT using an Ultra-4 concentrator with a 30-kDa molecular mass cut-off. Sf9 cell-expressed His6-NC1 was analyzed using a Superdex 200 10/300 GL column, and the absorption at 260, 280, and 450 nm was monitored (Fig. 9B). The size exclusion chromatogram was baseline-adjusted using the Unicorn software (version 5.0, GE Healthcare). The ratio of the absorption by heme and by protein (the RZ value) was used to calculate the percentage of His6-NC1 occupied by heme using the extinction coefficients (ϵ) 58 mm−1 cm−1 for heme (450 nm) and 53 mm−1 cm−1 for each His6-NC1 subunit (280 nm). The ϵ450 nm of insect cell-expressed His6-NC1 was assumed to be the same as that of the untagged NC1 expressed in E. coli (10). The ϵ280 nm was calculated from the His6-NC1 sequence using the program ProtParam on the ExPASy proteomics server provided by the Swiss Institute of Bioinformatics (24).
FIGURE 9.
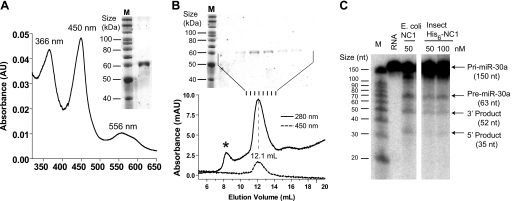
DGCR8 binds heme in insect cells. A, electronic absorption spectrum of His6-NC1 (human) expressed in Sf9 cells using baculovirus. His6-NC1 was purified using Ni affinity chromatography followed by cation exchange chromatography. The image of a silver-stained SDS-polyacrylamide gel is shown. B, analytical size exclusion chromatogram of the His6-NC1 sample used in A, with the silver-stained gel of the SEC fractions shown above. The peak indicated by the asterisk contains mainly nucleic acids. C, His6-NC1 expressed in insect cells was used in reconstituted pri-miRNA processing assays. A pri-miR-30a fragment was uniformly labeled with α-32P-UTP and was incubated with recombinant Drosha and NC1 at indicated concentrations. The reactions were analyzed using denaturing gel electrophoresis and autoradiography.
Heme Dissociation and Association Assays
Hemin chloride was dissolved in 1.4 m NaOH at 100 mm concentration and incubated at room temperature for >30 min. This concentrated solution was then diluted in water to give a 100 μm stock solution. All reactions were carried out in 20 mm Tris buffer (pH 8.0), 400 mm NaCl, and 1 mm DTT, unless otherwise specified.
Electronic Absorption Spectroscopy
The spectra were recorded at 25 °C using either a DU800 spectrophotometer (Beckman-Coulter, bandwidth ≤ 1.8 nm) in sealed cuvettes (Figs. 1–4, 8, 9), a DU500 spectrophotometer (Beckman-Coulter, bandwidth < 4.5 nm) (Fig. 3D), or a double-beam Varian Cary 4 Bio spectrophotometer (Agilent Technologies) with its spectral bandwidth set to 0.5 nm (Figs. 5 and 7B).
FIGURE 2.
Heme dissociates from the wild-type NC1 slowly, and P351A increases the rate. Heme-bound NC1, either P351A (A and B) or wild-type (C), was incubated with a 6-fold excess of apomyoglobin at 25 °C. A, electronic absorption spectra obtained at 0, 5, 10, 15, 20, 30, 40, 50, 60, 70, 80, and 90 min. B, the 414-nm (metmyoglobin) and 447-nm (P351A-heme complex) values shown in A were fit to a single exponential function. The rates shown are mean ± S.D. of three independent repeats. C, wild-type NC1 showed no significant changes of absorbance at 414 nm and 450 nm at room temperature over 4 days.
FIGURE 3.
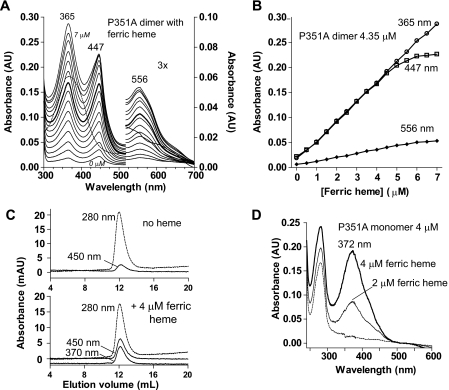
The P351A-heme complex can be reconstituted using ferric heme. A, electronic absorption spectra of titration of ferric heme to heme-free P351A dimer (4.35 μm) in 0.5 μm intervals. The spectrum of ferric heme (5.0 μm) free from proteins is shown using a dashed line. B, the absorbance values at peak wavelengths are plotted over the concentration of ferric heme added. C, SEC of 4 μm heme-free P351A dimer incubated without (top panel) or with (bottom panel) equal molar of ferric heme. D, the P351A monomer shows neither 447- nor 556-nm peaks when incubated with ferric heme.
FIGURE 4.
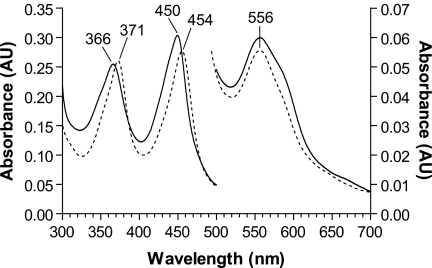
The hyperporphyrin spectrum of DGCR8 likely results from double-cysteine ligation to ferric heme. The electronic absorption spectrum of ferric heme-bound NC1 dimer (solid line) is strikingly similar to that of the ferric chloroperoxidase complexed with ethyl-2-mercaptoacetate (dashed line). The latter spectrum was reproduced from an earlier work (31).
FIGURE 8.
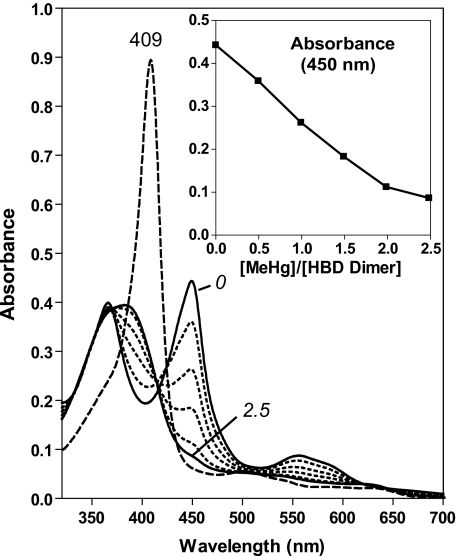
Cys-352 from both subunits in a DGCR8 dimer serve as the axial ligands to ferric heme. Electronic absorption spectra of hHBDC430S (10 μm) titrated with MeHgAc. The MeHgAc was added at steps of 0.5 molar equivalent of ferric heme-bound HBD dimer. The spectra of the starting point (0 molar equivalent of MeHgAc) and end point (2.5 molar equivalents) are shown in solid traces and the intermediate steps in dotted lines. After the MeHgAc titration, 1.2 molar equivalents of apomyoglobin (relative to the HBD dimer) were added, and the electronic absorption spectrum was immediately recorded (dashed line). The inset shows absorbance at 450 nm over the course of the titration.
FIGURE 5.
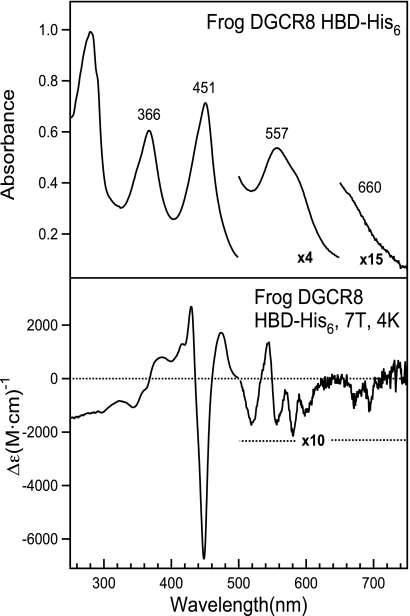
Electronic absorption and MCD spectra of the ferric heme-bound frog DGCR8 HBD-His6. The electronic absorption spectrum (top panel) was taken at room temperature using the dimeric frog HBD-His6 at 12.2 μm concentration in a buffer containing 50 mm EPPS (pH 8.0) and 400 mm NaCl. As a control, an electronic absorption spectrum was also recorded at 4 K and displayed no differences in peak positions and intensity (data not shown). The MCD spectrum (bottom panel) was recorded using a protein sample at 24.5 μm in 22.5 mm EPPS (pH 8.0), 180 mm NaCl, and 55% (v/v) glycerol.
FIGURE 7.
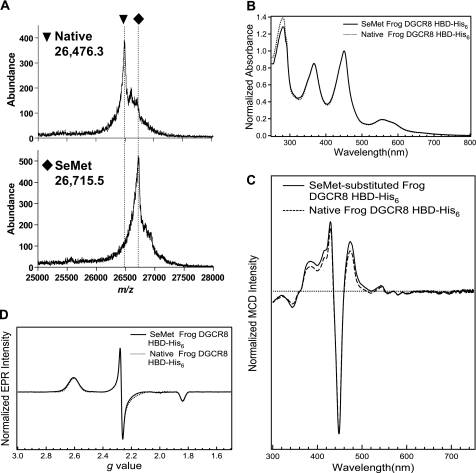
The sixth ligand to ferric heme in DGCR8 is not a methionine. A, mass spectra of native and SeMet-labeled frog DGCR8 HBD-His6 indicates nearly complete substitution of Met by SeMet. The difference in their m/z peaks, 239, is consistent with all five methionine residues substituted with SeMet. B, the normalized electronic absorption spectrum of the SeMet-substituted frog HBD-His6 is nearly identical to that of the native protein (Fig. 5, top panel). C, the normalized MCD spectrum of the SeMet-substituted frog HBD-His6 is nearly identical to that of the native protein (Fig. 5, bottom panel). D, comparison of the EPR spectra of the native and SeMet-labeled frog HBD-His6. The spectral parameters for the SeMet-labeled frog HBD-His6 were the same as those of the native listed in Fig. 6, except that the ferric heme concentration of the sample was 142 μm and the spectrum was acquired with a 9.384 GHz microwave frequency.
MCD Spectroscopy
MCD spectra were recorded on a Jasco J-715 circular dichroism spectropolarimeter with the sample compartment modified to accommodate an SM-4000–8T magnetocryostat (Oxford Instruments). The buffer used for the MCD samples was 50 mm EPPS and 400 mm NaCl (pH 8.0) with ∼55% (v/v) glycerol present in the final sample. Glycerol was introduced to the protein and stirred with a syringe until the solution was homogenous. Glycerol had no effect on the electronic absorption spectra at room or liquid-helium temperatures. Samples were transferred via gas-tight syringes into cells, flash-frozen, and stored in liquid N2. MCD spectra were taken over a temperature range from 4 to 50 K. The MCD signal at each temperature was recorded at ±7 T. Negative polarity data were subtracted from positive polarity data to remove circular dichroism contributions, and the resulting spectrum was divided by 2. Magnetic saturation curves were generated from data taken at 448 nm, and data were normalized to the most intense MCD data point (7 T, 2.5 K).
EPR Spectroscopy
X-band electron paramagnetic resonance spectra were collected on a Bruker ELEXSYS E500 equipped with an Oxford ESR 900 continuous flow liquid helium cryostat and an Oxford ITC4 temperature controller maintained at 10 K. The microwave frequency was monitored using an EIP model 625A CW microwave frequency counter. Protein samples were prepared as indicated in the figure legends. Samples were transferred to a quartz EPR tube via small-bore tubing connected to a gas-tight syringe and were frozen in liquid N2. Samples of 150 μl had a final concentration of ∼150 μm heme. For all samples, scans of 0–10,000 G revealed no signals other than those reported.
MALDI-TOF Mass Spectrometry
Native and SeMet-labeled frog DGCR8 HBD-His6 were dissolved in a 1:9 (v/v) ratio with a mixture containing 70% (v/v) acetonitrile, 0.1% (v/v) trifluoroacetic acid, and saturating concentration of sinapinic acid (Fluka). The samples were analyzed using a Voyager-DE STR MALDI-TOF mass spectrometer (Applied Biosystems) operated in a linear mode with positive polarity. The mass accuracy in this mode is ≤ ± 0.05% for myoglobin (16,952 Da). The m/z range from 10,000 to 70,000 was monitored.
Mercury Titration of Cysteines in Human HBD
A stock solution of MeHgAc was prepared at a 0.5 mm concentration in 50 mm EPPS (pH 8.0) and 400 mm NaCl. (Caution: MeHgAc is volatile and extremely toxic. The stock solution was prepared in a fume hood.) The MeHgAc stock was added to 200 μl of 10-μm hHBDC430S dimer solution in 2-μl increments. The solution was incubated at 25 °C for 10 min before the electronic absorption spectra were recorded. After the mercury titration, 30 μl of apomyoglobin stock solution (80 μm) was added, and the electronic absorption spectrum was recorded.
Reconstituted pri-miRNA Processing Assays
The procedure was described previously (10). Briefly, the 150-nucleotide pri-miR-30a was uniformly labeled with 32P and was incubated with recombinant Drosha and His6-NC1 at 37 °C for 45 min. The reactions were analyzed using denaturing 15% polyacrylamide gels and autoradiography.
RESULTS
The DGCR8 P351A Mutant Can Be Expressed as Heme-bound and Heme-free Dimers
Pro-351 is located close to the proposed heme-binding surface of DGCR8 in three-dimensional space (19). We mutated Pro-351 to alanine in the context of NC1 (P351A) and examined the ability of this mutant to bind heme by expressing it in E. coli with and without the addition of δ-ALA, a heme biosynthesis intermediate. In both cases, P351A was present in dimeric and monomeric forms, as indicated by SEC (Fig. 1, B and C). When overexpressed without δ-ALA, P351A was nearly completely free of heme (Fig. 1B). When δ-ALA was added to the bacterial culture at the time of induction, the heme occupancy of the P351A dimer was increased to nearly the level of the wild type under the same conditions; however, the P351A monomer remained free of heme (Fig. 1C). The heme-bound P351A dimer, purified using SEC, exhibited an electronic absorption spectrum with peaks at 365, 447, and 556 nm, similar to those of the wild-type NC1 protein (Fig. 1C). The P351A mutation caused a 3-nm blue shift of the 450-nm Soret peak, indicating some alteration in the local structure of the NC1 protein. In the presence of δ-ALA, the wild-type NC1 is expressed nearly exclusively as a heme-bound dimer (10), suggesting that the P351A mutation may reduce the affinity of DGCR8 for heme. Overall, these results suggest that the complex of P351A with heme retains a structure similar to that of the wild type.
Heme Dissociates from Wild-type DGCR8 Extremely Slowly, and the P351A Mutation Increases the Dissociation Rate
To determine the stability of the DGCR8-heme complex, we performed a heme dissociation assay by incubating heme-bound NC1 with 5-fold molar excess of horse apomyoglobin. Apomyoglobin has an extremely high affinity for heme, with KD of ∼3 × 10⁻¹⁵ m (25). Thus, heme molecules dissociated from NC1 were quickly bound to apomyoglobin, and this transfer was accompanied by a shift of the Soret peak from ∼450 to 414 nm (Fig. 2A). At room temperature, heme dissociated from the P351A dimer within 1–2 h (Fig. 2A). When the absorbance at 447 nm was plotted over time, the data fit nicely to a one-phase exponential decay function, giving an estimated dissociation rate constant (koff) of 5.0 ± 0.1 × 10⁻⁴ s−1. The increase in absorbance at 414 nm over time gave a similar value (5.8 ± 0.4 × 10⁻⁴ s−1). In contrast, incubation of wild-type heme-bound NC1 with apomyoglobin did not result in any shift of the Soret peak even after 4 days (Fig. 2C). This observation suggests either extremely slow dissociation of heme from the wild-type NC1 (with t1/2 ≫ 4 days or koff ≪ 3 × 10⁻⁶ s−1) or a higher affinity of wild-type NC1 for heme than that of apomyoglobin. By comparison, the koff for sperm whale myoglobin is 8.4 × 10⁻⁷ s−1, that for human hemoglobin is 7.1 × 10⁻⁶ s−1 (26, 27), and the koff for the single-cysteine-ligated heme-sensor proteins such as heme-regulated inhibitor and neuronal PAS protein 2 (NPAS2) are typically 1–6 × 10⁻³ s−1 (21). The heme-sensor proteins are a group of heme-binding proteins in which the activity is regulated either directly by heme or by signaling gas molecules such as NO and CO. The slow dissociation of heme from NC1 argues against a model in which activity of DGCR8 is reversibly regulated by its association with heme. Furthermore, the P351A mutation increases the dissociation rate of the heme from NC1, possibly by altering the conformation of the loop containing Cys-352.
The P351A-Heme Complex Can Be Reconstituted Using Ferric Heme
It has not been possible to reconstitute the DGCR8-heme complex by incubating heme with the NC1 monomer, the only heme-free form of the wild-type protein currently available. We wondered whether the heme-free P351A dimer would bind heme in vitro. We titrated ferric heme into the heme-free P351A dimer and found that they readily formed a specific complex. The P351A-heme complex displayed absorption peaks at 365, 447, and 556 nm (Fig. 3A), nearly identical in positions and relative intensities to those of the heme-bound P351A dimer purified from E. coli. As the total ferric heme concentration increased, the 447-nm and 556-nm absorption plateaued after ∼4.5 μm (Fig. 3, A and B), close to the P351A dimer concentration of 4.35 μm. This result suggests that each P351A dimer binds one ferric heme molecule. The same protein-heme stoichiometry was previously observed for the wild-type NC1 dimer when it was characterized using HPLC and mass spectrometry (10). In contrast, the absorbance at 365 nm continued to increase linearly after the specific heme-binding site of P351A had been saturated (Fig. 3B). Both specific and nonspecific NC1-heme interactions appear to contribute to the 365-nm peak (see below). The reconstituted P351A dimer-ferric heme complex was analyzed using SEC. The absorbances at 280, 370 and 450 nm coeluted in a peak with an elution volume similar to those of the heme-bound and heme-free P351A dimers, indicating that the complex was stable and remained as a dimer (Fig. 3C). In contrast to the dimer, the heme-free P351A monomer is incapable of binding ferric heme. Incubation of the heme-free P351A monomer with ferric heme yielded an absorption peak at 372 nm and no Soret peak at ∼450 nm (Fig. 3D), indicative of nonspecific heme binding. SEC of the heme-free P351A monomer incubated with ferric heme showed that the protein did not coelute with heme (supplemental Fig. S1). Thus, the heme-free P351A monomer cannot bind heme and convert to the heme-bound dimer under the conditions tested. These results confirm the previous finding that dimerization of DGCR8 is required for association with heme (10). Importantly, the in vitro heme-binding assays of the P351A dimer were performed in the absence of CO (Fig. 3A). The fact that DGCR8 binds ferric heme without CO to give a Soret peak at ∼450 nm clearly demonstrates that it must bind heme through a set of interactions distinct from those in ferrous cytochrome P450 bound by CO.
The Hyperporphyrin Spectrum of DGCR8 Matches Those of Ferric Heme with Two Thiolate Ligands
How does DGCR8 interact with ferric heme to generate the 450-nm absorption peak? The similarly intense absorption peaks at ∼450 nm and ∼366 nm in the DGCR8-heme complexes constitute a hyperporphyrin (split Soret) spectrum. Early studies showed that having a ferrous heme ligated with a cysteine (thiolate) and CO is not the only way to obtain a hyperporphyrin spectrum. Ferric heme in complex with two mercaptide ligands, used as model compounds for hemoproteins, can produce a hyperporphyrin spectrum with the split Soret bands of approximately equal intensity (28). Similarly, ligation of an exogenous thiolate or phosphine compound to ferric heme-thiolate proteins, such as cytochrome P450CAM and chloroperoxidase, also generates hyperporphyrin spectra with two equally intense Soret bands (supplemental Table S1) (29–31). The electronic absorption spectrum of the NC1-heme complex bears a striking similarity to that of chloroperoxidase with an exogenous thiolate ligand (Fig. 4). Additionally, these studies on cytochrome P450CAM and chloroperoxidase showed a broad α/β band with its maximum at ∼560 nm, similar to the 556-nm peak in the electronic absorption spectrum of the NC1-heme complex (29–31). The match of these electronic absorption spectroscopic signatures suggests that DGCR8 likely binds ferric heme using a cysteine thiolate as the fifth ligand and a sixth ligand that could be either a thiolate or a phosphine. Unlike cytochrome P450 and chloroperoxidase, DGCR8 (both NC1 and HBD-His6) can be purified and stored in the absence of any exogenous thiolate- or phosphine-containing compounds and still maintain its hyperporphyrin spectrum, suggesting that DGCR8 mostly likely uses two endogenous ligands. These ligands could be the side chain of a cysteine (thiolate or thiol) or a methionine (an electron donor similar to the phosphine).
MCD and EPR Spectra Reveal Spin, Oxidation, and Coordination States of the Heme in DGCR8
We performed MCD and EPR spectroscopies to further interrogate the chemical environment of the heme in DGCR8. Because these techniques require large amounts of protein, we chose to use the C-terminal His6-tagged heme-binding domain (HBD-His6) from frog DGCR8 (Fig. 1A), which can be expressed and purified with a yield of ∼1 mg per liter of bacterial culture. The HBD sequences of human and frog DGCR8 are 80% identical. The electronic absorption spectrum of the frog DGCR8 HBD-His6 (Fig. 5, upper panel) is nearly identical to those of the human DGCR8 NC1 and HBD-His6 (19) proteins, indicating a close similarity between the chemical environments of their heme cofactors.
The MCD spectrum of the frog DGCR8 HBD-His6 protein, recorded at 4 K, is dominated by two features with peak-crossover-trough positions of 344-368-388 nm and 430-435-448 nm, respectively (Fig. 5, lower panel). These features correspond to the blue-shifted and red-shifted split Soret bands in the absorption spectrum. Weaker features are observed in the MCD spectrum between 500 and 750 nm that correspond to the α/β (557 nm) and ligand-to-metal charge-transfer transition (660 nm) peaks in the absorption spectrum. The MCD spectrum of the frog HBD-His6 bears the greatest resemblance to MCD spectra of ferric chloroperoxidase and ferric P450CAM to which either methanethiol or bis(hydroxymethyl)methylphosphine has been added (5, 31, 32), further supporting the model in which the heme iron in DGCR8 is six-coordinate with one cysteine thiolate ligand, and a sixth ligand that may be either another cysteine (equivalent to the methanethiol) or a methionine (similar to the phosphine). To probe the electronic state of the metal iron, MCD spectra of the frog HBD-His6 were recorded over a range of temperatures (4–50 K). Notably, all of the MCD signals are temperature-dependent, indicating that they originate from a paramagnetic metal. MCD signals at the most intense feature (448 nm) were monitored over a range of magnetic field intensities at several temperatures (2.5–25 K). The resulting magnetic saturation curves at the different temperatures overlap each other (supplemental Fig. S2), indicating that the spin state of the iron is S = ½. This result implies that the heme in DGCR8 contains low-spin Fe(III), with only one unpaired electron.
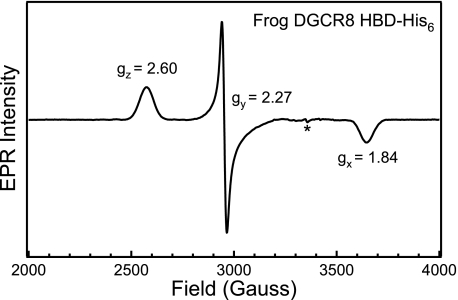
The EPR spectrum of frog DGCR8 HBD-His6 further supports the conclusion that the heme iron is low-spin Fe(III). When the spectrum was scanned from 0–10,000 G, the only signal observed was a narrow rhombic signal centered at ∼2900 G (data not shown). A narrow scan (2000–4000 G) around this rhombic signal gave the three g values: gz = 2.60, gy = 2.27, and gx = 1.84 (Fig. 6). The presence of a single rhombic signal in the g = 2 region reveals that the iron in DGCR8 is clearly low spin Fe(III). Analysis of the calculated crystal field parameters of tetragonality (Δ/λ, degree of electronic donation at the iron center) and rhombicity (V/Δ, degree of geometric distortion of the iron center) places the frog Fe(III) HBD-His6 in the same region as native ferric chloroperoxidase in the Blumberg-Peisach “truth” diagrams (33), in closest proximity to Fe(III) chloroperoxidase thiol adducts such as thioacetic acid and β-mercaptoethanol and the Fe(III) chloroperoxidase bis(hydroxymethyl)methyl phosphine adduct (32, 34) (supplemental Table S2 and Fig. S3). Although a number of thiol adducts of ferric chloroperoxidase and ferric P450CAM display multiple overlapping, rhombic EPR signals, the frog Fe(III) HBD-His6 only displays a single rhombic signal, suggesting a well defined, homogenous environment about the DGCR8 heme.
FIGURE 6.
EPR spectrum of the ferric heme-bound frog DGCR8 HBD-His6 protein. The frog HBD-His6 protein (153 μm) was in 50 mm EPPS (pH 8.0) and 400 mm NaCl. The spectrum represents an average of 10 scans taken at 10 K, with 9.383 GHz microwave frequency, 8.000 G modulation amplitude, 100 kHz modulation frequency, 60 dB receiver gain, 163.84 ms time constant, and a power of 1.002 milliwatt. The asterisk represents a signal present in the cavity.
The Sixth Axial Ligand of Heme in DGCR8 Is Not a Methionine
Because both thiols and phosphines ligated to ferric chloroperoxidase and P450 generate hyperporphyrin spectra (5, 32), we considered the possibility that one of the ligands coordinated to the heme in DGCR8 is the thioether of a methionine side chain. We examined the spectroscopic properties of the frog HBD-His6 labeled with SeMet, with the expectation that if methionine were a ligand to the heme iron, its substitution with the selenium analog would be evident in the heme spectra. A MALDI-TOF mass spectrum of the SeMet-labeled HBD-His6 showed a single major peak with a m/z value greater than that of the unlabeled protein by 239, within experimental error (≤ ± 13) of the expected increase of 234 when all five methionine residues in the frog HBD-His6 sequence are substituted with SeMet (Fig. 7A). This result indicated that nearly complete substitution of methionine with SeMet was achieved. Importantly, the electronic absorption spectrum of SeMet-labeled frog HBD-His6 shows no changes in peak positions relative to the native construct (Fig. 7B). In contrast, previous studies showed that substitution of a methionine ligand with SeMet caused the Soret α and β peaks to red-shift on the range of 3–7 nm (35, 36). The signals in the MCD and EPR spectra of SeMet-labeled HBD-His6 were also unchanged from those of the native Met-containing protein (Fig. 7, C and D). The large difference in spin-orbit coupling between Se and S is expected to give rise to significantly different spectral features; that the MCD and EPR spectra of the two proteins are the same argues that methionine is not the sixth ligand to the heme in DGCR8. Thus, DGCR8 must use two endogenous cysteine residues to ligate heme.
Cys-352 from both Subunits in a DGCR8 Dimer Serve as the Axial Ligand of Heme
Which cysteine residues does DGCR8 use for ligating heme? There are seven cysteine residues in the NC1 (human) sequence; however, only two of them, Cys-352 and Cys-430, are located in the HBD region. Available data suggest that the HBD binds heme in the same way as NC1 (19) and that Cys-430 is not required for association with heme (10). Thus, Cys-352 is the only cysteine residue in human DGCR8 that can serve as a ligand for heme. Furthermore, heme binds to dimeric DGCR8, suggesting a model in which the two Cys-352 from both subunits serve as the axial ligands of heme.
We directly tested this model using a mercury titration strategy. Mercury compounds bind thiol groups with high affinities and thus can disrupt the interaction between cysteine ligands and the heme cofactor. To simplify the interpretation, we first mutated Cys-430 to serine in the context of human DGCR8 HBD-His6 (hHBDC430S) so that Cys-352 was the only cysteine present in the sequence. Not surprisingly, the mutant exhibited an electronic absorption spectrum with peak positions and relative intensities indistinguishable from those of the wild-type protein (Fig. 8). This result confirms experimentally that Cys-352 is the only cysteine residue that can ligate heme. Titration of the hHBDC430S dimer with MeHgAc led to a linear decrease of the peaks at 366, 450, and 556 nm until 2.0 molar equivalents (relative to hHBDC430S dimer) was reached. The peaks disappeared completely after addition of 2.5 molar equivalents of MeHgAc (Fig. 8). Concomitantly, there appeared a broad electronic absorption peak centered at 385 nm resembling that of free ferric heme (Fig. 8), suggesting that the heme was released from hHBDC430S after both Cys-352 ligands dissociated from the heme iron. Consistent with this interpretation, when 1.2 molar equivalents of apomyoglobin were added to the mercury-treated hHBDC430S dimer, the Soret peak shifted to 409 nm, characteristic of ferric myoglobin (metmyoglobin). Because each methylmercury generally binds one cysteine in a protein, these results indicate that both Cys-352 residues in the hHBDC430S dimer are important for association with heme.
Heme Binds to DGCR8 Expressed in Eukaryotic Cells
We have studied the DGCR8-heme interaction using overexpression in E. coli or biochemical reconstitution; however, the question remains: does this family of proteins, found only in animals, bind heme in eukaryotic cells? Because overexpression of DGCR8 in mammalian cells is subjected to multiple levels of regulation (37) and appears to be cytotoxic, we addressed this question by expressing NC1 with a N-terminal His6 tag (His6-NC1) in Sf9 insect cells (Fig. 9). The purified His6-NC1 protein, which appeared largely as a single band, displayed absorption peaks at 366, 450, and 556 nm (Fig. 9A), identical to those of the NC1-ferric heme complex expressed in bacteria. This His6-NC1 protein sample was further analyzed using SEC (Fig. 9B). The chromatogram showed that the insect cell-expressed His6-NC1 eluted at a volume expected for the NC1 dimer, and no monomer peak was visible, suggesting that the His6-NC1 existed nearly exclusively as a dimer. SEC also allowed the small amounts of protein and nucleic acid impurities to be removed from His6-NC1. Based on the absorbance ratio A450/A280, the heme occupancy of the insect cell-expressed His6-NC1 was estimated to be ∼50%. We tested the His6-NC1 using reconstituted pri-miRNA processing assays. This assay revealed that the activity of the Sf9-expressed His6-NC1 was comparable with that of the heme-bound NC1 dimer expressed in bacteria (Fig. 9C). Given these data, we conclude that active DGCR8 proteins expressed in eukaryotic cells can bind heme.
DISCUSSION
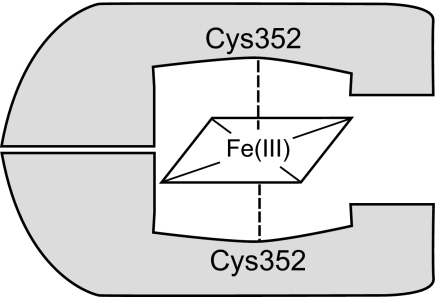
Here we present biochemical and spectroscopic characteristics of the DGCR8-heme complex, revealing interactions distinct from those of other known cysteine-ligated hemoproteins. The DGCR8-heme complex displays an absorption spectrum with an intense peak near 450 nm in the absence of CO. Our data reveal that the heme iron is in the ferric state and that DGCR8 ligates to the heme iron using two endogenous cysteine side chains (Fig. 10).
FIGURE 10.
Schematic of how the DGCR8 HBD binds ferric heme.
Our recent crystal structure of the N-terminal dimerization subdomain of the human DGCR8 HBD revealed a symmetric dimer with an extensive dimerization interface mediated mostly by hydrophobic interactions (19). Although our structure does not contain heme, it shows that the two Cys-352 residues in the dimer are within van der Waals contacting distance of each other. A conformational change of the loop containing Cys-352 likely occurs upon association of the protein with heme and should be able to position the two Cys-352 side chains on opposite sides of the heme plane for axial ligation. Here we show that the DGCR8-heme complexes are remarkably stable (Fig. 2C). Proper positioning of the two Cys-352 side chains within a robust dimer likely contributes to this stability.
This study establishes DGCR8 as the first example of a heme protein with two endogenous cysteines, Cys-352 from both subunits, as axial ligands. Our investigation revealed that Pro-351 is important for the stability of the DGCR8-heme complex. Pro-351 and Cys-352 together are similar to the heme regulatory motif, which contains a Cys-Pro sequence but in the opposite order. Heme regulatory motifs directly bind heme and are found in repeats in a range of heme-regulated proteins, such as the yeast transcription activator HAP1 and the human δ-aminolevulinic acid synthase, heme oxygenase-2, heme-regulated eukaryotic initiation factor 2α kinase, and Rev-erbβ (38–42). It is possible that in both motifs the proline helps to position the cysteine side chain in an appropriate geometry for ligation and for either catalytic or regulatory functions. However, unlike the heme regulatory motifs, the Pro-351 and Cys-352 residues are not sufficient for DGCR8 to associate with heme, because dimerization and Trp-329 in the WW motif are also required for heme binding.
Our previous (10) and current studies clearly demonstrated that dimerization is required for association with heme. The heme-free forms of NC1 expressed in E. coli are either mostly monomeric (for the wild type and the C351A mutant) (10) or a mixture of monomers and dimers (for P351A, this study). We have never observed monomeric NC1 to bind heme and dimerize in vitro, regardless of whether it is the wild type or the P351A mutant, (Fig. 3D and data not shown). Furthermore, it appears that the monomeric species of NC1 is only generated in E. coli and not in insect cells (Fig. 9B). A careful inspection of the SDS-12% polyacrylamide gels of the bacteria-expressed NC1 revealed that the monomer contained low-molecular-weight protein species comigrating with the dye bromphenol blue (supplemental Fig. S4, A and B). On a SDS-15% polyacrylamide gel, these protein species appeared as an approximately 10-kDa band with a smear underneath (supplemental Fig. S4C), indicating that they are heterogeneous. Furthermore, our crystal structure of the N-terminal sub-domain of human DGCR8 HBD shows an extensive dimerization interface that does not appear to be easily disrupted in non-denaturing conditions. Thus, the “monomeric” NC1 may partially, if not entirely, consist of heterodimers in which one subunit has been non-specifically cleaved in the central loop region (19) of its HBD, in the E. coli cells or during purification, into a fragment that retains the dimerization domain. It is possible that in human cells both heme-free and heme-bound DGCR8 are dimers.
The current study reveals important features of the DGCR8-heme interaction that will help us to understand its potential physiological function in regulating miRNA maturation. We have two working models. In the first model, the DGCR8-heme complex may serve as a sensor for cellular or environmental signals (the heme-based sensor model) (43). In a heme-based sensor, heme is stably bound to a protein partner, which is consistent with the slow dissociation of heme from NC1 observed here (Fig. 2C). In the second, heme itself may serve as the ligand to activate miRNA processing (the heme sensing model) (21). The slow dissociation of heme from NC1 argues against a heme sensing model in which heme reversibly binds to DGCR8 and regulates its activity. However, it is still possible that heme may bind and activate DGCR8 while the signal is turned off through protein degradation.
Supplementary Material
Acknowledgments
We thank J. Feigon and T. C. Brunold for generously sharing UV/visible and MCD spectrophotometers, J. Loo for access to equipment in the University of California at Los Angeles Mass Spectrometry and Proteomics Technology Center, J. Dawson, S. Merchant and A. Smith for discussion, and J.P. Jacob and V. Kickhoefer for technical assistance.
This project is supported, in whole or in part, by National Institutes of Health Grants GM080563 (to F. G.) and HL065217 (to J. N. B.).

The on-line version of this article (available at http://www.jbc.org) contains supplemental Figs. S1–S4, Tables S1 and S2, and references.
- DGCR8
- DiGeorge Critical Region 8
- miRNA
- microRNA
- pri-miRNA
- primary transcripts of microRNA
- HBD
- heme-binding domain
- δ-ALA
- δ-aminolevulinic acid
- SEC
- size exclusion chromatography
- hHBDC430S
- human DGCR8 HBD-His6 C430S mutant protein
- EPPS
- 4-(2-hydroxyethyl)-1-piperazinepropanesulfonic acid
- ϵ
- extinction coefficient
- MCD
- magnetic circular dichroism
- MeHgAc
- methylmercury acetate
- SeMet
- selenomethionine.
REFERENCES
- 1. Perutz M. F., Wilkinson A. J., Paoli M., Dodson G. G. (1998) Annu. Rev. Biophys. Biomol. Struct. 27, 1–34 [DOI] [PubMed] [Google Scholar]
- 2. Derbyshire E. R., Marletta M. A. (2009) Handb. Exp. Pharmacol. 191, 17–31 [DOI] [PubMed] [Google Scholar]
- 3. Ortiz de Montellano P. R. (2000) Curr. Opin. Chem. Biol. 4, 221–227 [DOI] [PubMed] [Google Scholar]
- 4. Ortiz de Montellano P. R. (2004) Cytochrome P450: Structure, Mechanism, and Biochemistry, 3rd Ed., Springer, New York [Google Scholar]
- 5. Dawson J. H., Sono M. (1987) Chem. Rev. 87, 1255–1276 [Google Scholar]
- 6. Rousseau D. L., Li D., Couture M., Yeh S. R. (2005) J. Inorg. Biochem. 99, 306–323 [DOI] [PubMed] [Google Scholar]
- 7. Udit A. K., Gray H. B. (2005) Biochem. Biophys. Res. Commun. 338, 470–476 [DOI] [PubMed] [Google Scholar]
- 8. Dawson J. H. (1988) Science 240, 433–439 [DOI] [PubMed] [Google Scholar]
- 9. Paoli M., Marles-Wright J., Smith A. (2002) DNA Cell. Biol. 21, 271–280 [DOI] [PubMed] [Google Scholar]
- 10. Faller M., Matsunaga M., Yin S., Loo J. A., Guo F. (2007) Nat. Struct. Mol. Biol. 14, 23–29 [DOI] [PubMed] [Google Scholar]
- 11. Denli A. M., Tops B. B., Plasterk R. H., Ketting R. F., Hannon G. J. (2004) Nature 432, 231–235 [DOI] [PubMed] [Google Scholar]
- 12. Gregory R. I., Yan K. P., Amuthan G., Chendrimada T., Doratotaj B., Cooch N., Shiekhattar R. (2004) Nature 432, 235–240 [DOI] [PubMed] [Google Scholar]
- 13. Han J., Lee Y., Yeom K. H., Kim Y. K., Jin H., Kim V. N. (2004) Genes Dev. 18, 3016–3027 [DOI] [PMC free article] [PubMed] [Google Scholar]
- 14. Landthaler M., Yalcin A., Tuschl T. (2004) Curr. Biol. 14, 2162–2167 [DOI] [PubMed] [Google Scholar]
- 15. Lee Y., Ahn C., Han J., Choi H., Kim J., Yim J., Lee J., Provost P., Rådmark O., Kim S., Kim V. N. (2003) Nature 425, 415–419 [DOI] [PubMed] [Google Scholar]
- 16. Kim V. N., Han J., Siomi M. C. (2009) Nat. Rev. Mol. Cell Biol. 10, 126–139 [DOI] [PubMed] [Google Scholar]
- 17. Faller M., Guo F. (2008) Biochim. Biophys. Acta 1779, 663–667 [DOI] [PMC free article] [PubMed] [Google Scholar]
- 18. Faller M., Toso D., Matsunaga M., Atanasov I., Senturia R., Chen Y., Zhou Z. H., Guo F. (2010) RNA 16, 1570–1583 [DOI] [PMC free article] [PubMed] [Google Scholar]
- 19. Senturia R., Faller M., Yin S., Loo J. A., Cascio D., Sawaya M. R., Hwang D., Clubb R. T., Guo F. (2010) Protein Sci. 19, 1354–1365 [DOI] [PMC free article] [PubMed] [Google Scholar]
- 20. Omura T. (2005) Biochem. Biophys. Res. Commun. 338, 404–409 [DOI] [PubMed] [Google Scholar]
- 21. Igarashi J., Kitanishi K., Martinkova M., Murase M., Iizuka A., Shimizu T. (2008) Acta Chim. Slov. 55, 67–74 [Google Scholar]
- 22. Stern J. O., Peisach J. (1974) J. Biol. Chem. 249, 7495–7498 [PubMed] [Google Scholar]
- 23. Van Duyne G. D., Standaert R. F., Karplus P. A., Schreiber S. L., Clardy J. (1993) J. Mol. Biol. 229, 105–124 [DOI] [PubMed] [Google Scholar]
- 24. Gasteiger E., Gattiker A., Hoogland C., Ivanyi I., Appel R. D., Bairoch A. (2003) Nucleic Acids Res. 31, 3784–3788 [DOI] [PMC free article] [PubMed] [Google Scholar]
- 25. Hargrove M. S., Krzywda S., Wilkinson A. J., Dou Y., Ikeda-Saito M., Olson J. S. (1994) Biochemistry 33, 11767–11775 [DOI] [PubMed] [Google Scholar]
- 26. Hargrove M. S., Barrick D., Olson J. S. (1996) Biochemistry 35, 11293–11299 [DOI] [PubMed] [Google Scholar]
- 27. Hargrove M. S., Singleton E. W., Quillin M. L., Ortiz L. A., Phillips G. N., Jr., Olson J. S., Mathews A. J. (1994) J. Biol. Chem. 269, 4207–4214 [DOI] [PubMed] [Google Scholar]
- 28. Ruf H. H., Wende P. (1977) J. Am. Chem. Soc. 99, 5499–5500 [DOI] [PubMed] [Google Scholar]
- 29. Yu C., Gunsalus I. C., Katagiri M., Suhara K., Takemori S. (1974) J. Biol. Chem. 249, 94–101 [PubMed] [Google Scholar]
- 30. Sono M., Andersson L. A., Dawson J. H. (1982) J. Biol. Chem. 257, 8308–8320 [PubMed] [Google Scholar]
- 31. Sono M., Dawson J. H., Hager L. P. (1984) J. Biol. Chem. 259, 13209–13216 [PubMed] [Google Scholar]
- 32. Sono M., Dawson J. H., Hager L. P. (1985) Inorg. Chem. 24, 4339–4343 [Google Scholar]
- 33. Blumberg W. E., Peisach J. (1971) Adv. Chem. 100, 271–291 [Google Scholar]
- 34. Sono M., Hager L. P., Dawson J. H. (1991) Biochim. Biophys. Acta 1078, 351–359 [DOI] [PubMed] [Google Scholar]
- 35. Wallace C. J., Clark-Lewis I. (1992) J. Biol. Chem. 267, 3852–3861 [PubMed] [Google Scholar]
- 36. Low D. W., Hill M. G., Carrasco M. R., Kent S. B., Botti P. (2001) Proc. Natl. Acad. Sci. U.S.A. 98, 6554–6559 [DOI] [PMC free article] [PubMed] [Google Scholar]
- 37. Han J., Pedersen J. S., Kwon S. C., Belair C. D., Kim Y. K., Yeom K. H., Yang W. Y., Haussler D., Blelloch R., Kim V. N. (2009) Cell 136, 75–84 [DOI] [PMC free article] [PubMed] [Google Scholar]
- 38. Zhang L., Guarente L. (1995) EMBO J. 14, 313–320 [DOI] [PMC free article] [PubMed] [Google Scholar]
- 39. McCoubrey W. K., Jr., Huang T. J., Maines M. D. (1997) J. Biol. Chem. 272, 12568–12574 [DOI] [PubMed] [Google Scholar]
- 40. Yi L., Ragsdale S. W. (2007) J. Biol. Chem. 282, 21056–21067 [DOI] [PMC free article] [PubMed] [Google Scholar]
- 41. Igarashi J., Murase M., Iizuka A., Pichierri F., Martinkova M., Shimizu T. (2008) J. Biol. Chem. 283, 18782–18791 [DOI] [PubMed] [Google Scholar]
- 42. Gupta N., Ragsdale S. W. (2011) J. Biol. Chem. 286, 4392–4403 [DOI] [PMC free article] [PubMed] [Google Scholar]
- 43. Gilles-Gonzalez M. A., Gonzalez G. (2005) J. Inorg. Biochem. 99, 1–22 [DOI] [PubMed] [Google Scholar]
Associated Data
This section collects any data citations, data availability statements, or supplementary materials included in this article.


