Abstract
Background
The enantiomers of a chiral compound possess different biological activities, and one of the enantiomers usually shows a higher level of toxicity. Therefore, the exploration of the causative mechanism of enantioselective toxicity is regarded as one of primary goals of biological chemistry. Imazethapyr (IM) is an acetolactate synthase (ALS)-inhibiting chiral herbicide that has been widely used in recent years with racemate. We investigated the enantioselectivity between R- and S-IM to form reactive oxygen species (ROS) and to regulate antioxidant gene transcription and enzyme activity.
Results
Dramatic differences between the enantiomers were observed: the enantiomer of R-IM powerfully induced ROS formation, yet drastically reduced antioxidant gene transcription and enzyme activity, which led to an oxidative stress. The mechanism by which IM affects carbohydrate metabolism in chloroplasts has long remained a mystery. Here we report evidence that enantioselectivity also exists in starch metabolism. The enantiomer of R-IM resulted in the accumulation of glucose, maltose and sucrose in the cytoplasm or the chloroplast and disturbed carbohydrates utilization.
Conclusion
The study suggests that R-IM more strongly retarded plant growth than S-IM not only by acting on ALS, but also by causing an imbalance in the antioxidant system and the disturbance of carbohydrate metabolism with enantioselective manner.
Introduction
Pesticides are commonly applied to crops in order to control insects, disease and weeds. It has been estimated that more than 40% of currently used pesticides in China are chiral compounds [1], and the proportion is expected to increase as compounds with more complex structures synthesized. However, because of their similar physical-chemical properties, few enantiomers of chiral pesticide are used separately. Over the past two decades, many reports have been demonstrated that enantimers differ in biological properties including biodegradation [2], [3], acute or chronic toxicity [4], [5], developmental toxicity [6] and endocrine-disrupting activities [7]–[9].
Imidazolinone (IMI) herbicides are commonly applied as either pre- or post-emergence herbicides [10]. Duggleby and Pang reported that IMI binds to acetolactate synthase (ALS) and subsequently inhibits the synthesis of branched-chain amino acids (BCAA), particularly of valine (Val), leucine (Leu) and isoleucine (Ile) [11]. Imazethapyr (IM) is an ALS-inhibiting herbicide that has an asymmetric carbon atom, typically consisting of one pair of enantiomers, which can be separated by HPLC [12]. Zhou et al and Qian et al demonstrated that IM could enantioselectively inhibit rice or maize growth, and that R-IM showed a stronger inhibitory effect than S-IM [4], [13]. Furthermore, Zhou et al observed that R-IM inhibited the growth of maize by damaging the root morphostructure and ultrastructure more severely than that of S-IM [13]. By a molecular docking method, Zhou et al reported different modes of interaction by R- and S-IM with ALS [14].
Many publications have shown that biotic and abiotic stresses, such as low and high temperatures [15]–[17], UV irradiation [18], ozone [19], excess excitation energy [20], pathogen infection [19] and pesticides [21]–[23] lead to the overproduction of reactive oxygen species (ROS) in plants. ROS can destroy organelles, damage the membrane system and inhibit related gene expression. To cope with these ROS, plants have evolved intricate mechanisms to remove ROS by means of antioxidants and antioxidative enzymes. In fact, the reaction between antioxidants and ROS is known to occur in all living organisms [24], and life is a balance between them. Under optimal plant growth conditions, ROS are mainly produced at a low level in organelles (i.e., chloroplasts, mitochondria and peroxisomes), and antioxidants serve to reduce the levels of ROS, permitting them to perform useful biological functions without causing too much damage [25]. Under stress, electrons that have a high-energy state are transferred to molecular oxygen to produce ROS [26], [27], which damage proteins, DNA and lipids [28]. The main cellular enzymes/pathways that remove ROS from plants include: (1) superoxide dismutase (SOD) (e.g., in chloroplasts as part of the water-water cycle); (2) catalase (CAT) in peroxisomes; (3) glutathione peroxidase and its regenerating cycle (GPX); and (4) the ascorbate-glutathione (the Halliwell-Asada pathway, APX) pathway in the stroma, cytosol, mitochondria and apoplast. Although some reports have shown that R-IM damages the root morphostructure and ultrastructure, and that it inhibits gene expression more strongly than S-IM, little is known about the enantioselective response of IM on ROS formation and its effects on the antioxidant system.
Plant growth is significantly affected by carbohydrates produced via photosynthesis [29]. Besides used for biosynthesis of many important molecules such as proteins, nuclear acids and lipids, fixed carbon can also be temporally stored in the form of starch. Therefore, plants must achieve a balance between carbon assimilation and carbon storage and growth [30]. Although it is known that IM retards plant growth enantioselectively, we still do not know whether it is involved in disturbing carbon metabolism.
To gain a deeper insight into the enantioselectivity of IM in plants, and, in particular, to determine the interaction between oxidants and antioxidants, starch synthesis and degradation, we selected the model plant Arabidopsis thaliana for our study. Given that most antioxidant proteins are encoded by multigene families sharing high sequence identities, we used quantitative real-time PCR to sensitively and gene-specifically determine the mRNA levels of antioxidant enzymes, which included seven SOD genes, one CAT gene, six APX genes and eight GPX genes.
Results
Enantioselective effects of IM on plant growth
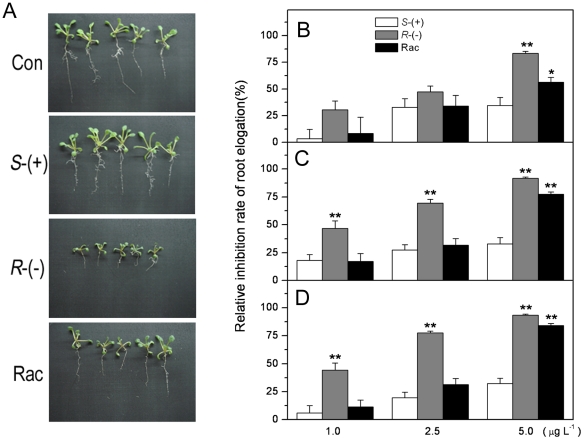
When plantlets were grown on the media containing S-IM, R-IM or racemate, a significant difference in plant growth was observed among treatments (Figure 1A). R-IM was more effective to inhibit plant growth than S-IM or racemate. Figure 1B, C and D showed root elongation of plants treated by the three tested concentrations of IM enantiomers and racemates after two, three and four weeks of exposure, respectively. We analyzed the relative inhibition rate of the root (RI) elongation and observed that RI increased in a dose-dependent manner of IM. At a concentration of 1 µg L−1, R-IM treatment showed the strongest inhibitory effect on roots, and the RI reached about 45% after 3 weeks of exposure. At the concentrations of 2.5 and 5.0 µg L−1 IM, the inhibitory effects of the enantiomers and racemates were stronger than that observed at 1 µg L−1. Among the enantiomers and racemates, R-IM showed the strongest inhibitory effect, and the maximum RI reached 93.4% while S-IM and racemate treatments reached to 34.4% and 83.9%, respectively. Based on this result, we selected 2.5 µg L−1 concentration of IM enantiomers in the following experiments.
Figure 1. Phenotype of Arabidopsis thaliana plants subjected to IM-enantiomer treatment.
A. Photograph of the control and plants treated by R-, S-IM and the racemic mixture; The relative inhibition rate of root elongation of A. thaliana is shown in B–D, after 2, 3 and 4 weeks of IM exposure, respectively. * represents a statistically significant difference (of p<0.05), when compared to that of S-IM exposed plants; ** represents a statistical significance at the p<0.01 level.
The assessment of plant growth was also carried out by measuring the fresh weight (FW) of plantlets after exposure to the IM enantiomers (Table 1). The FW of plantlets in the control reached approximately 11.4 mg per plantlet after 3 weeks of growth, but slightly decreased in the S-IM treatment (16.7%) and drastically in the R-IM treatment (73.7%) and the racemic mixture (41.2%). A similar phenomenon was observed after 4-weeks exposure, but the decrease was more evident and only 32.8%, 75.2% and 50.4% of the control after S-IM, R-IM and racemate exposure, respectively.
Table 1. The effect of IM enantiomers on fresh weight (FW), malondialdehyde (MDA) and water content (WC).
| 3 week | 4 week | |||||
| F.W. (mg/plantlet) | MDA (nmol/mg FW) | WC (%) | FW (mg/plantlet) | MDA (nmol/mg FW) | WC | |
| Control | 11.4±2.2 | 0.1±0.0 | 92.5±0.6 | 23.8±2.1 | 0.1±0.0 | 92.5±0.8 |
| S-(+)-IM | 9.4±1.2 | 0.1±0.0 | 92.5±0.7 | 16.0±1.3** | 0.1±0.0 | 90.3±1.2 |
| R-(−)-IM | 3.0±0.5** ## | 0.6±0.1** ## | 87.4±0.6** ## | 5.9±0.5** ## | 0.6±0.1** ## | 86.2±1.4** ## |
| Rac | 6.8±0.6** | 0.3±0.0* | 91.9±0.2 | 11.8±0.8** | 0.3±0.0* | 91.6±1.2 |
* or ** indicates that the values are significantly different, as compared with the control (p<0.05 or 0.01, respectively).
indicates that the values are significantly different, as compared with those of the S-IM-treated plants (p<0.01).
The enantioselective effects of IM on ALS activity and amino acid synthesis
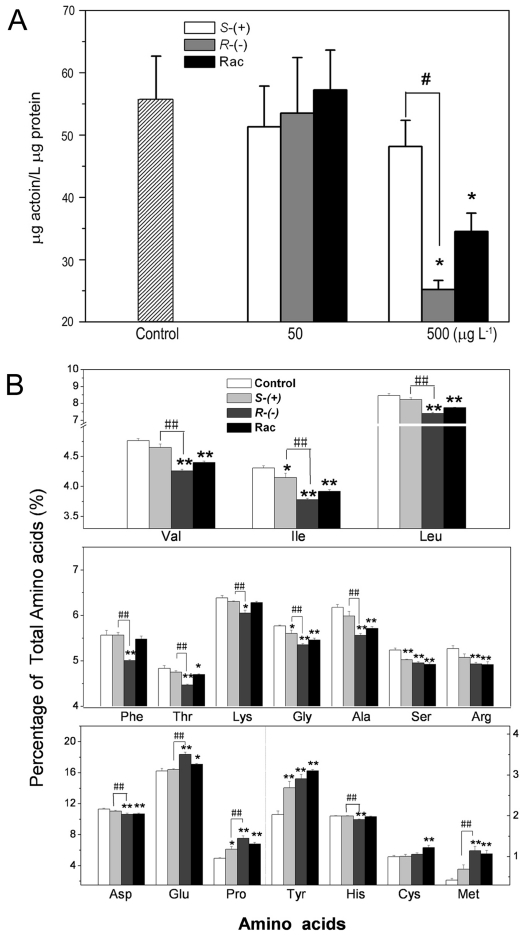
Given that ALS is a target of IM, we measured the ALS activity in vitro after IM enantiomer exposure. As shown in Figure 2A, the concentration of 50 µg L−1 IM did not influence ALS activity in plants. When treated with a higher concentration of IM and its R- and S- enantiomers (500 µg L−1), the activity of ALS decreased to 61.9%, 45.2% and 86.5% of the control, respectively. This result is consistent with the above data showing that R-IM is the most effective in inhibition of plant growth.
Figure 2. The effect of IM enantiomers on ALS activity in vitro and amino acid content.
A. The effect of IM enantiomers on ALS activity in vitro; B. Amino acid content of Arabidopsis thaliana after 4 weeks of exposure. * or ** indicate that the numbers are significantly higher than those of the wild-type plants (p<0.05 or 0.01, respectively). # or ## indicate that the numbers are significantly different compared to those of S-IM-exposed plant (p<0.05 or 0.01, respectively).
Since ALS is the key enzyme in the synthesis of BCAAs, we measured content of amino acids. The content of Ile, Leu and Val decreased significantly after IM racemate and R-, S-IM treatment (Figure 2B); and only 87.7%, 87.5% and 89.5% of the control, respectively, in the R-IM treated group. The content of other amino acids (i.e., Phe, Thr, Lys, Gly, Ala, Ser, Arg, and Asp) in plants treated with IM also decreased compared with those in the control. Among them, R-IM also showed the strongest inhibition of biosynthesis of the above amino acids. In contrast, concentrations of Pro, Glu, Met and Tyr increased when plants treated by IM (Figure 2B). Proline accumulation was also reported in rice when treated by IM [4]. Accumulation of proline has been regarded as a marker for monitoring a plant response to environmental stresses as it acts as a stress-related signaling molecule [31], [32].
The enantioselective effects of IM on superoxide radical and hydrogen peroxide accumulation
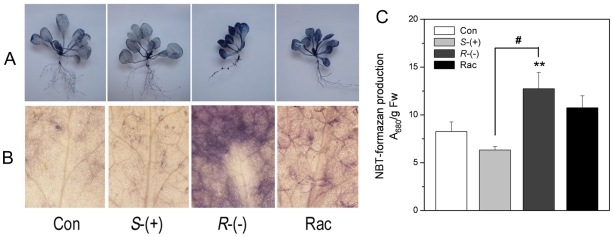
To investigate whether an oxidative stress is generated by treatment with IM enantiomers, superoxide radical (O2 −) were examined by NBT-staining (nitroblue tetrazolium, NBT). As shown in Figure 3A and B, the deepest blue coloration was detected in plants treated with R-IM among all treatments. Quantification of the formazan spots demonstrated that R-IM-treated plants produced higher amounts of formazan precipitate than the control, S- IM or racemate (Figure 3C). These results suggest that R-IM has the strongest capacity to induce superoxide radicals.
Figure 3. The superoxide anion accumulation after 4 weeks of IM-enantiomer treatment.
A. A plantlet stained with NBT; B. A leaf stained with NBT; C. The colorimetric quantification of NBT-formazan production in plant extracts. ** indicates that the numbers are significantly higher than those of the control plants (p<0.01). # indicates that the numbers are significantly higher than those of S-IM-exposed plant (p<0.05). FW, fresh weight.
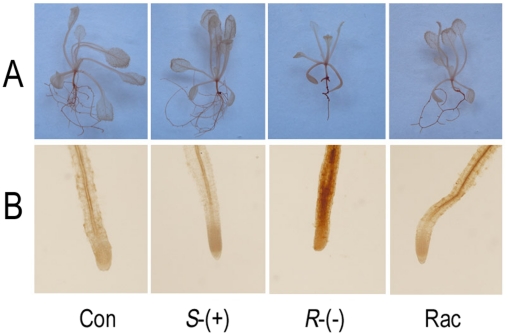
We also tested for hydrogen peroxide accumulation in IM enantiomer-treated plantlets using 3,3′-diaminobenzidine (DAB) staining, where an increase in the intensity of the red-brown stain is correlated with an increase in the H2O2 concentration. Unexpectedly, the intensity of red-brown staining in the leaf was not significantly affected by IM enantiomers (Figure 4). However, root tissue showed the strongest intensity of red-brown staining when plants treated by R-IM but not by S-IM. The red-brown color in roots treated with the IM racemate was of intermediate intensity (i.e., between the R-IM and S-IM levels). Because DAB staining relied on the presence of H2O2, we conclude that H2O2 was induced to the highest level by the treatment of R-IM, and H2O2 accumulation was more significant in the root than in the leaf.
Figure 4. Hydrogen peroxide accumulation after 4 weeks of IM-enantiomer treatment.
A. A plantlet stained with DAB; B. A root stained with DAB.
The enantioselective effects of IM on subcellular structure
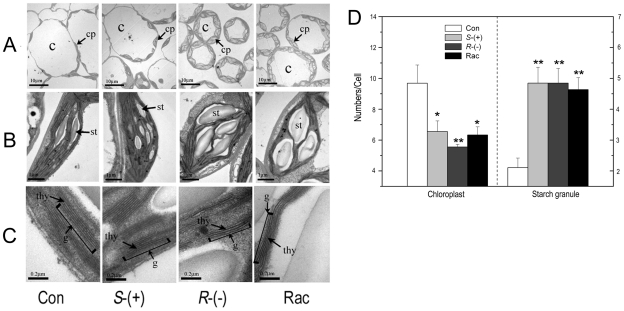
The chloroplast is one of the main sources of ROS, and an increase of ROS may damage the organelle's structure. Therefore, the structure of the chloroplast subcellular membranes was investigated. Figure 5 A–C showed that IM had a marked effect on the number and structure of chloroplasts. The number of chloroplasts per mesophyll cell in one cut section decreased from 9.7 in the control cell to 6.6, 5.6 and 6.3 per cell after S-, R-IM and racemate treatment, respectively (Figure 5D). We also observed that the cell size was reduced (the vacuole also became smaller) after IM treatment, and chloroplasts appeared swollen and misshapen, which was especially evident after the R-IM treatment. To test whether this result was caused by water loss in the cell, we measured the water content (WC) in fresh plantlets. We observed that the value of WC in R-IM treatment was significantly lower than that of the control and S-IM treatment, while WC in the S-IM and racemate treatments did not change significantly (Table 1).
Figure 5. Changes of chloroplasts in A. thaliana after 4 weeks of IM-enantiomer treatment.
A. Mesophyll cell structure; B. Chloroplast structure; C. Grana lamella structure; D. Number of chloroplast and starch granule per cell. cp, chloroplast; sg, starch granule; g, grana; thy, thylakoid. * or **represents a statistically significant difference of p<0.05 or 0.01, respectively, when compared to that of control.
Figure 5B and D show that starch granules increased to approximately five granules per chloroplast in one cut section in the three treatment groups, as compared with two granules in the control. In many cells, the increased starch occupied almost the entire chloroplast after R-IM and racemate exposure. We also observed the structure of the grana lamella and found that this structure did not change noticeably after S-IM treatment, but it did become thin or partially disrupted after R-IM treatment (Figure 5C).
The enantioselective effects of IM on the starch and sugar contents
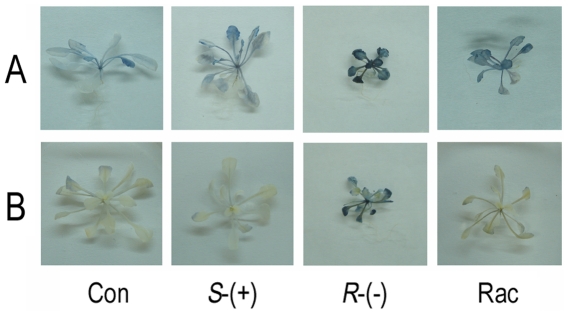
Given that starch granules increased after the treatment with R-IM, we stained for starch with an iodine solution at the end of the light and dark cycles. The leaves of plants exposed to R-IM were stained the darkest at the end of the light cycle, which indicated that they contained a significant amount of starch. The racemate-exposed plants stained slightly, as compared with the control, and the S-IM-treated plants stained with approximately the same intensity as the control. We also examined the leaves at the end of the dark period and found that the staining was very light, which indicated that most of the starch was degraded after the dark period in the S-IM and racemate treatments and in the control. Conversely, the leaves treated with R-IM stained very darkly, which indicated that a significant amount of starch was not degraded in these leaves (Figure 6).
Figure 6. Plants stained for the presence of starch with iodine after 4 weeks of IM exposure.
A. Plants harvested at the end of the light; B. Plants harvested at the end of the dark.
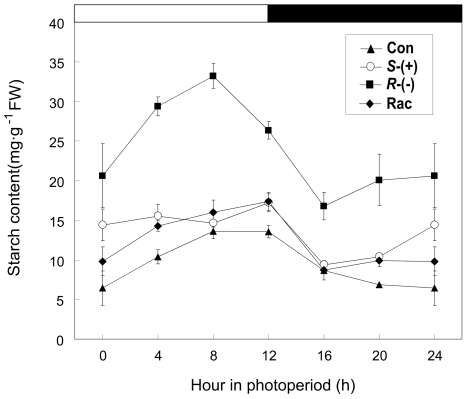
In order to further investigate the change in the starch content during the diurnal cycle, we measured the starch content at specific time points (Figure 7). The control plants displayed a steady rate of starch accumulation in the light, which reached a peak at the end of the light and then began to decline, reaching a minimum at the end of the dark period; these results agree with previous reports [33], [34]. R-IM-exposed plants also showed starch accumulation in the light, which reached a peak (approximately 33.22 mg g−1 FW) before the end of the light period. The starch decreased before the dark period, and the lowest starch content was approximately 16.77 mg g−1 FW. Compared with other treatments and the control, the R-IM-exposed plants had much higher levels of starch all day (about 2.5-fold compared with the control), even at the end of the dark cycle, indicating that a considerable amount of starch was not degraded, which was in complete accord with the staining result. The trend of the change in starch content in plants treated with S-IM and the racemic mixture was similar to the control; however, the starch content in those treatments (i.e., S-IM and racemate) were a bit higher than in the control, a result which was also observed in the TEM and iodine staining.
Figure 7. The diurnal changes of the starch content after 4 weeks of IM exposure.
The white and black solid bars indicate the time of the light and dark period, respectively.
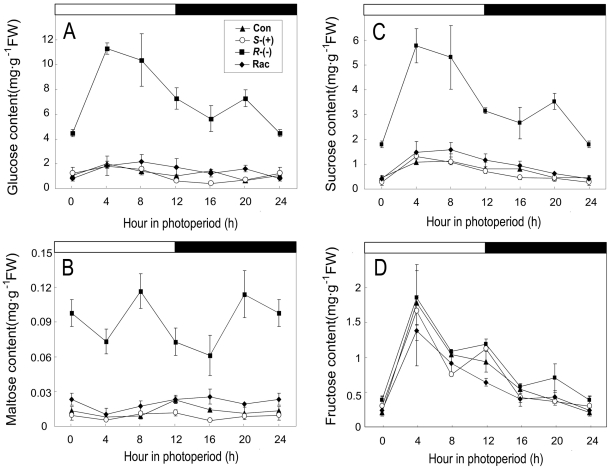
Starch accumulates in the light as carbon storage and is degraded into sugar to maintain plant growth in the dark. Therefore, we measured the change of glucose, maltose, sucrose and fructose contents during the diurnal period. The glucose content maintained a relatively stable level both in the light and dark periods in the control, S-IM and racemate-treated groups. However, the glucose content in the R-IM group increased 3.3- to 10.8-fold, compared with that of the control, and it was accompanied by an evident wave upon exposure to light; it increased quickly after transfer to the light period and subsequently decreased after 4 h of illumination until the onset of the dark period (Figure 8A). The change in the maltose and sucrose contents after IM exposure was similar to that of glucose: R-IM exposure induced an increase of the maltose and sucrose contents to 3.2–13.3-fold and 2.5–5.4-fold of the control, respectively. The content of maltose in the R-IM group exhibited an obvious wave and increased to its peak after 8 h of illumination; the maltose content then decreased sharply and reached a minimum after 4 h of dark treatment. Subsequently, the maltose content increased to higher levels. The content of sucrose in the R-IM group also showed a significant wave, and it increased to its peak after 4 h of illumination; the sucrose content then decreased and reached a minimum at the end of the dark treatment (Figure 8B, C). The contents of maltose and sucrose in the treatment of the racemic mixture were a little higher than in the control but did not change after S-IM treatment. The content of fructose did not show a significant difference among the treatments (Figure 8D). These results suggest that carbon metabolism is also significantly altered along with nitrogen metabolism in IM-treated plants.
Figure 8. The diurnal changes of glucose, maltose, sucrose and fructose content after 4 weeks exposure.
A. glucose content; B. maltose content; C. sucrose content; D. fructose content. The white and black solid bars indicate the time of the light and dark period, respectively.
The enantioselective effects of IM on antioxidant gene relative transcript levels
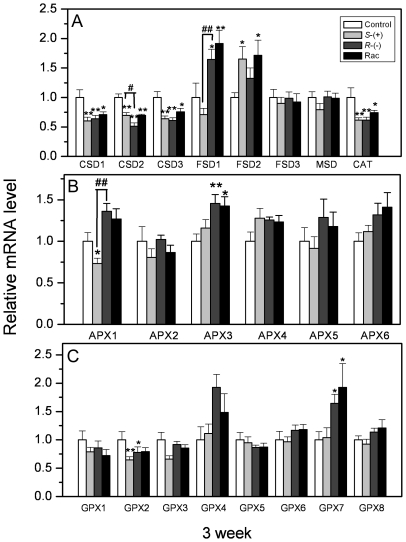
One of main objectives of this work was to determine the effects of IM enantiomers on the expression of the antioxidant enzymes of A. thaliana. The first group of enzymes studied was the SODs, which are metalloenzymes that catalyze the conversion of O2 ·− into O2 and H2O2. There are three types of SODs in A. thaliana that differ both in the metal cofactor at their active site and in their subcellular localization, as follows: cytosolic CuZnSOD (CSD1), thylakoidal CuZnSOD (CSD2), peroxisomal CuZnSOD (CSD3), thylakoidal FeSOD (FSD1, also located in mitochondria, the plasma membrane and chloroplast envelop), two chloroplast FeSODs (FSD2 and FSD3, also located in the chloroplast nucleoid), and mitochondrial MnSOD (MSD1). Based on the results of root growth (Figure 1), we selected a treatment of 2.5 µg.L−1 of IM to analyze the transcription of antioxidant genes. Figure 9A shows the effects of IM enantiomers on the relative transcripts of SOD genes after three weeks of exposure. The transcript levels of CSD1, CSD2 and CSD3 decreased significantly after IM exposure, and the decrease of CSD2 transcript was more evident after R-IM treatments and showed enantioselectivity. The transcript levels of FSD1 and FSD2 increased significantly, and FSD2 expression showed enantioselectivity after R-, S-IM and racemic mixture treatments. The transcript levels of other SOD genes did not change noticeably.
Figure 9. The gene expression of antioxidant enzyme in A. thaliana after 3 weeks of IM exposure.
A. Gene expression of superoxide dismutase (SOD) and catalase (CAT); B. Gene expression of ascorbate peroxidase (APX); C. Gene expression of glutathione peroxidase (GPX). Values were normalized against actin 2 as housekeeping gene, and represent relative mean mRNA expression value ±SEM of 3 individuals. * or ** represents a statistically significant difference when compared to that of the control (p<0.05 or 0.01, respectively). # or ## represents a statistically significant difference when compared to S-IM-exposed plants (p<0.05 or 0.01, respectively).
The expression of critical enzymes involved in the scavenging of H2O2 was also studied under IM-enantiomer treatment. CAT converts H2O2 to H2O and O2, and is localized in the cytosol, chloroplasts, mitochondria and peroxisomes. The transcript levels of the CAT gene decreased to 62%, 62% and 74% after R-, S-IM and racemic mixture treatments (Figure 9A), as compared to the control, but did not show enantioselectivity. Ascorbate peroxidases (APXs) are also key enzymes that scavenge hydrogen peroxide in plant cells. In this study, six types of APX were analyzed, which included three cytosolic (APX1, APX2, APX6) and three microsomal (APX3, APX4, APX5) enzymes. Compared with that of the control, the transcript levels of APX2, APX4, APX5 and APX6 were not affected significantly by IM treatment. However, the expression of APX1 decreased after S-IM exposure and showed enantioselectivity. In contrast, the abundance of APX3 transcript increased after R-IM and racemate treatment (Figure 9B). Glutathione peroxidases (GPXs) are a group of enzymes that catalyze the reduction of H2O2 in the presence of glutathione (the hydrogen donor). Milla et al (2003) identified seven GPX genes in Arabidopsis thaliana, and we used this molecular information to quantify their mRNA levels in IM-exposed plantlets [35]. However, we found that the transcript levels of GPXs did not change significantly, except that GPX2 decreased appreciably after IM exposure, and GPX7 increased after R-IM and racemate treatment (Figure 9C).
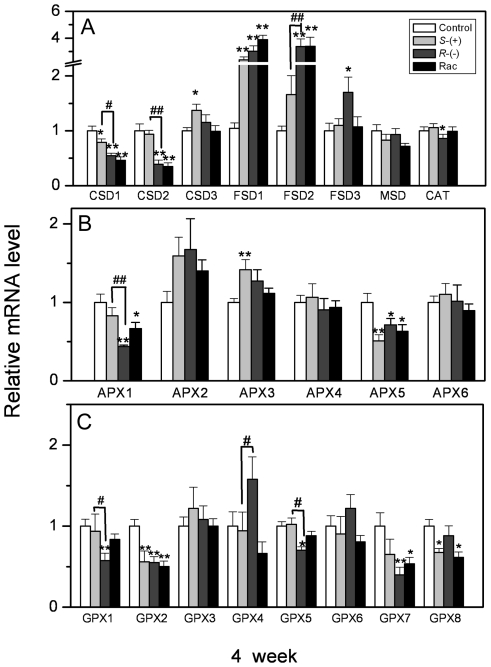
Figure 10 shows the effects of the IM enantiomers on the relative transcript levels of antioxidant genes after 4 weeks of exposure. The transcript levels of CSD1 and CSD2 genes were down-regulated and showed enantioselectivity, while FSD1 and FSD2 increased significantly and reached 3.9- and 3.4-fold of the control, respectively. The transcript levels of FSD3 increased to 2.1-fold of the control after R-IM exposure, but it did not change after S-IM or racemate treatment. Similarly, the transcript level of CAT was also down-regulated significantly only by R-IM exposure (Figure 10A). The transcript level of APX1 was down-regulated after the treatment of R-IM and the racemic mixture to a degree that was 44% and 67% of the control, respectively, but it was not affected by S-IM. The transcript level of APX3 was up-regulated after S-IM exposure, APX5 was down-regulated by IM enantiomers exposure, and other APX genes were not affected (Figure 10B). The transcript levels of GPX1 and GPX5 were down-regulated after R- IM exposure and showed enantioselectivity. The transcript levels of GPX2, GPX7 and GPX8 were also down-regulated to some degree after IM-enantiomer treatment, whereas other GPX genes did not visibly change (Figure 10C).
Figure 10. The gene expression of antioxidant enzyme in A. thaliana after 4 weeks of IM exposure.
A. Gene expression of superoxide dismutase (SOD) and catalase (CAT); B. Gene expression of ascorbate peroxidase (APX); C. Gene expression of glutathione peroxidase(GPX). Values were normalized against actin 2 as housekeeping gene, and represent relative mean mRNA expression value ±SEM of 3 individuals. * or ** represents a statistically significant difference when compared to that of the control (p<0.05 or 0.01, respectively). # or ## represents a statistically significant difference when compared to S-IM-exposed plants (p<0.05 or 0.01, respectively).
The enantioselective effects of IM on antioxidant enzyme activities
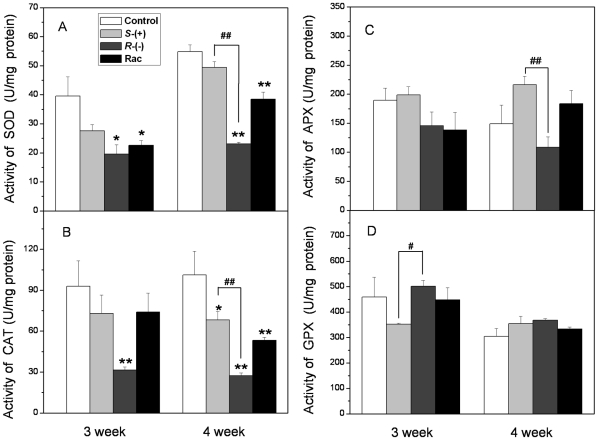
The effect of IM priming on the activity of antioxidant enzymes was studied in plantlets in order to compare it with the changes in antioxidant gene expression. We also evaluated the activities of antioxidant enzymes in 3- and 4-week-exposed plantlets. The activity of SOD is shown in Figure 11A; it decreased significantly after R-IM and racemate treatment but did not change perceptibly after S-IM exposure. The lowest activity of SOD was only 42.1% of the control, which was measured in plants after R-IM exposure. Measurements of CAT activity also indicated some significant changes following the treatment with IM; after 3 weeks of exposure, CAT activity decreased very significantly and was only 33.9% of the control after the R-IM exposure. S-IM and racemate treatment did not affect CAT activity significantly. However, CAT activity in the 3 treatment groups all decreased after 4 weeks of exposure, and the lowest CAT activity (R-IM treated group) was only 27.0% of the control (Figure 11B). Surprisingly, IM treatment did not affect APX or GPX activity (Figure 11C, D).
Figure 11. The activity of antioxidant enzyme in A. thaliana after 3 and 4 weeks exposure. *.
A. The activity of superoxide dismutase (SOD); B. The activity of catalase (CAT); C. The activity of ascorbate peroxidase (APX); D. The activity of glutathione peroxidase(GPX). * or ** represents a statistically significant difference when compared to that of the control (p<0.05 or 0.01, respectively). # or ## represents a statistically significant difference when compared to S-IM-exposed plants (p<0.05 or 0.01, respectively).
Finally, we measured the levels of malondialdehyde (MDA), which are indicative of lipid peroxidation as a marker of oxidative stress. The content of MDA increased by 4.6- and 1.8-fold after 3 weeks of R-IM and racemate exposure, respectively, but did not change after S-IM exposure. The change of MDA levels also showed the same pattern after four weeks of exposure (Table 1).
Discussion
In this work, we investigated the effects of the enantioselective phytotoxicity of imazethapyr on the oxidant system and starch metabolism in Arabidopsis thaliana at the physiological and molecular levels. We used root length as an index of growth, because root length is an important agronomic trait and is easily affected by environmental stresses [36], [37]. The inhibition of root growth was more obvious as the treatment concentration increased, and also exhibited enantioselectivity. R-IM, S-IM and the racemic mixture all inhibited the Arabidopsis growth, as demonstrated in other plant species [4], [13]. Our results showed that R-IM has the strongest inhibitory effect on while S-IM has the lowest effect the growth of roots.
We also provided several lines of evidence supporting enantioselective effects of IM on the antioxidant system. We first evaluated the formation of ROS by a staining method and found that IM could stimulate ROS overproduction. It has been known that abiotic or biotic stress usually resulted in ROS overaccumulation [27]. ROS have been regarded as a signal that regulates plant growth, cell cycle, programmed cell death and cellular responses to biotic and abiotic stresses [36], [38]. We observed that R-IM induced the elevation of O2 .− and H2O2 levels more strongly than S-IM and the racemate (Figure 3). Then we examined the MDA content, an indicator of lipid peroxidation, and observed that R-IM treatment indeed resulted in MDA levels that were higher than S-IM (Table 1). Subsequently, TEM revealed that chloroplasts looked small, especially after R-IM treatment (Figure 5). The grana thylakoids became thin, and the integrity of a few membranes maybe disrupted; Mittler et al and Liu et al have reported that overproduction of ROS can initiate a variety of oxidative reactions on membrane unsaturated fatty acids, thus leading to the destruction of organelles and macromolecules [39], [40].
Based on previous reports, oxidative stress may be induced by an imbalance between ROS accumulation and scavenging factors, such as antioxidant enzymes. In this study, we aimed to analyze whether the expression of antioxidant genes changed following ROS production. Given that these antioxidant enzymes are encoded by multigene families, and that RNA gel blots are not amenable for the quantification of mRNAs [41], we utilized real-time PCR to analyze more than 20 genes encoding antioxidant enzymes in Arabidopsis thaliana. However, the transcription of these genes was complex and did not show a regulatory mechanism similar to that reported by Rubio et al [41]. Approximately ten of the antioxidant enzyme genes did not show either a significant change or enantioselectivity. Two of the genes showed an increase in transcript levels after IM exposure, and approximately ten antioxidant enzyme genes decreased after IM exposure and showed enantioselectivity. Transcription of these down-regulated genes was affected by R-IM exposure more strongly than by S-IM exposure. The activities of CAT, the SODs and APXs also decreased after IM exposure and were more affected by R-IM exposure than by S-IM exposure. These results demonstrate that ROS scavenging systems are rather suppressed, and ROS are enhanced, by IM exposure, as has been reported for others stress treatments [28], [42], especially R-IM.
It is easy to understand that herbicides may cause a reaction in the antioxidant pathway; several prior reports have proven that the target of IM is ALS in vivo and in vitro [43]–[45]. Our results demonstrated that the activity of ALS was inhibited enantioselectively by IM enantiomers in Arabidopsis. We also measured the amino acid content and found that levels of the three BACC decreased after IM exposure, especially following R-IM treatment; however, the decrease of BACC levels was less than 15%. If ALS is the sole target, can the decrease of BACC levels cause so evident a retardation of growth? Taking into account the results of TEM, where we observed the accumulation of many starch granules (to different degrees) in chloroplasts after IM-enantiomer exposure, we speculated whether carbohydrate biosynthesis or metabolism were also affected enantioselectively. Starch is one of the major products of photosynthesis in higher plants; it builds up in chloroplasts via the fixation of carbon during the day, and it is degraded to sugar during the night to sustain metabolism and growth [46], [47]. Gaston et al and Royuela et al have reported that imazethapyr caused starch or soluble sugar accumulation in pea, while Scarponi et al observed the contrary: IM significantly decreased starch content, but it increased glucose content, in soybean. In this study, we provided various evidence for the assertion that the starch content increased significantly and showed enantioselectivity after IM-enantiomer exposure [44], [48], [49]. Given that the accumulation and degradation of starch is controlled by circadian rhythms [50], we selected six specific time points, rather than one sampling point, to analyze the change in the starch and sugar content. In control plantlets, starch accumulated during the light period and reached a peak at the end of light exposure. Thereafter, the starch content began to decline, and by the end of dark period, was almost absent; however, the pattern of starch accumulation and degradation after R-IM exposure was impeded. Starch stopped accumulating before the end of the light cycle but was not degraded completely at the end of dark period. We analyzed the starch content from 8 d to 28 d by staining with iodine, and found that the starch accumulation at the end of dark period gradually increased from two-leaf plantlet (Figure S1). Starch degradation was clearly disturbed by R-IM; however, the pathway of starch degradation inside chloroplasts is relatively complex and requires the coordinated actions of a suite of enzymes [51]. We simply evaluated the expression of DSP4, which is the predominant phosphatase that is bound to chloroplast starch granules to control starch degradation (its down-regulation enhances starch accumulation), and we observed that the transcript levels of DSP4 significantly decreased after R-IM and racemate treatment (Figure S2).
Did the inhibition of starch degradation cause the decrease of sugar levels, which resulted in a shortage of a carbon source for growth and energy? To answer this question, we based our postulation of the following observation: that the carbohydrate content, including glucose, maltose and sucrose, in the R-IM treatment also accumulated to higher levels than in the control and the S-IM treatment. Therefore, we speculate that the degradation products (i.e., hexoses and phosphate) were not transported out of the chloroplast and further exported to heterotrophic tissues; thus, there was a lack of a carbon source for growth [30], [52], which resulted in an inhibition of plant growth after R-IM treatment. This phenomenon has been also found in the maltose transporter mutant (mex1) and glucanotransferase mutant (dep2), in which growth was clearly inhibited, and the plants accumulated high levels of starch and maltose [33], [47].
Sugar has been proved not only as a powerful driver of plant growth, but also as an effective signaling molecule [53]. High concentration of sugar inhibited chlorophyll accumulation and photosynthesis-related gene transcription [54]. Given C skeletons from sugar are necessary to synthesize amino acids, and plants process an intricate regulatory machinery to coordinate carbon (C) and nitrogen (N) assimilation, thus we analyzed whether transcript of key genes in C/N assimilation (i.e. Glutamate Receptor 1.1 (AtGLR 1.1), GS (Glutamine Synthetase) and GS2 (Glutamine Synthetase 2) [55], [56] was regulated by higher concentration of sugar (or regulated by IM enantioselectively). We observed that the transcript of these three genes did not change significantly by the treatment of either R- or S-IM (Figure S3), which meant sugar accumulation caused by IM did not regulate gene transcription in C/N assimilation enantioselectively. This result also suggested that the mechanisms by which sugars influence plant development and gene expression are complicated, and multiple sugar-response pathways and molecules actually being involved in the mechanisms might be not known in all cases.
In summary, as a chiral herbicide, IM affected Arabidopsis growth in an enantioselective manner. Doubtless, R-IM had a stronger herbicidal effect than S-IM. R-IM inhibited ALS activity that resulted in a decrease in the synthesis of various amino acids; it stimulated ROS formation, yet it decreased antioxidant gene expression and their enzymes activities, resulting in the disruption of membrane structure. Furthermore, another main cause of the enantioselective phytotoxicity that was observed for R-IM was a strongly disturbed carbohydrate utilization, which resulted in the almost complete cessation of plant growth.
Materials and Methods
Chemicals and Reagents
The racemic imazethapyr mixture (98% purity) was kindly provided by Shenyang Research Institute of Chemical Industry (Shenyang, China). Solvents used in the IM separation were HPLC-grade from Tedia (Fairfield, OH, USA). Enantiomers were separated according to Lin et al [12]. The imazethapyr enantiomers or racemic solutions were dissolved in acetone, with a final solvent concentration of 0.05% (v/v) for each experimental solution and the control.
Plant materials, root length analysis and water content measurements
A. thaliana (ecotype Columbia [Col]) seeds were
provided by Prof. Jirong Wang (National Laboratory of Plant Molecular Genetics,
Institute of Plant Physiology and Ecology, Chinese Academy of Sciences). Seeds
were sterilized with ethanol (75%) for 1 minute (min), extensively washed
with distilled water and then sterilized with HgCl (0.1%) for 15 min.
Sterilized seeds were vernalized at 4°C room for 2 days, and then germinated
on agar plates with MS medium (supplemented with 30 g L−1
sucrose) and different concentrations of IM enantiomers or racemate in a culture
room, equipped with cool-white fluorescence lights (approximately 300
µmol/m2/s) at a constant temperature of 25±0.5°C
and a 12-hour (h) light/12-h dark cycle. Triplicate cultures were prepared for
each treatment, every replicate contained at least five plantlets, and samples
were taken after three and four weeks for RNA or enzyme extraction. The relative
inhibition rate of root elongation caused by the IM enantiomers and racemate was
determined the second week and calculated as previously reported [4]. The plantlets
were dried at 95°C for 1 h to measure the water content (WC) by the
following equation: WC
(%) =  , where
 presents the average of the fresh weight and
 presents the dry weight. Three replicates were used for
each treatment; every replicate contained five plantlets. According to the
results of relative inhibition rate, 2.5 µg L−1 of IM
enantiomers were selected in the following experiments.
ALS activity measurements in vitro and the amino acid content analysis
Protein was extracted from four-leaf-stage plantlet tissue (5 g) without IM exposure. Tissue was frozen with liquid nitrogen and ground to a fine powder using pestle in the buffer containing 100 mM potassium phosphate buffer (pH 7.5), 1 mM sodium pyruvate, 5 mM MgCl2, 0.5 mM thiamine-pyrophosphate, 10 µM FAD and 10% (v/v) glycerol. Crude enzyme fraction was mixed with 50 and 500 µg L−1 (final concentrations) and reacted at 37°C for 90 min, and ALS activity measure was according to the method of Laplante et al [57].
Arabidopsis plantlets were collected after four weeks of IM exposure for amino acid measurement. Samples were; three replicates were used in each treatment. Approximately 300 mg of fresh plantlets were hydrolyzed in 5 ml of 6 N HCl under vacuum in an ampulla tube for 24 h at 110°C. The suspension was then filtered and evaporated under vacuum. The solid residue was dissolved in 2 ml of deionized water and evaporated twice again. The final residue was dissolved in 10 ml of 0.01 N HCl and filtered with a 0.45-µm filter membrane for the quantification of amino acids using an L-8800 automatic amino acid analyzer (Hitachi, Japan).
Superoxide radical and hydrogen peroxide staining
The nitroblue tetrazolium (NBT) staining method of Rao and Davis (1999) was modified for the in situ detection of superoxide radicals [58]. After 4 weeks of IM exposure, the treated and control plantlets were immersed with a solution containing NaN3 (10 mM) and NBT (0.1% w/v) at 80°C for 20 min, the stained plantlets were bleached in 75% ethanol solution at 80°C for ∼5 min. Superoxide radical (O2 .−) was visualized as a blue color produced by NBT precipitation. Superoxide radical quantification was according to the method of Myouga et al [59]. H2O2 accumulation in plants was visualized by 3, 3′-diaminobenzidine (DAB) staining, according to the method of Thordal-Christensen et al [60]. The plantlets were immersed in 1.25 mg ml−1 DAB, incubated on an orbital shaker for 18 h and then bleached in 95% (v/v) ethanol for 10 to 40 min to remove the chlorophyll. DAB is rapidly absorbed by plant tissue and is polymerized locally in the presence of H2O2 to yield a visible brown color.
Subcellular structure detection by transmission electron microscopy
For microscopic analysis, samples of the control and 4-week IM-treated plantlets were fixed and embedded, according to previous reports [61]. For transmission electron microscopy (TEM), ultra-thin sections (70–90 nm) were prepared using a Reichert Ultracut ultramicrotome, stained with uranyl acetate followed by lead citrate and observed in a JEM-1230 microscope (Japan JEOL).
Measurement of starch and sugar
For the measurement of starch and sugar, leaves were harvested at specified time points of the diurnal cycle from control and IM-exposed plants. Leaves were transferred to 80% ethanol and incubated in a boiling-water bath for 3 min (repeated three times) to remove pigments for starch measurement. Starch was digested with amyloglucosidase and α-amylase and then assayed for glucose [62]. Another part of leaves were boiled in water for 10 min and ground using pestle for sugar measurement. Supernatant was filter through 0.45 µm filter membrane and measured using high performance ion chromatography (ICS-3000, Dionex).
RNA extraction, reverse transcription and real-time PCR analysis
A. thaliana tissues were collected and ground in liquid nitrogen to extract the RNA, according to the manufacturer's instructions (RNAiso™ Reagent, TaKaRa, Dalian, China). Reverse transcription (RT) was carried out using a reverse transcriptase kit (Toyobo, Tokyo, Japan); real-time PCR was performed with an Eppendorf MasterCycler® ep RealPlex4 (Wesseling-Berzdorf, Germany). Three Fe-SOD genes (FSD1, FSD2, and FSD3), three Cu/ZnSOD genes (CSD1, CSD2, and CSD3), one MnSOD gene (MSD1), one CAT gene (CAT), six ascorbate peroxidase genes (APX1 through 6) and eight glutathione peroxidase (GPX1 through 8) were selected and the primer pairs for each are listed in Table S1. The following PCR protocol was used with two steps: one denaturation step at 95°C for 1 min and 40 cycles of 95°C for 15 s, followed by 60°C for 1 min. Actin 2 was used as a housekeeping gene to normalize the expression profiles.
Enzyme extraction and analysis
To extract antioxidant enzymes, A. thaliana plantlets were ground with 1.5 ml of 20 mM phosphate buffer (pH 7.4) in an ice bath. The homogenate was centrifuged at 10,000 g for 10 min at 4°C to obtain the supernatant used for assaying enzyme activities and MDA levels. The activity of SOD, CAT, and the level of MDA were determined as described previously [63]. APX enzyme was extracted and measured according to the method of Sun et al [64]. One unit of APX was defined as the amount of enzyme oxidizing one nmol of ascorbate per min. GPX activity was measured according to the GPX kit (Jiancheng Biotech., NanJing, China).
Data analysis
Data are presented as mean ± standard error of the mean (SEM) and tested for statistical significance using the analysis of variance, which was performed with the StatView 5.0 program. Values were considered significantly different when the probability (p) was less than 0.05 or 0.01.
Supporting Information
Plants harvested at the end of the light and dark periods were stained for the presence of starch with iodine after 8 to 28 days of IM exposure.
(TIF)
The effect of IM enantiomers on the gene expression of DSP4 in A. thaliana after 4 weeks of exposure. ** represents a statistically significant difference when compared to that of the control (p<0.01). # represents a statistically significant difference when compared to S-IM-exposed plants (p<0.05).
(TIF)
The effect of IM enantiomers on the gene expression of AtGLR 1.1, GS and GS2 in A. thaliana after 4 weeks of exposure. Different letter represents a statistically significant difference between them (p<0.05).
(TIF)
The sequences of primer pairs used in real-time PCR.
(PDF)
Acknowledgments
We thank Professor Jirong Wang (Chinese Academy of Sciences) for the gift of Arabidopsis thaliana seeds and valuable advice on experimental design.
Footnotes
Competing Interests: The authors have declared that no competing interests exist.
Funding: This work was financially supported by the National Basic Research Program of China (No. 2010CB126100) and the Natural Science Foundation of China (21077093). These funders provided financial support to the experiments and research related to this report. The funders had no role in study design, data collection and analysis, decision to publish, or preparation of the manuscript.
References
- 1.Zhou Y, Li L, Lin KD, Zhu XP, Liu WP. Enantiomer separation of triazole fungicides by high-performance liquid chromatography. Chirality. 2009;21:421–427. doi: 10.1002/chir.20607. [DOI] [PubMed] [Google Scholar]
- 2.Falconer RL, Bidleman TF, Szeto SY. Chiral pesticides in soils of the Fraser Valley, British Columbia. J Agr Food Chem. 1997;45:1946–1951. [Google Scholar]
- 3.Kurt-Karakus PB, Bidleman TF, Jones KC. Chiral organochlorine pesticide signatures in global background soils. Environ Sci Technol. 2005;39:8671–8677. doi: 10.1021/es051004c. [DOI] [PubMed] [Google Scholar]
- 4.Qian H, Hu H, Mao Y, Ma J, Zhang A, et al. Enantioselective phytotoxicity of the herbicide imazethapyr in rice. Chemosphere. 2009;76:885–892. doi: 10.1016/j.chemosphere.2009.05.009. [DOI] [PubMed] [Google Scholar]
- 5.Wang LM, Ye WH, Zhou SS, Lin KD, Zhao MR, et al. Acute and chronic toxicity of organophosphate monocrotophos to Daphnia magna. J Environ Sci Heal B. 2009;44:38–43. doi: 10.1080/03601230802519611. [DOI] [PubMed] [Google Scholar]
- 6.Xu C, Zhao MR, Liu WP, Wang JJ, Chen SW, et al. Enantioselective separation and zebrafish embryo toxicity of insecticide acetofenate. Chem Res Toxicol. 2008;47:4236–4242. doi: 10.1021/tx8000016. [DOI] [PubMed] [Google Scholar]
- 7.Miyashita M, Shimada T, Nakagami S, Kurihara N, Miyagawa H, et al. Enantioselective recognition of mono-demethylated methoxychlor metabolites by the estrogen receptor. Chemosphere. 2004;54:1273–1276. doi: 10.1016/j.chemosphere.2003.10.035. [DOI] [PubMed] [Google Scholar]
- 8.Hoekstra PF, Burnison BK, Garrison AW, Neheli T, Muir DC. Estrogenic activity of dicofol with the human estrogen receptor: isomer- and enantiomer specific implications. Chemosphere. 2006;64:174–177. doi: 10.1016/j.chemosphere.2005.10.043. [DOI] [PubMed] [Google Scholar]
- 9.Jin YX, Chen RJ, Sun LW, Wang WY, Zhou L, et al. Enantioselective induction of estrogen-responsive gene expression by permethrin enantiomers in embryo-larval zebrafish. Chemosphere. 2009;74:1238–1244. doi: 10.1016/j.chemosphere.2008.11.015. [DOI] [PubMed] [Google Scholar]
- 10.Battaglin WA, Furlong ET, Burkhardt MR, Peter CJ. Occurrence of sulfonylurea, sulfonamide, imidazolinone, and other herbicides in rivers, reservoirs and ground water in the Midwestern United States, 1998. Sci Total Environ. 2000;248:123–133. doi: 10.1016/s0048-9697(99)00536-7. [DOI] [PubMed] [Google Scholar]
- 11.Duggleby RG, Pang SS. Acetohydroxyacid synthase. J Biochem Mol Biol. 2000;33:1–36. [Google Scholar]
- 12.Lin K, Xu C, Zhou S, Liu W, Gan J. Enantiomeric separation of imidazolinone herbicides using chiral high-performance liquid chromatography. Chirality. 2007;19:171–178. doi: 10.1002/chir.20359. [DOI] [PubMed] [Google Scholar]
- 13.Zhou Q, Xu C, Zhang Y, Liu W. Enantioselectivity in the phytotoxicity of herbicide imazethapyr. J Agr Food Chem. 2009;57:1624–1631. doi: 10.1021/jf803673e. [DOI] [PubMed] [Google Scholar]
- 14.Zhou Q, Zhang N, Zhang C, Huang L, Niu Y, et al. Molecular mechanism of enantioselective inhibition of acetolactate synthase by imazethapyr enantiomers. J Agr Food Chem. 2010;58:4202–4206. doi: 10.1021/jf9038953. [DOI] [PubMed] [Google Scholar]
- 15.Prasad TK, Anderson MD, Martin BA, Stewart CR. Evidence for chilling-induced oxidative stress in maize seedlings and a regulatory role for hydrogen peroxide. Plant Cell. 1994;6:65–74. doi: 10.1105/tpc.6.1.65. [DOI] [PMC free article] [PubMed] [Google Scholar]
- 16.Foyer CH, Lopez-Delgado H, Dat JF, Scott IM. Hydrogen peroxide and glutathione-associated mechanisms of acclimatory stress tolerance and signaling. Physiol Plantarum. 1997;100:241–254. [Google Scholar]
- 17.Dat JF, Lopez-Delgado H, Foyer CH, Scott IM. Parallel changes in H2O2 and catalase during thermotolerance induced by salicylic acid or heat acclimation in mustard seedlings. Plant Physiol. 1998;116:1351–1357. doi: 10.1104/pp.116.4.1351. [DOI] [PMC free article] [PubMed] [Google Scholar]
- 18.A-H-Mackerness S, Surplus SL, Blake P, John CF, Buchanan-Wollaston V, et al. Ultraviolet-B induced stress and changes in gene expression in Arabidopsis thaliana: role of signaling pathways controlled by jasmonic acid, ethylene and reactive oxygen species. Plant Cell Environ. 1999;22:1413–1423. [Google Scholar]
- 19.Langebartels C, Schraudner M, Heller W, Ernst D, Sandermann H. Oxidative stress and defense reactions in plants exposed to air pollutants and UV-B radiation. In: Inze D, Montagu MV, editors. Oxidative Stress in Plants. London: Harwood Academic Publishers; 2000. pp. 105–135. [Google Scholar]
- 20.Karpinski S, Reynolds H, Karpinska B, Wingsle G, Creissen G, et al. Systemic signaling and acclimation in response to excess excitation energy in Arabidopsis. Science. 1999;284:654–657. doi: 10.1126/science.284.5414.654. [DOI] [PubMed] [Google Scholar]
- 21.Geoffroy L, Frankart C, Eullaffroy P. Comparison of different physiological parameter responses in Lemna minor and Scenedesmus obliquus exposed to herbicide flumioxazin. Environ Pollut. 2004;131:233–241. doi: 10.1016/j.envpol.2004.02.021. [DOI] [PubMed] [Google Scholar]
- 22.Qian H, Chen W, Sun L, Jin Y, Liu W, et al. Inhibitory effects of paraquat on photosynthesis and the response to oxidative stress in Chlorella vulgaris. Ecotoxicology. 2009;18:537–543. doi: 10.1007/s10646-009-0311-8. [DOI] [PubMed] [Google Scholar]
- 23.Ramel F, Sulmon C, Bogard M, Couée I, Gouesbet G. Differential patterns of reactive oxygen species and antioxidative mechanisms during atrazine injury and sucrose-induced tolerance in Arabidopsis thaliana plantlets. BMC Plant Biol. 2009;9:28–45. doi: 10.1186/1471-2229-9-28. [DOI] [PMC free article] [PubMed] [Google Scholar]
- 24.Halliwell B. Reactive species and antioxidants. Redox biology is a fundamental theme of aerobic life. Plant Physiol. 2006;141:312–322. doi: 10.1104/pp.106.077073. [DOI] [PMC free article] [PubMed] [Google Scholar]
- 25.Halliwell B, Gutteridge JMC. Free radicals in biology and medicine. Oxford, UK: Clarendon Press; 2006. [Google Scholar]
- 26.Takahashi M, Asada K. Superoxide production in aprotic interior of chloroplast thylakoids. Arch Biochem Biophys. 1988;267:714–722. doi: 10.1016/0003-9861(88)90080-x. [DOI] [PubMed] [Google Scholar]
- 27.Mittler R. Oxidative stress, antioxidants and stress tolerance. Trends Plant Sci. 2002;7:405–410. doi: 10.1016/s1360-1385(02)02312-9. [DOI] [PubMed] [Google Scholar]
- 28.Apel K, Hirt H. Reactive oxygen species: metabolism, oxidative stress, and signal transduction. Annu Rev Plant Biol. 2004;55:373–399. doi: 10.1146/annurev.arplant.55.031903.141701. [DOI] [PubMed] [Google Scholar]
- 29.Nozue K, Maloof J. Diurnal regulation of plant growth. Plant Cell Environ. 2006;29:396–408. doi: 10.1111/j.1365-3040.2005.01489.x. [DOI] [PubMed] [Google Scholar]
- 30.Smith AM, Stitt M. Coordination of carbon supply and plant growth. Plant Cell Environ. 2007;30:1126–1149. doi: 10.1111/j.1365-3040.2007.01708.x. [DOI] [PubMed] [Google Scholar]
- 31.Hare P, Cress W. Metabolic implications of stress induced proline accumulation in plants. J Plant Growth Regul. 1997;21:79–102. [Google Scholar]
- 32.Parre E, Ghars MA, Leprince AS, Thiery L, Lefebvre D, Bordenave M, Richard L, Mazars C, Abdelly C, Savouré A. Calcium signaling via phospholipase C is essential for proline accumulation upon ionic but not nonionic hyperosmotic stresses in Arabidopsis. Plant Physiol. 2007;144:503–512. doi: 10.1104/pp.106.095281. [DOI] [PMC free article] [PubMed] [Google Scholar]
- 33.Chia T, Thorneycroft D, Chapple A, Messerli G, Chen J, Zeeman SC, Smith SM, Smith AM. A cytosolic glucosyltransferase is required for conversion of starch to sucrose in Arabidopsis leaves at night. Plant J. 2004;37:853–863. doi: 10.1111/j.1365-313x.2003.02012.x. [DOI] [PubMed] [Google Scholar]
- 34.Comparot-Moss S, Kötting O, Stettler M, Edner C, Graf A, Weise SE, Streb S, Lue WL, MacLean D, Mahlow S, Ritte G, Steup M, Chen J, Zeeman SC, Smith AM. A Putative Phosphatase, LSF1, is required for normal starch turnover in Arabidopsis leaves. Plant Physiol. 2010;152:685–697. doi: 10.1104/pp.109.148981. [DOI] [PMC free article] [PubMed] [Google Scholar]
- 35.Milla MAR, Maurer A, Huete AR, Gustafson JP. Glutathione peroxidase genes in Arbidopsis are ubiquitous and regulated by abiotic stresses through diverse signaling pathways. Plant J. 2003;36:602–615. doi: 10.1046/j.1365-313x.2003.01901.x. [DOI] [PubMed] [Google Scholar]
- 36.Doncheva S, Amenos M, Poschenrieder C, Barceló J. Root cell patterning: a primary target for aluminium toxicity in maize. J Exp Bot. 2005;56:1213–1220. doi: 10.1093/jxb/eri115. [DOI] [PubMed] [Google Scholar]
- 37.Li YZ, Lu HF, Fan XW, Sun CB, Qing DJ, et al. Physiological responses and comparative transcriptional profiling of maize roots and leaves under imposition and removal of aluminium toxicity. Environ Exp Bot. 2010;69:158–166. [Google Scholar]
- 38.Fujita M, Fujita Y, Noutoshi Y, Takahashi F, Narusaka Y, et al. Crosstalk between abiotic and biotic stress responses: a current view from the points of convergence in the stress signaling networks. Curr Opin Plant Biol. 2006;9:436–442. doi: 10.1016/j.pbi.2006.05.014. [DOI] [PubMed] [Google Scholar]
- 39.Mittler R, Vanderauwera S, Gollery M, Van Breusegem F. Reactive oxygen gene network of plants. Trends Plant Sci. 2004;9:490–498. doi: 10.1016/j.tplants.2004.08.009. [DOI] [PubMed] [Google Scholar]
- 40.Liu Y, Ren D, Pike S, Pallardy S, Gassmann W, et al. Chloroplast-generated reactive oxygen species are involved in hypersensitive response-like cell death mediated by a mitogen-activated protein kinase cascade. Plant J. 2007;51:941–954. doi: 10.1111/j.1365-313X.2007.03191.x. [DOI] [PubMed] [Google Scholar]
- 41.Rubio MC, Bustos-Sanmamed P, Clemente MR, Becana M. Effects of salt stress on the expression of antioxidant genes and proteins in the model legume Lotus japonicus. New Phytol. 2009;181:851–859. doi: 10.1111/j.1469-8137.2008.02718.x. [DOI] [PubMed] [Google Scholar]
- 42.Miura E, Kato Y, Sakamoto W. Comparative transcriptome analysis of green/white variegated sectors in Arabidopsis yellow variegated2: responses to oxidative and other stresses in white sectors. J Exp Bot. 2010;61:2433–2445. doi: 10.1093/jxb/erq075. [DOI] [PMC free article] [PubMed] [Google Scholar]
- 43.McCourt JA, Pang SS, King-Scott J, Guddat LW, Duggleby RG. Herbicide-binding sites revealed in the structure of plant acetohydroxyacid synthase. P Natl Acad Sci. 2005;103:569–573. doi: 10.1073/pnas.0508701103. [DOI] [PMC free article] [PubMed] [Google Scholar]
- 44.Gaston S, Zabalza A, González EM, Arrese-Igor C, Aparicio-Tejo PM, et al. Imazethapyr, an inhibitor of the branched-chain amino acid biosynthesis, induces aerobic fermentation in pea plants. Physiol Plantarum. 2002;114:524–532. doi: 10.1034/j.1399-3054.2002.1140404.x. [DOI] [PubMed] [Google Scholar]
- 45.Pang SS, Guddat LW, Duggleby RG. Molecular basis of sulfonylurea herbicide inhibition of acetohydroxyacid synthase. J Biol Chem. 2003;278:7639–7644. doi: 10.1074/jbc.M211648200. [DOI] [PubMed] [Google Scholar]
- 46.Zeeman SC, Ree T. Changes in carbohydrate metabolism and assimilate export in starch-excess mutants of Arabidopsis. Plant Cell Environ. 1999;22:1445–1453. [Google Scholar]
- 47.Stettler M, Eicke S, Mettler T, Messerli G, Hörtensteiner S, et al. Blocking the metabolism of starch breakdown products in Arabidopsis leaves triggers chloroplast degradation. Mol Plant. 2009;2:1233–1246. doi: 10.1093/mp/ssp093. [DOI] [PMC free article] [PubMed] [Google Scholar]
- 48.Royuela M, González A, González EM, Arrese-Igor C, Aparicio-Tejo PM, et al. Physiological consequences of continuous, sublethal imazethapyr supply to pea plants. J Plant Physiol. 2000;157:345–354. [Google Scholar]
- 49.Scarponi L, Martinetti L, Alla MMN. Growth response and changes in starch formation as a result of imazethapyr treatment of soybean (Glycine max L). J Agr Food Chem. 1996;44:1572–1577. [Google Scholar]
- 50.Lu Y, Gehan JP, Sharkey TD. Daylength and circadian effects on starch degradation and maltose metabolism. Plant Physiol. 2005;138:2280–2291. doi: 10.1104/pp.105.061903. [DOI] [PMC free article] [PubMed] [Google Scholar]
- 51.Zeeman SC, Delatte T, Messerli G, Umhang M, Stettler M, et al. Starch breakdown: recent discoveries suggest distinct pathways and novel mechanisms. Functional Plant Biol. 2007;34:465–473. doi: 10.1071/FP06313. [DOI] [PubMed] [Google Scholar]
- 52.Sokolov LN, Dominguez-Solis JR, Allary AL, Buchanan BB, Luan S. A redox-regulated chloroplast protein phosphatase binds to starch diurnally and functions in its accumulation. P Natl Acad Sci. 2006;103:9732–9737. doi: 10.1073/pnas.0603329103. [DOI] [PMC free article] [PubMed] [Google Scholar]
- 53.Rolland F, Baena-Gonzalez E, Sheen J. Sugar sensing and signaling in plants: conserved and novel mechanisms. Annu Rev Plant Biol. 2006;57:675–709. doi: 10.1146/annurev.arplant.57.032905.105441. [DOI] [PubMed] [Google Scholar]
- 54.To JPC, Reiter WD, Gibson SI. Chloroplast biogenesis by Arabidopsis seedlings is impaired in the presence of exogenous glucose. Physiol Plantarum. 2003;118:456–463. [Google Scholar]
- 55.Kang J, Turano FJ. The putative glutamate receptor 1.1 (AtGLR1.1) functions as a regulator of carbon and nitrogen metabolism in Arabidopsis thaliana. P Natl Acad Sci. 2003;100:6872–6877. doi: 10.1073/pnas.1030961100. [DOI] [PMC free article] [PubMed] [Google Scholar]
- 56.Forde BG, Lea PJ. Glutamate in plants: metabolism, regulation, and signaling. J Exp Bot. 2007;58:2339–2358. doi: 10.1093/jxb/erm121. [DOI] [PubMed] [Google Scholar]
- 57.Laplante J, Rajcan I, Tardif FJ. Multiple allelic forms of acetohydroxyacid synthase are responsible for herbicide resistance in Setaria viridis. Theor Appl Genet. 2009;119:577–585. doi: 10.1007/s00122-009-1067-5. [DOI] [PubMed] [Google Scholar]
- 58.Rao MV, Davis KR. Ozone-induced cell death occurs via two distinct mechanisms in Arabidopsis: the role of salicylic acid. Plant J. 1999;17:603–614. doi: 10.1046/j.1365-313x.1999.00400.x. [DOI] [PubMed] [Google Scholar]
- 59.Myouga F, Hosoda C, Umezawa T, Iizumi H, Kuromori T, et al. A heterocomplex of iron superoxide dismutases defends chloroplast nucleoids against oxidative stress and is essential for chloroplast development in Arabidopsis. Plant Cell. 2008;20:3148–3162. doi: 10.1105/tpc.108.061341. [DOI] [PMC free article] [PubMed] [Google Scholar]
- 60.Thordal-Christensen H, Zhang ZG, Wei YD, Collinge DB. Subcellular localization of H2O2 in plants. H2O2 accumulation in papillae and hypersensitive response during the barley-powdery mildew interaction. Plant J. 1997;11:1187–1194. [Google Scholar]
- 61.Qian H, Chen W, Sheng GD, Xu X, Liu W, et al. Effects of glufosinate on antioxidant enzymes, subcellular structure, and gene expression in the unicellular green alga Chlorella vulgaris. Aquat Toxicol. 2008;88:301–307. doi: 10.1016/j.aquatox.2008.05.009. [DOI] [PubMed] [Google Scholar]
- 62.Smith AM, Zeeman SC. Quantification of starch in plant tissues. Nat Protoc. 2006;1:1342–1345. doi: 10.1038/nprot.2006.232. [DOI] [PubMed] [Google Scholar]
- 63.Qian H, Sheng DG, Liu W, Lu Y, Liu Z, et al. Inhibitory effects of atrazine on Chlorella vulgaris as assessed by real-time polymerase chain reaction. Environ Toxicol Chem. 2008;27:182–187. doi: 10.1897/07-163.1. [DOI] [PubMed] [Google Scholar]
- 64.Sun Y, Jiang LC, Lai ZX, Shao W, Wang XY. Determination and observation of the changes of the ascorbate peroxidase activities in the fresh leaves of tea plants. Chinese Tropical Crops. 2008;29:562–566 (In Chinese). [Google Scholar]
Associated Data
This section collects any data citations, data availability statements, or supplementary materials included in this article.
Supplementary Materials
Plants harvested at the end of the light and dark periods were stained for the presence of starch with iodine after 8 to 28 days of IM exposure.
(TIF)
The effect of IM enantiomers on the gene expression of DSP4 in A. thaliana after 4 weeks of exposure. ** represents a statistically significant difference when compared to that of the control (p<0.01). # represents a statistically significant difference when compared to S-IM-exposed plants (p<0.05).
(TIF)
The effect of IM enantiomers on the gene expression of AtGLR 1.1, GS and GS2 in A. thaliana after 4 weeks of exposure. Different letter represents a statistically significant difference between them (p<0.05).
(TIF)
The sequences of primer pairs used in real-time PCR.
(PDF)


