

Abstract
While previous studies have described CD25 expression on mature dendritic cells (mDCs) and their production of IL-2, it remains unclear how these molecules participate in the activation of T cells. In search of the mechanisms by which daclizumab, a humanized monoclonal antibody against CD25, inhibits brain inflammation in multiple sclerosis (MS), we observed that while the drug has limited effect on polyclonal T cell activation, it potently inhibits activation of antigen (Ag)-specific T cells by mDCs. We demonstrate that in an Ag-specific manner, mDCs (and Ag-experienced T cells) secrete IL-2 to the mDC-T cell interface and mDCs “lend” their CD25 to primed T cells in trans, in order to facilitate early high affinity IL-2 signaling, which is critical for subsequent T cell expansion and development of Ag-specific effectors. Our data reveal a novel mechanism for the IL-2 receptor system in DC-mediated activation of T cells.
Introduction
Daclizumab, a humanized monoclonal antibody (Ab) against the α-chain of the IL-2 receptor (CD25) promotes tolerance in solid organ transplantation1, inflammatory uveitis2 and MS3–5. This is surprising in view of the fact that genetic deletion of CD25 leads to autoimmunity6–9. We now understand that IL-2 not only promotes T cell expansion10, but also plays a crucial role in the development of FoxP3+ T-regs11 and in the contraction of T cell responses12. Clearly, the latter mechanisms predominate in genetic defects of CD25. However, daclizumab therapy also diminishes T-reg numbers13,14, indicating that other mechanisms must counteract the development of lymphoproliferation in daclizumab-treated individuals. Indeed, we have reported that daclizumab expands CD56bright NK cells, which contribute to the termination of immune responses by killing activated T cells15. We observed a strong correlation between CD56bright NK cell expansion in daclizumab treated patients and their inhibition of brain inflammation15, suggesting that this expansion is linked to the therapeutic efficacy of daclizumab. However, we recently encountered an MS patient in whom daclizumab inhibited brain inflammation without concomitantly expanding CD56bright NK cells. This prompted us to search for an alternative mechanism of inhibition of T cell-mediated inflammation by daclizumab.
The IL-2 receptor (IL-2R) consists of three chains: two signaling chains: β-(CD122) and common γ-chain (γc; CD132), which together form an intermediate affinity IL-2R shared for signaling with IL-2 and IL-15, and the non-signaling α-chain. Despite the fact that CD25 has very low affinity for IL-2 (Kd ~ 10 nM), the quaternary IL-2R complex structure predicts that initial binding of CD25 to IL-2 stabilizes a secondary binding site for presentation to IL-2Rβ, which then recruits γc, thus forming a high affinity IL-2R (Kd ~ 10 pM)16. The association of β- and γc-chains induces signal transduction through the heterodimerization of their cytoplasmic domains leading to activation of Janus family tyrosine kinases Jak1 and Jak3, and subsequent phosphorylation of Stat5 transcription factors17.
Both IL-2 and CD25 are linked to immune activation: CD25 is sparsely expressed on resting immune cells (with exception of FoxP3+ T-regs), but is readily up-regulated on all T cells by both T cell receptor (TCR) and IL-2 mediated signaling18, as well as on macrophages and myeloid DCs upon activation with pathogen associated molecular patterns (PAMPs)19. While the main producers of IL-2 are activated T cells, IL-2 production has been described in mDCs19,20, although its functional consequences remained undefined. Because CD25 expression on mDCs has been linked to their stimulatory capacity21, we decided to study the effect of daclizumab on mDC-mediated T cell activation.
Results
Daclizumab inhibits T cell activation by mDCs
We incubated resting T cells with Ag-loaded myeloid mDCs in the presence of physiologically achievable doses of daclizumab (10 μg ml−1) or control anti-CD25 Ab, MA-251, which does not block the IL-2-binding (Tac) epitope. After 7–10 days we evaluated T cell proliferation (Fig. 1). We tested T cell responses to influenza hemagglutinin (Flu-HA; Fig. 1a) as a prototypic foreign Ag and to a pool of human brain proteins (HBP; Fig. 1b) as a prototypic self Ag.
Figure 1. Ag-specific T cell proliferation in DC-T cell co-cultures is profoundly inhibited by daclizumab.
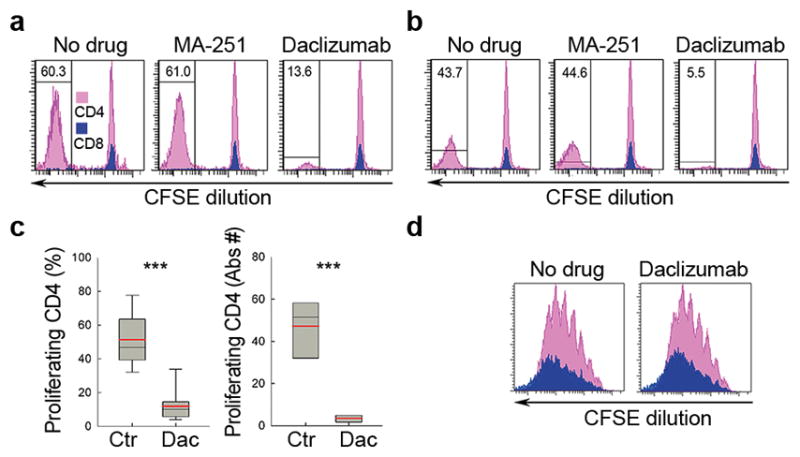
(a) CFSE (Carboxyfluorescein diacetate succinimidyl diester) proliferation assay: mDCs loaded with FluHA (0.5μg ml−1) or (b) human brain protein (HBP; 10μg ml−1) were co-cultured with autologous CFSE-stained T cells in the presence or absence of CD25 blocking-Ab control MA-251 (10μg ml−1), or daclizumab (Dac; 10μg ml−1). After 7–10 days, T cell proliferation was assessed by CFSE dilution assay after gating on CD4+ (pink) and CD8+ T cells (blue). Data are representative of five independent experiments. (c) Box plots represent group data on Ag-specific CD4+ T cell proliferation with marked group medians (black horizontal line) and means (red horizontal line). ***P < 0.001. Mean values are shown ± SD. (d) CFSE proliferation assay after polyclonal T cell activation with CD3/CD28 Dynabeads (0.3 : 1 bead to T cell ratio) in the presence or absence of daclizumab. Proliferation was measured by CFSE dilution after 5 d using the same gating strategy (i.e. CD4+ T cells in pink, CD8+ T cells in blue).
While MA-251 had no inhibitory effect on T cell proliferation, daclizumab decreased the proportion of proliferating T cells by 78–88%, irrespective of the Ag studied (Fig. 1c). As Flu-HA-specific T cells produced higher levels of cytokines than HBP-specific T cells (data not shown) we used Flu-HA for all subsequent experiments. As a control, we reproduced our published observations15 that the same concentration of daclizumab inhibits polyclonally activated T cells only minimally (Fig. 1d).
Selective blockade of CD25 on DCs abrogates T cell expansion
Next we asked whether daclizumab exerts its inhibitory effect on T cells or mDCs. Thus, we selectively pre-incubated either mDCs or T cells with daclizumab and washed away excess mAb before assembling mDC-T cell co-cultures. The selective blockade of CD25 on mDCs effectively inhibited T cell proliferation (Fig. 2a) resulting in lower accumulation of Ag-specific T cells (Fig. 2b). To a lesser extent, blockade of CD25 on T cells also inhibited early T cell proliferation (day five to nine). However, in late stages of T cell proliferation, selective blockade of CD25 on T cells also inhibited the death of activated T cells, resulting in restored, or even greater accumulation of Ag-specific T cells at day 14 of T-mDC co-cultures (Fig. 2).
Figure 2. Selective blockade of CD25 on mDCs is sufficient to abrogate T cell proliferation.
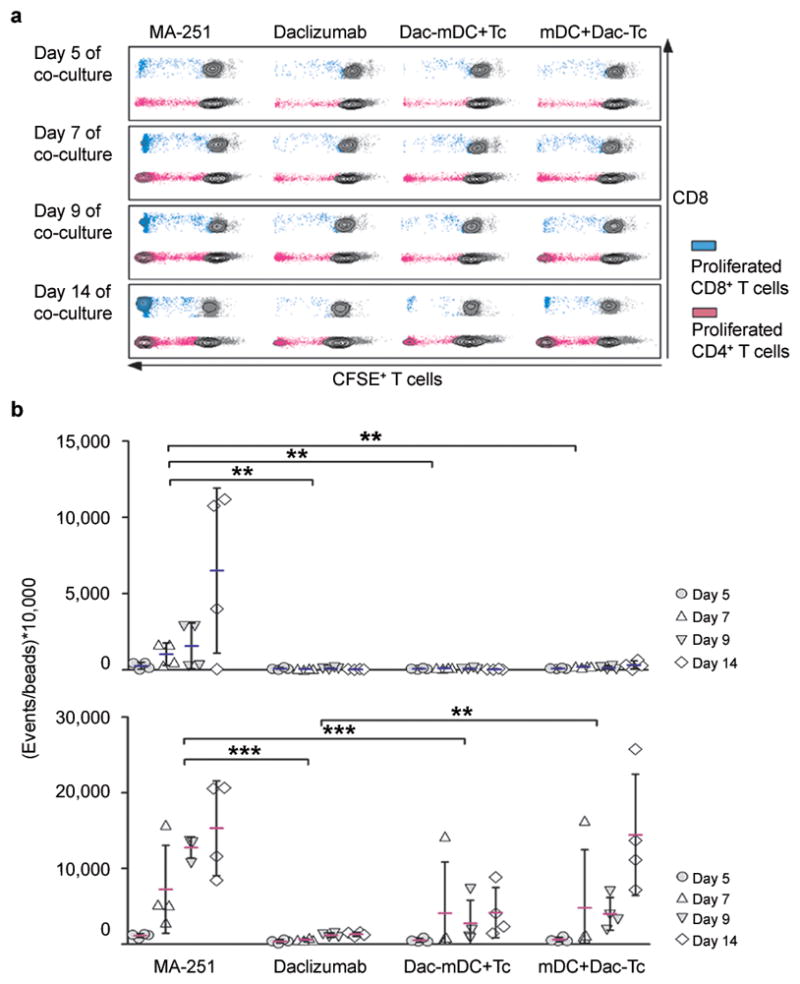
(a) CFSE stained T cells and mDCs were co-cultured in the presence of 20 μg ml−1 control antibody MA-251 (first column) or 20 μg ml−1 daclizumab (Dac; second column) added at the beginning of culture period. Alternatively, mDCs (third column) or CFSE+ T cells (fourth column) were pre-treated with 20 μg ml−1 daclizumab for 30 min before setting up co-cultures. T cell proliferation was analyzed after five, seven, nine and, fourteen days of co-culture (first to fourth row). (b) Events of proliferated CD8+ T cells (upper panel) and CD4+ T cells (lower panel) were normalized to beads and are depicted in separate graphs. n = 4; **P < 0.01, ***P < 0.001. Mean values are shown ± SD.
CD25− T cells proliferate if primed by CD25+ mDCs
In the previous experiment we observed that CD25 blockade on T cells only partially inhibits Ag-driven proliferation. However, pre-treatment of T cells with daclizumab does not block de novo synthesis of CD25 after T cell activation. Therefore, we blocked post-activation induced CD25 expression on T cells by siRNA. Inhibition of CD25 expression on T cells (by 56–95%) 24 h post-stimulation (Supplementary Fig. 1a) caused only mild (2–30%), but reproducible inhibition of T cell proliferation (Supplementary Fig. 1b). However, inhibition of CD25 expression on T cells also paradoxically increased the absolute number of cytokine producing effectors (Supplementary Figs. 1c, d), confirming the role of high affinity IL-2 signaling in post-activation T cell death.
To unambiguously determine whether CD25 expression on T cells is dispensable for their activation, we performed experiments on T cells derived from a rare individual with a genetic deletion of CD25 (Fig. 3a). Because the sample (obtained before this sick child underwent bone marrow transplantation) was too limited to establish DC cultures, we used mDCs derived from a MHC-matched healthy donor (HD). CD25− T cells readily proliferated (Fig. 3b) and developed cytokine producing effectors to three different Ags (Keyhole limpet hemocyanin (KLH), Copaxone© and Flu-HA; Flu-HA-specific T cells are displayed; Fig. 3c) as long as mDCs expressed CD25. Pre-treatment of mDCs with daclizumab before co-culture with CD25− T cells caused more than 90% inhibition of T cell expansion, resulting in an almost complete lack of cytokine producing effectors (Fig. 3b, c, lower panels).
Figure 3. T cells do not need CD25 expression to enter proliferation cycle if primed by CD25+ mDCs.

(a)
T cells derived from healthy donors were polyclonally activated and stained several times during the proliferation cycle for expression of CD25, CD122, and CD132 (open histograms) or the appropriate isotype controls (gray histograms) and served as positive control (left three histograms). T cells from an individual with genetic deletion of CD25 were activated and stained in parallel (right three histograms). Percentages are shown above the histograms. (b) Proliferation of CD25− CD4+ (pink; left panels) and CD8+ (blue; right panels) T cells derived from an individual with a genetic deletion of CD25 following co-incubation with Flu-HA-loaded HLA-matched CD25+ mDCs was measured by CFSE dilution after 7 d. Proliferation was inhibited when mDCs were treated with daclizumab prior to co-incubation (lower panels). Separate graphs (right panels) depict percentages and absolute numbers of CD4+ and CD8+ T cells from four replicas; *P < 0.05. Mean values are shown ± SD. (c) Cytokine production (IL-2, IFN-γ and IL-17) by proliferating CD25− CD4+ and CD8+ T cells following co-culture with CD25+ mDCs (upper panels) or mDCs pre-treated with daclizumab (lower panels).
Fab domain mediates inhibitory effect of daclizumab
To exclude the possibility that daclizumab binds mDCs via Fc receptors and then inhibits CD25 on primed T cells via Ag-binding domain (Fab), we used a version of daclizumab that lacks the Fc fragment (Dac-Fab) and demonstrated that it has an equivalent inhibitory effect as whole daclizumab (Supplementary Fig. 2).
DCs lack the IL-2Rβ and therefore do not signal to IL-2
As previous experiments demonstrated that the inhibitory effect of daclizumab on proliferation of T cells resided in its ability to block CD25 on mDCs, we investigated if mDCs themselves receive IL-2 signal. Indeed, an independent group reported that human DCs may express high affinity IL-2R and that daclizumab inhibits mDC function22–24. Thus we investigated the expression of IL-2R chains in myeloid DCs. Whether we analyzed BDCA-1+ DCs isolated from fresh human blood/apheresis samples (Fig. 4a) or monocyte-derived DCs (Fig. 4b) in their immature (upper row) or mature stage (lower row), we observed no expression of CD122 on protein or mRNA level (Supplementary Fig. 3a). Consequently, we observed no IL-2 induced Stat5 phosphorylation (Fig. 4c) in DCs from fresh human blood or in vitro generated immature dendritic cells (iDCs) or mDCs. All DCs at the same time readily phosphorylated Stat5 in response to GM-CSF (Fig. 4d; peak pStat5+ DCs after 10–30min of GM-CSF exposure: 86.9% in DCs present in fresh blood, 80.6% in iDCs and 51.2% in mDCs).
Figure 4. DCs do not express the β-chain of IL-2R and therefore do not signal to IL-2.

(a) Freshly isolated CD1c+ iDCs and mDCs (after 48 h of stimulation) were stained for maturation markers CD80, CD83, and MHC-II (upper panel, open histograms) and for IL-2R chains CD25, CD122, and CD132 (lower panel, open histograms) or appropriate isotype controls (filled gray histograms). Percentages of surface marker expression are depicted above the histograms. (b) In vitro generated monocyte-derived iDCs and mDCs were stained in an analogous manner. (c) IL-2 signaling and (d) GM-CSF signaling of fresh un-coagulated whole blood (ex vivo; left panels), monocyte-derived iDCs (middle panels) and mDCs (right panels) is shown. Cells were pulsed for 10 and 30 min with 50 IU ml−1 of IL-2 or 200 ng ml−1 of GM-CSF. Black filled histograms represent 0 min, open histograms 10 min and filled gray histograms 30 min after cytokine stimulation. Proportion of pStat5+ DCs after stimulation with IL-2 ranged in all conditions between 0.2%–1.5%. In contrast, proportion of pStat5+ DCs after 10 and 30 min stimulation with GM-CSF reached 86.9% and 56.3% in fresh blood, 52.9% and 80.6% in iDCs, and 51.2% and 32.3% in mDCs.
Even though we observed no Stat5 phosphorylation by DCs, we considered the possibility that IL-2 provides a maturation signal to DCs using pathways besides Stat5 phosphorylation. However, we observed no effect of daclizumab, IL-2 or IL-2 in the presence of Abs against different chains of the IL-2R on DC maturation (Supplementary Fig. 3b). Finally, we considered that previously reported effects of daclizumab on DCs22–24 were due to the formation of immune complexes (ICs) of daclizumab and CD25 expressed on the surface of few contaminating T cells, as ICs can inhibit stimulatory capacity of DCs25. Indeed, we observed that when added to maturation stimulus, ICs significantly inhibited DC maturation and CD25 expression (Supplementary Fig. 3b).
mDCs use their CD25 to trans-present IL-2 to CD25− T cells
Because we observed no direct effect of IL-2 or daclizumab on DC phenotype, we considered that analogous to trans-presentation of IL-1526, a mDC uses its own CD25 to complement the T cell expression of β- and γc-chains to facilitate assembly of the high affinity IL-2R on T cells in trans.
To test this hypothesis, we first analyzed the time course of CD25 and IL-2 expression on polyclonally activated T cells. A small proportion of (memory) T cells produced IL-2 within the first hours post-activation (Supplementary Fig. 4). However, these IL-2-producing T cells remained conspicuously CD25 negative for at least the first 10 h post-activation. All T cells up-regulated CD25 at later time-points (≥24 h); but they also ceased to produce IL-2. This shut-down was IL-2-driven, as addition of IL-2 neutralizing Ab into T cell cultures retained IL-2 secretion (Supplementary Fig. 4; lower panels). T cells activated in the presence of IL-2 resumed IL-2 production 48–72 h post-stimulation, when they started to divide. The lack of CD25 expression on T cells within first 10 h post-activation was supportive of our hypothesis that mDCs provide their CD25 to primed T cells for the formation of a high affinity IL-2R. Thus, we tested the ability of mDCs to complement formation of high-affinity IL-2R on CD25− T cells.
First we evaluated whether CD25+ mDCs could restore Stat5 phosphorylation of daclizumab pre-treated T cells to exogenous IL-2 (Supplementary Fig. 5). In this system we observed only very low (on average 9.86%; non-significant) restoration of IL-2 signaling. In contrast to IL-15Rα, low affinity for IL-2 precludes CD25 from effectively capturing IL-2 under situations when IL-2 can freely diffuse to the surroundings. Thus, we hypothesized that mDCs release IL-2 into the synaptic cleft, facilitating effective capture of IL-2 by mDC-derived CD25 and its trans-presentation to a primed T cell. Because of the low precursor frequency of Ag-specific T cells in blood, we had to switch to Ag-experienced T cells. We selected a long-term CD4+ T cell clone (TCC), P2-1027, specific for MBP(83–99) and several short-term (maximal 14 days from initial Ag-specific stimulation) CD4+ T cell lines (TCL) specific for Flu-HA(306–318), newly generated for each experiment. By including a short term TCL we wanted to assure that no non-physiological bias was introduced by long-term in vitro culture. We used these two Ag-specific systems interchangeably, loading syngeneic mDCs exogenously with cognate or non-cognate peptide and confirmed our findings in both systems.
In the absence of exogenous IL-2, we observed strong Stat5 phosphorylation in T cells, which peaked 2 h after co-culture with syngeneic mDCs loaded with cognate Ag (Fig. 5 and Supplementary Fig. 6a). This Stat5 phosphorylation was significantly inhibited upon pre-treatment of mDCs with daclizumab, whereas pre-treatment of T cells with daclizumab had only a mild, non-significant inhibitory effect (Fig. 5a and Supplementary Fig. 6a). When T cells were co-cultured with identical mDCs, but preloaded with non-cognate Ag, we observed no or only low Stat5 phosphorylation, which was not amenable to inhibition by daclizumab. Importantly, the level of mDC-induced Stat5 phosphorylation in T cells at this early co-culture correlated strongly with the eventual expansion of Ag-specific effectors (Fig. 5b and Supplementary Fig. 6b). When we pooled data from multiple experiments, the correlation coefficient between Stat5 phosphorylation and subsequent T cell expansion was RSpearman = 0.875 with P < 0.0001.
Figure 5. mDCs utilize their surface expression of CD25 to trans-present IL-2 to CD25 T cells.

(a) Flu-HA(306–318)-specific T cells (TCL) were either selectively pre-treated for 30 min with 20μg ml−1 daclizumab (DacT) or control Ab (T) and co-incubated for 1–2 h with autologous, CD25 expressing mDCs pulsed with 1μM cognate (Flu-mDC) or non-cognate (MBP(83–99); MBP-mDC) peptide. At indicated conditions, Flu-mDCs were pre-treated with 20μg ml−1 daclizumab (DacFlu-mDC). At indicated time points cells were fixed and stained for phosphorylated Stat5. Results are displayed as percentages of pStat5 expressing CD4+ T cells ± SD. (b) Using same cells and identical conditions as in (a), this graph demonstrates the proportional number of expanded T cells after 5 d of co-culture. Mean values are shown ± SD. One representative experiment is depicted; all replicas are summarized in Supplementary Fig 6. (c) In an independent experiment, frequency of pStat5+ Flu-HA(306–318)-specific T cells was analyzed after 2 h culture with Flu-HA(306–318)-loaded mDCs (left panel), daclizumab pre-treated Flu-HA(306–318)-loaded mDCs (middle panel) and MBP(83–99) peptide-loaded mDCs (right panel). (d) Using same cells, pStat5 phosphorylation was visualized by Amnis ImageStream in Flu-specific T cells cultured for 2 h with Flu-HA(306–318)-loaded mDCs (first row), daclizumab pre-treated Flu-HA(306–318)-loaded mDCs (second row) or MBP(83–99)-loaded mDCs (third row). CD25 expression on T cells ranged between 22.6–27.7%. The left side of the figure represents cells in the bright field of the microscope; the right side depicts fluorescence images. Scale bars, 10 μm.
In order to visualize formation of the immune synapse (IS) between T cells and mDCs we employed Amnis ImageStream technology, which merges the quantitative capacity of flow cytometry with the visualization faculty of fluorescent microscopy (Fig. 5c, d). In this experiment, we observed minimal Stat5 phosphorylation of T cells cultured in the absence of mDCs (0.17%; data not shown) or cultured with syngeneic mDCs pulsed with non-cognate Ag (1.77%; Fig. 5c, right panel). In contrast, co-culture of T cells with cognate-Ag-pulsed mDCs resulted in 75.1% of pStat5+ single CD4+ T cells (Fig. 5c, left panel) and even greater T cell Stat5 phosphorylation (86.7%) when T cells were fixed in contact with mDCs. As evidenced from representative examples (Fig. 5d), virtually all mDCs in contact with T cells expressed CD25 and polarized it into the IS. Pre-treatment of mDCs with daclizumab resulted in decreased numbers of pStat5+ T cells (34.3%; Fig. 5c, middle panel), which was slightly higher than the proportion of T cells that expressed CD25 in this experiment (22.6–27.7%).
mDCs secrete IL-2 into IS in an Ag-specific manner
As our previous experiment strongly implied that the observed Stat5 phosphorylation was IL-2 driven, we wanted to visualize IL-2 secretion in T-mDC co-cultures. Using an IL-2 secretion assay, where the IL-2 secreted during co-cultures is captured by an IL-2 catch reagent, and later visualized on the surface of the cell that released it, we observed that very few mDCs and T cells secrete IL-2 when they are cultured alone (Fig. 6a, first two panels). When T cells are cultured in the presence of syngeneic mDCs loaded with cognate Ag, strong IL-2 secretion is induced both in mDCs and T cells (Fig. 6a, third panel) within the first 2 h of co-culture. In contrast, co-culture of T cells with mDCs loaded with non-cognate Ag leads to a decrease in IL-2 secretion by mDCs even below baseline levels (Fig. 6a, fourth panel).
Figure 6. mDCs and T cells secrete IL-2 after Ag-specific interactions.
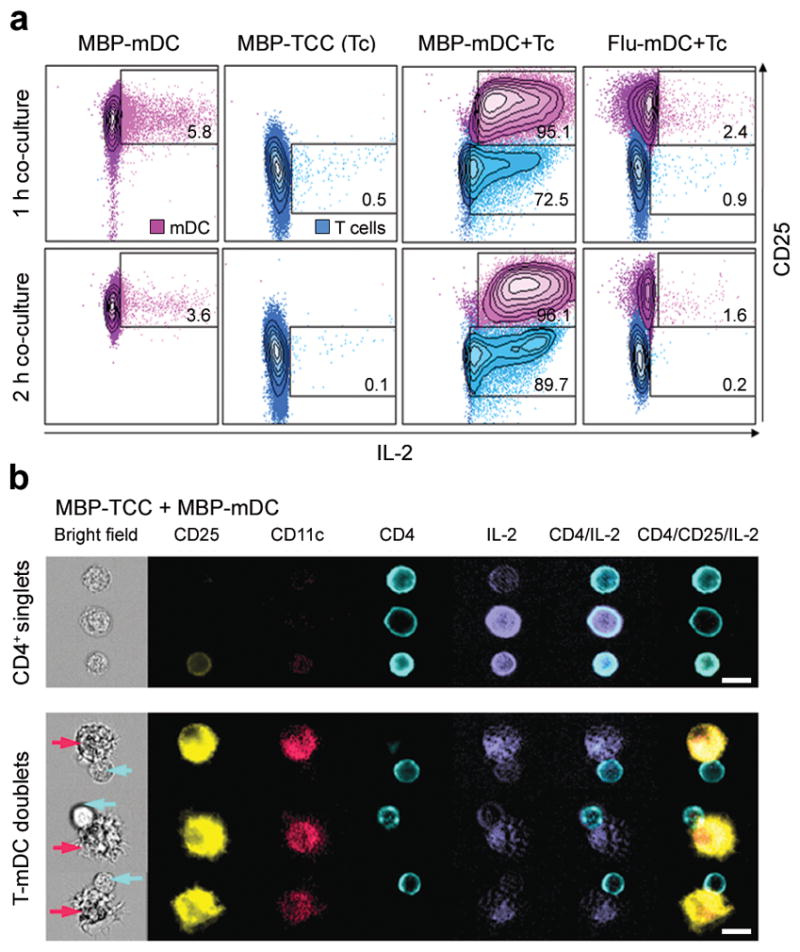
(a) Flow cytometric analysis of IL-2 secretion of mDCs loaded with 1μM MBP(83–99) peptide (MBP-mDC; first column), MBP-specific T cells (MBP-TCC (Tc); second column), co-cultures of MBP-mDCs with MBP-specific T cells (MBP-mDC+Tc; third column) and co-cultures of mDCs loaded with 1μM Flu-HA(306–318) peptide with MBP-specific T cells (Flu-mDC+Tc; fourth column). IL-2 was detected after 1 h (upper panels) and 2 h (lower panels) of co-culture and is plotted against CD25 expression of mDCs and T cells. Percentages of IL-2 secretion by mDCs and T cells are shown in quadrants. For comparison, mDCs and T cells are presented in the same blot, but were gated separately on CD11c and CD4 expression. (b) Independent experiment visualizing secreted IL-2 and surface expression of CD25, CD11c, and CD4 by Amnis ImageStream after 2 h co-culture of MBP-mDCs with MBP-specific T cells. The upper panel of this figure shows single MBP-specific CD4+ T cells in the bright field of the microscope with simultaneous expression/secretion of fluorescently labeled CD25, CD4 and IL-2. The lower panel demonstrates conjugates of MBP-loaded mDCs with MBP-specific T cells (mDCs highlighted by purple arrows, CD4+ T cells by blue arrows). Scale bars, 10 μm.
Visualization of IL-2 secretion by Amnis ImageStream (Fig. 6b) confirmed that either T cells or mDCs can be the source of secreted IL-2 in the Ag-specific system. Furthermore, IL-2 is secreted preferentially into the synaptic cleft, especially by mDCs, as visualized in enlarged images of the IS (Supplementary Fig. 7).
Discussion
While it has been recently discovered that DCs produce IL-2 following microbial stimulation20,28, and the expression of CD25 has been recognized as one of the activation markers on mDCs21,22,29, the relevance of these observations for T cell activation remained unclear30. In agreement with animal data30,31, we observed that human myeloid DCs lack expression of IL-2R β-chain, which is essential for IL-2 signaling18. Consequently, IL-2 failed to phosphorylate Stat5 in DCs and failed to affect DC phenotype. Therefore, we concluded that the CD25 on myeloid mDCs must have a different role than facilitating IL-2 signaling in DCs. Instead, we hypothesized that mDCs use their CD25 for targeted IL-2 delivery to primed T cells. This type of presentation “in trans” was already described for IL-1526, a cytokine closely related to IL-2, which utilizes identical intermediate affinity receptor chains. However, in contrast to the stable interaction of IL-15Rα with IL-1526, CD25 has only low affinity for IL-2. Yet, a biophysical model predicts that IL-2 binding to CD25 initiates the formation of a high affinity IL-2R16. How can CD25 fulfill this critical role under situations of low IL-2 concentration, such as at the initiation of the immune response, when PAMPs-activated mDCs may be the only source of IL-2? We hypothesized that directional secretion of IL-2 into the synaptic cleft would limit diffusion of IL-2 and facilitate its binding to CD25. We observed that CD25+ mDCs could, in principle, facilitate signaling of exogenously added IL-2 to CD25− T cells in trans, but they did so extremely inefficiently in an Ag-nonspecific system. However, we observed strong Stat5 phosphorylation of T cells after co-culture with syngeneic mDCs loaded with cognate Ag in the absence of exogenous IL-2. This Stat5 phosphorylation of CD25− T cells was linked to polarization of mDC-derived CD25 toward a primed T cell and directional secretion of IL-2 into the IS. Furthermore, the Stat5 phosphorylation in Ag-specific T cells was significantly inhibited by selective blockade of CD25 on the surface of mDCs. Stat5 phosphorylation was only slightly increased when T cells were co-cultured with syngeneic CD25+ mDCs loaded with non-cognate Ag, likely due to the fact that we observed no IL-2 secretion in such a setting. When using Ag-experienced T cells we observed that both mDCs and T cells secrete IL-2, although strictly in an Ag-specific manner. However, when we polyclonally activated resting T cells purified from human blood, we observed that only a small proportion of them were capable of secreting IL-2 within first 10 h post-activation and virtually none of those expressed CD25. We believe that this is more reminiscent of the priming of naive T cells: these T cells do not express CD25 and do not secrete IL-2 within the first few hours of Ag-stimulation, making them entirely dependent on mDCs to facilitate their early IL-2 signaling. On the other hand, memory/effector T cells may contribute their own CD25 and/or IL-2 when primed by mDCs, effectively lowering their stimulation requirements. Yet, and perhaps surprisingly, the high affinity IL-2 signal received during T cell priming seems to be a critical determinant of subsequent T cell expansion even for Ag-experienced T cells.
The emerging model (Supplementary Fig. 8) explains for the first time why immunodeficiency of adaptive T cell responses dominates the phenotype of human subjects with CD25 deficiency, and coexists with paradoxical lymphoproliferation7–9,32. This model predicts that while CD25 deficiency would negatively affect development of Ag-specific effectors, it should not inhibit homeostatic T cell proliferation. Indeed, we observed that IL-7 can drive T cell proliferation in the presence of daclizumab, although it does not fully restore development of Ag-specific effectors (data not shown). Our model also explains the paradoxical observation that while complete (> 99%) saturation of CD25 in blood lymphocytes is achieved with low doses of daclizumab (i.e. blood concentrations of 1μg ml−1), therapeutic efficacy increases with higher doses4,33. We predict that saturation of CD25 in lymph nodes and tissues is required for full therapeutic effect of daclizumab in transplantation and autoimmunity.
In conclusion, our data elucidate a fascinating mechanism which highlights how the expression of cytokine signaling chains on different cells of the immune system can divergently regulate T cell functions through a single cytokine. This knowledge not only enhances our understanding of the complexities of immunoregulation in vivo, but it also represents a basis for the development of more effective IL-2 and CD25-targeting therapies with improved side-effect profiles.
Methods
Study subjects
Studies were performed in accordance with institutional guidelines of the US National Institutes of Health (NIH) and all subjects signed informed consent. Unless stated otherwise, study subjects were HD.
Isolation of PBMC and generation of DCs
PBMC were isolated from apheresis by lymphocyte separation medium (Lonza). CD14+ monocytes were isolated by positive selection (IMag, BD; purity routinely >92%) from PBMC and plated in IMDM containing 100 ng ml−1 rhGM-CSF, 100 ng ml−1 rhIL-4 (PeproTech) and 5% human serum (5–6 days). Medium was replenished every three days. iDCs were washed and co-incubated with either FluHA (0.5μg ml−1; Sanofi Pasteur), HBP (10μg ml−1; Clontech), KLH (10 μg ml−1; Sigma-Aldrich) or Copaxone (Glatiramer Acetate, 10μg ml−1; Teva Marion Partner). Maturation cocktail (50 ng ml−1 TNF-α, 10 ng ml−1 IL-1β, 150 ng ml−1 IL-6 (all PeproTech) and 1 μg ml−1 PGE2) was added 24 h after Ag and cells were incubated for additional 2–3 days. DC phenotype was characterized by staining for CD11c, CD25, CD80, CD83, CD122, CD132, MHC-II (BD Biosciences).
T cell proliferation assays
T cells were purified from PBMC by negative selection (Pan T cell Isolation Kit II; Miltenyi Biotech; purity routinely >95%) and labeled with CFSE as described15. CFSE stained T cells were cultured with autologous Ag-loaded mDCs (5–10 T cells : 1 mDC) in presence of 10–20 μg ml−1 daclizumab (Roche) or equivalent concentration of daclizumab-Fab or MA-251 control Ab (BD Biosciences). Selected doses of daclizumab are achievable in vivo in current MS dosing regimens15. Absolute numbers of proliferating cells were determined by normalizing to APC beads. Alternatively, mDCs were pre-treated with daclizumab, daclizumab-Fab or MA-251 (30–60 min at 37 °C) before co-culture. After 5–14 days, T cell cultures were analyzed for CFSE dilution and intracellular cytokines as described15. Data were analyzed with BD FACSDiva 6.1 (BD Biosciences).
Flow cytometry based signaling assays
Signaling assays were performed using BD Phosflow protocols as described13. Briefly, cells were cultured in presence or absence of exogenous IL-2 (50 IU ml−1) or 200 ng ml−1 of GM-CSF for indicated time periods. Afterwards cells were fixed, permeabilized and stained for pStat5 (pY694; clone 47), CD3 (SK7), CD4 (RPA-T4), CD8 (RPA-T8), CD11c (B-ly6) (all BD Biosciences), HLA-DR (LN3; eBiosciences) and CD25 (B1.49.9; Beckman Coulter). In indicated conditions, mDCs and T cells were pre-treated with 20 μg ml−1 daclizumab (0.5–1 h, 37 °C), and co-cultured. For ex vivo signaling assays, fresh un-coagulated whole blood was stimulated with exogenous cytokines, lysed, fixed by Phosflow Lyse/Fix Buffer (BD) and processed as described.
Flow cytometry based IL-2 secretion assay
IL-2 secretion of co-cultured mDCs and T cells was analyzed using the IL-2 Secretion Assay Detection Kit (APC) from Miltenyi Biotech. mDCs were loaded with 1 μM MBP(83–99) or Flu-HA(306–318) and incubated for 1 h at 37 °C. After washing, different conditions of Ag-loaded mDCs and T cells were assembled. 1 and 2 h after co-culture, cells were labeled with IL-2 catch reagent and incubated for 45 min. Subsequently, cells were labeled with IL-2 detection antibody and appropriate surface markers.
Amnis ImageStream
For ImageStream experiments, cells were processed identically as for flow cytometry. A minimum of 5 × 10⁵ cells were stained per condition. 1–2 × 10⁴ cells were acquired and data were processed using Ideas® 4.0 software (Amnis Corp.).
mRNA analysis
mRNA was isolated from cells with the Absolute RNA miniprep kit (Stratagene). Three μg of total RNA were used to synthesize cDNA using an oligo(dT) and AfinityScript QPCR cDNA synthesis kit (Stratagene). CD122 primers (forward 5′-ACCCCTCGAAGTTCTTTTCC-3′, reverse 5′-CTTGTCCCTCTCCAGCACTT-3′) were designed using Geneious Pro software (Biomatters). β-actin primers (forward 5′-AAAGACCTGTACGCCAACACA-3′, reverse 5′-AGTACTTGCGCTCAGGAGGA-3′) were used as described previously34. PCR was performed on 150 ng of cDNA using GoTaq Green Master Mix (Promega) as follows: 95 °C (2 min), 30 cycles [95 °C (15 s), 60 °C (30 s), 72 °C (30 s)], 72 °C (5 min), 4 °C (5 min). The PCR product was run on a 2% agarose gel and imaged using Image Station 440 CF (Kodak).
T cell siRNA experiments
Negatively-selected CFSE-stained T cells were rested overnight in antibiotic-free media. Nucleofection was performed with control or CD25 siRNA (Santa Cruz Biotechnology) diluted in RNase-free water at 3 μg for 5 × 10⁶ cells using T cell Nucleofection kit (Amaxa). After nucleofection, cells were rested in antibiotic-free media for 6 h (37 °C, 5% CO2) before co-culture with mDCs. Efficacy of CD25 inhibition was assessed by CD25 staining of T cells activated with CD3/CD28 Dynabeads (0.3 : 1 bead to T cell ratio) 12–72 h post-stimulation.
Statistical analysis
Group differences were analyzed using non-parametric Repeated Measures ANOVA on Ranks, or when permitted by distribution, parametric ANOVA equivalent or paired T-test for comparison of two groups only (SigmaStat). Levels of significance were set to P < 0.05.
Supplementary Material
Supplementary Figure 1 Inhibition of CD25 expression on T cells early post-activation inhibits T cell proliferation only minimally
Supplementary Figure 2 Inhibitory effect of daclizumab on T cell expansion does not require binding to Fc-receptors
Supplementary Figure 3 Human myeloid DCs lack CD122 expression and show impaired maturation in presence of immune complexes
Supplementary Figure 4 Kinetics of CD25 and IL-2 expression on activated T cells
Supplementary Figure 5 Partial restoration of signaling to exogenous IL-2 in the Ag-nonspecific system by CD25expressing mDCs
Supplementary Figure 6 pStat5 signaling and expansion of T cells in the Ag-specific system without exogenous IL-2
Supplementary Figure 7 IL-2 secretion: details of immune synapses
Supplementary Figure 8 Model describing the role of CD25 in T cell activation
Acknowledgments
The study was supported by the intramural research program of the US National Institute of Neurological Disorders and Stroke (NINDS)/US National Institutes of Health (NIH). We thank A. Kashani for expert technical assistance in processing apheresis samples and M. Lenardo, W. Leonard and H. McFarland (all NIH) for their critical review of the manuscript and helpful comments. Additionally, we are thankful to M. Lenardo and H. Su for providing cryopreserved peripheral blood mononuclear cells (PBMC) from the CD25- individual. Daclizumab-Fab was provided by Abbott Biotherapeutics Corp., under Material Transfer Agreement.
Footnotes
Author Contributions
B.B. developed the concept of the study and supervised the project. B.B. and T.A.W. designed the experiments. S.C.W., J.F.M., S.H., J.S.A.P., C.M.C., D.M., J.E., E.M. and B.B. performed the experiments and analyzed the data. B.B., S.C.W., J.F.M., S.H. and C.M.C. wrote the paper. All authors approved the final version of this paper.
Competing Financial Interests
B.B. and T.A.W. are co-inventors on NIH patents related to the use of daclizumab in MS and as such have received patent royalty payments.
Reference list
- 1.Waldmann TA, O’Shea J. The use of antibodies against the IL-2 receptor in transplantation. Curr Opin Immunol. 1998;10:507–512. doi: 10.1016/s0952-7915(98)80215-x. [DOI] [PubMed] [Google Scholar]
- 2.Nussenblatt RB, et al. Treatment of noninfectious intermediate and posterior uveitis with the humanized anti-Tac mAb: a phase I/II clinical trial. Proc Natl Acad Sci U S A. 1999;96:7462–7466. doi: 10.1073/pnas.96.13.7462. [DOI] [PMC free article] [PubMed] [Google Scholar]
- 3.Bielekova B, et al. Humanized anti-CD25 (daclizumab) inhibits disease activity in multiple sclerosis patients failing to respond to interferon-beta. Proc Natl Acad Sci U S A. 2004;101:8705–8708. doi: 10.1073/pnas.0402653101. [DOI] [PMC free article] [PubMed] [Google Scholar]
- 4.Bielekova B, et al. Effect of anti-CD25 antibody daclizumab in the inhibition of inflammation and stabilization of disease progression in multiple sclerosis. Arch Neurol. 2009;66:483–489. doi: 10.1001/archneurol.2009.50. [DOI] [PMC free article] [PubMed] [Google Scholar]
- 5.Rose JW, et al. Daclizumab phase II trial in relapsing and remitting multiple sclerosis: MRI and clinical results. Neurology. 2007;69:785–789. doi: 10.1212/01.wnl.0000267662.41734.1f. [DOI] [PubMed] [Google Scholar]
- 6.Willerford DM, et al. Interleukin-2 receptor alpha chain regulates the size and content of the peripheral lymphoid compartment. Immunity. 1995;3:521–530. doi: 10.1016/1074-7613(95)90180-9. [DOI] [PubMed] [Google Scholar]
- 7.Sharfe N, Dadi HK, Shahar M, Roifman CM. Human immune disorder arising from mutation of the alpha chain of the interleukin-2 receptor. Proc Natl Acad Sci U S A. 1997;94:3168–3171. doi: 10.1073/pnas.94.7.3168. [DOI] [PMC free article] [PubMed] [Google Scholar]
- 8.Aoki CA, et al. IL-2 receptor alpha deficiency and features of primary biliary cirrhosis. J Autoimmun. 2006;27:50–53. doi: 10.1016/j.jaut.2006.04.005. [DOI] [PubMed] [Google Scholar]
- 9.Roifman CM. Human IL-2 receptor alpha chain deficiency. Pediatr Res. 2000;48:6–11. doi: 10.1203/00006450-200007000-00004. [DOI] [PubMed] [Google Scholar]
- 10.Morgan DA, Ruscetti FW, Gallo R. Selective in vitro growth of T lymphocytes from normal human bone marrows. Science. 1976;193:1007–1008. doi: 10.1126/science.181845. [DOI] [PubMed] [Google Scholar]
- 11.Setoguchi R, Hori S, Takahashi T, Sakaguchi S. Homeostatic maintenance of natural Foxp3+ CD25+ CD4+ regulatory T cells by interleukin (IL)-2 and induction of autoimmune disease by IL-2 neutralization. J Exp Med. 2005;201:723–735. doi: 10.1084/jem.20041982. [DOI] [PMC free article] [PubMed] [Google Scholar]
- 12.Lenardo MJ. Interleukin-2 programs mouse T lymphocytes for apoptosis. Nature. 1991;353:858–861. doi: 10.1038/353858a0. [DOI] [PubMed] [Google Scholar]
- 13.Martin JF, Perry JS, Jakhete NR, Wang X, Bielekova B. An IL-2 paradox: blocking CD25 on T cells induces IL-2-driven activation of CD56(bright) NK cells. J Immunol. 2010;185:1311–1320. doi: 10.4049/jimmunol.0902238. [DOI] [PMC free article] [PubMed] [Google Scholar]
- 14.Oh U, et al. Regulatory T cells are reduced during anti-CD25 antibody treatment of multiple sclerosis. Arch Neurol. 2009;66:471–479. doi: 10.1001/archneurol.2009.16. [DOI] [PMC free article] [PubMed] [Google Scholar]
- 15.Bielekova B, et al. Regulatory CD56bright natural killer cells mediate immunomodulatory effects of IL-2R-alpha-targeted therapy (daclizumab) in multiple sclerosis. PNAS. 2006;103:5941–5946. doi: 10.1073/pnas.0601335103. [DOI] [PMC free article] [PubMed] [Google Scholar]
- 16.Wang X, Rickert M, Garcia KC. Structure of the quaternary complex of interleukin-2 with its alpha, beta, and gammac receptors. Science. 2005;310:1159–1163. doi: 10.1126/science.1117893. [DOI] [PubMed] [Google Scholar]
- 17.Leonard WJ, et al. Signaling via the IL-2 and IL-7 receptors from the membrane to the nucleus. Cold Spring Harb Symp Quant Biol. 1999;64:417–424. doi: 10.1101/sqb.1999.64.417. [DOI] [PubMed] [Google Scholar]
- 18.Malek TR. The biology of interleukin-2. Annu Rev Immunol. 2008;26:453–479. doi: 10.1146/annurev.immunol.26.021607.090357. [DOI] [PubMed] [Google Scholar]
- 19.Granucci F, Zanoni I, Feau S, Ricciardi-Castagnoli P. Dendritic cell regulation of immune responses: a new role for interleukin 2 at the intersection of innate and adaptive immunity. The EMBO journal. 2003;22:2546–2551. doi: 10.1093/emboj/cdg261. [DOI] [PMC free article] [PubMed] [Google Scholar]
- 20.Granucci F, et al. Inducible IL-2 production by dendritic cells revealed by global gene expression analysis. Nat Immunol. 2001;2:882–888. doi: 10.1038/ni0901-882. [DOI] [PubMed] [Google Scholar]
- 21.Velten FW, Rambow F, Metharom P, Goerdt S. Enhanced T-cell activation and T-cell-dependent IL-2 production by CD83+, CD25high, CD43high human monocyte-derived dendritic cells. Mol Immunol. 2007;44:1544–1550. doi: 10.1016/j.molimm.2006.08.020. [DOI] [PubMed] [Google Scholar]
- 22.Mnasria K, Lagaraine C, Manaa J, Lebranchu Y, Oueslati R. Anti CD25 treatment of human dendritic cells modulates both their cytokine synthesis profiles and their capacity to activate allogeneic CD4 T cells: a potential tolerogenic effect. Int Immunopharmacol. 2008;8:414–422. doi: 10.1016/j.intimp.2007.11.004. [DOI] [PubMed] [Google Scholar]
- 23.Mnasria K, Lagaraine C, Velge-Roussel F, Lebranchu Y, Baron C. Anti-CD25 Antibodies Decrease the Ability of Human Dendritic Cells to Prime Allogeneic CD4 T Cells. Transplant Proc. 2009;41:695–697. doi: 10.1016/j.transproceed.2009.01.028. [DOI] [PubMed] [Google Scholar]
- 24.Mnasria K, et al. Anti-CD25 antibodies affect cytokine synthesis pattern of human dendritic cells and decrease their ability to prime allogeneic CD4+ T cells. J Leukoc Biol. 2008;84:460–467. doi: 10.1189/jlb.1007712. [DOI] [PubMed] [Google Scholar]
- 25.Siragam V, et al. Intravenous immunoglobulin ameliorates ITP via activating Fc gamma receptors on dendritic cells. Nat Med. 2006;12:688–692. doi: 10.1038/nm1416. [DOI] [PubMed] [Google Scholar]
- 26.Dubois S, Mariner J, Waldmann TA, Tagaya Y. IL-15Ralpha recycles and presents IL-15 In trans to neighboring cells. Immunity. 2002;17:537–547. doi: 10.1016/s1074-7613(02)00429-6. [DOI] [PubMed] [Google Scholar]
- 27.Bielekova B, et al. Encephalitogenic potential of the myelin basic protein peptide (amino acids 83–99) in multiple sclerosis: results of a phase II clinical trial with an altered peptide ligand. Nat Med. 2000;6:1167–1175. doi: 10.1038/80516. [DOI] [PubMed] [Google Scholar]
- 28.Slack EC, et al. Syk-dependent ERK activation regulates IL-2 and IL-10 production by DC stimulated with zymosan. Eur J Immunol. 2007;37:1600–1612. doi: 10.1002/eji.200636830. [DOI] [PubMed] [Google Scholar]
- 29.Strowig T, et al. Tonsilar NK cells restrict B cell transformation by the Epstein- Barr virus via IFN-gamma. PLoS Pathog. 2008;4:e27. doi: 10.1371/journal.ppat.0040027. [DOI] [PMC free article] [PubMed] [Google Scholar]
- 30.Kronin V, Vremec D, Shortman K. Does the IL-2 receptor alpha chain induced on dendritic cells have a biological function? Int Immunol. 1998;10:237–240. doi: 10.1093/intimm/10.2.237. [DOI] [PubMed] [Google Scholar]
- 31.Letourneau S, Krieg C, Pantaleo G, Boyman O. IL-2- and CD25-dependent immunoregulatory mechanisms in the homeostasis of T-cell subsets. J Allergy Clin Immunol. 2009;123:758–762. doi: 10.1016/j.jaci.2009.02.011. [DOI] [PubMed] [Google Scholar]
- 32.Caudy AA, Reddy ST, Chatila T, Atkinson JP, Verbsky JW. CD25 deficiency causes an immune dysregulation, polyendocrinopathy, enteropathy, X-linked-like syndrome, and defective IL-10 expression from CD4 lymphocytes. J Allergy Clin Immunol. 2007;119:482–487. doi: 10.1016/j.jaci.2006.10.007. [DOI] [PubMed] [Google Scholar]
- 33.Wynn D, et al. Daclizumab in active relapsing multiple sclerosis (CHOICE study): a phase 2, randomised, double-blind, placebo-controlled, add-on trial with interferon beta. Lancet Neurol. 2010;9:381–390. doi: 10.1016/S1474-4422(10)70033-8. [DOI] [PubMed] [Google Scholar]
- 34.Cartagena CM, Burns MP, Rebeck GW. 24S-hydroxycholesterol effects on lipid metabolism genes are modeled in traumatic brain injury. Brain Res. 2010;1319:1–12. doi: 10.1016/j.brainres.2009.12.080. [DOI] [PMC free article] [PubMed] [Google Scholar]
Associated Data
This section collects any data citations, data availability statements, or supplementary materials included in this article.
Supplementary Materials
Supplementary Figure 1 Inhibition of CD25 expression on T cells early post-activation inhibits T cell proliferation only minimally
Supplementary Figure 2 Inhibitory effect of daclizumab on T cell expansion does not require binding to Fc-receptors
Supplementary Figure 3 Human myeloid DCs lack CD122 expression and show impaired maturation in presence of immune complexes
Supplementary Figure 4 Kinetics of CD25 and IL-2 expression on activated T cells
Supplementary Figure 5 Partial restoration of signaling to exogenous IL-2 in the Ag-nonspecific system by CD25expressing mDCs
Supplementary Figure 6 pStat5 signaling and expansion of T cells in the Ag-specific system without exogenous IL-2
Supplementary Figure 7 IL-2 secretion: details of immune synapses
Supplementary Figure 8 Model describing the role of CD25 in T cell activation