

Abstract
Objective
Serum levels of the soluble Receptor for Advanced Glycation End-products (sRAGE) have been associated with risk of cardiovascular disease. We hypothesized that sRAGE levels are associated with subclinical cerebrovascular disease in an ethnically diverse population.
Methods
Clinically stroke-free participants in the multi-ethnic Northern Manhattan Study (NOMAS) underwent brain MRI to quantify subclinical brain infarcts (SBI) and white matter hyperintensity volume (WMHV) (n=1102). Serum levels of sRAGE were measured by ELISA. Logistic and multiple linear regression were employed to estimate associations of sRAGE with SBI and WMHV, after adjusting for demographics and vascular risk factors.
Results
Median sRAGE levels were significantly lower in Hispanics (891.9 pg/ml; n=708) and non-Hispanic blacks (757.4 pg/ml; n=197) than in non-Hispanic whites (1120.5 pg/ml; n=170), and these differences remained after adjusting for other risk factors. Interactions were observed by race-ethnicity between sRAGE levels and MRI measurements, including for SBI in Hispanics (p=0.04) and WMHV among blacks (p=0.03). In Hispanics, increasing sRAGE levels were associated with a lower odds of SBI, with those in the upper sRAGE quartile displaying a 50% lower odds of SBI after adjusting for sociodemographic and vascular risk factors (p=0.05). Among blacks, those in the upper quartile of sRAGE had a similarly reduced increased risk of SBI (p=0.06) and greater WMHV (p=0.04).
Conclusion
Compared to whites, Hispanics and blacks have significantly lower sRAGE levels, and these levels were associated with more subclinical brain disease. Taken together, these findings suggest sRAGE levels may be significantly influence by ethnicity. Further studies of sRAGE and stroke risk, particularly in minorities, are warranted.
Keywords: RAGE (receptor for advanced glycation end products), biological marker, Hispanics, white matter hyperintensities, subclinical infarct, MRI
1. Introduction
The Receptor for Advanced Glycation End-products (RAGE) is a multi-ligand member of the immunoglobulin superfamily of cell surface molecules [1] Since its isolation in 1992, a growing body of scientific evidence has demonstrated a role for RAGE in the pathogenesis of cardiovascular disease [1–3] Studies have demonstrated that inhibiting ligand-RAGE interaction, including the administration of a recombinant form of soluble (s)RAGE, attenuate the development and progression of cerebrovascular and cardiovascular disease in rodent models [2,3]
Recent studies have identified soluble isoforms of RAGE that exist endogenously and are formed by both alternative splicing or proteolytic cleavage [4,5]. Furthermore, circulating serum levels of sRAGE in human subjects have been shown to be associated with a range of cardio/cebro-vascular risk factors including essential hypertension [6], coronary artery disease [7], intimal-medial thickening of the arteries [8], hypercholesterolemia [9], vascular dementia [10], non-alcoholic fatty liver disease [11], and the diabetic state [12]. Moreover, increased sRAGE levels have been associated with extreme longevity, suggesting a role for RAGE/sRAGE in the aging process [13]. Furthermore, studies have shown lower sRAGE levels were associated with an increased prevalence of ischemic stroke and a higher grade of white-matter hyperintensity volume (WMHV) by magnetic resonance imaging (MRI) in patients with acute stroke [14–16].
WMHV and subclinical brain infarcts (SBI) are often found independently on MRI scans, and may represent ischemic small-vessel disease [17]. Individuals with extensive WMHV and SBI are at increased risk of stroke [17], cognitive impairment, and dementia.[18] Although the mechanisms underlying these imaging abnormalities are not fully known, WMHV and SBI are associated with a range of vascular risk factors including hypertension and diabetes [19]. The association of lower sRAGE levels with both frank cerebrovascular disease and WMHV in stroke patients [14–16] makes sRAGE an attractive candidate for a measure of subclinical cerebral injury in the non-stroke population. However, no studies to date have assessed sRAGE levels in either a prospective cohort, or for its relationship with subclinical vascular disease. Therefore, we hypothesized that lower sRAGE levels are associated with increased SBI and WHMV, in a multi-ethnic stroke-free population.
2. Methods
2.1 Study subjects
The Northern Manhattan Study (NOMAS) is a population-based cohort of initially stroke-free participants that was designed to investigate stroke risk factors in a multi-ethnic community [20]. The methods of recruitment and study definitions for race-ethnicity, hypertension, diabetes, cardiac disease, and other risk factor have been previously described [20]. Briefly, hypertension was defined as a systolic blood pressure >140 mm Hg or a diastolic blood pressure > 90 mm Hg, diabetes was defined as a fasting blood glucose ≥ 127 mg/dl, and kidney function was determined by the Modification of Diet in Renal Disease formula [21].
2.2 Laboratory Data
Blood samples were collected at the time of enrollment in 5 ml serum separator tubes, centrifuged at 3000g for 15 minutes, aliquoted into 2ml tubes and stored at −80 °C until use. Samples were thawed on ice and assayed for total serum sRAGE using the Quantikine Human RAGE Immunoassay (R&D Systems). The minimal level of detection was set at 78 pg/ml as per manufacturer’s instructions. Laboratory personnel were blinded to patient clinical data. The intra- and interassay coefficients of variation were 6% and 10%, respectively.
2.3 MRI Examination
Participants included in this study were part of a subsample that underwent MRI scanning, and they were recruited from the NOMAS cohort using the following criteria: (1) age ≥55 years; (2) no contraindications to MRI; and (3) signed Institutional Review Board-approved informed consent. The original cohort of 3298 participants was enriched by an additional 199 participants for this MRI substudy. Imaging of WMHV was performed and analyzed as previously described [22]. Briefly, imaging was performed on a 1.5T MRI system (Philips Medical Systems, Best, the Netherlands). Analysis of WMHV was based on a Fluid Attenuated Inversion Recovery (FLAIR) image acquired in the Multi-Slice Turbo Spin Echo (MS-TSE) mode with a field of view of 250 mm, rectangular field of view of 80%, and an acquisition matrix of 192×133 scaled to 256×256 in reconstruction. The FLAIR image had a 3 mm slice thickness without gap, an echo time of 144 ms, a repetition time of 5500 ms, an inversion recovery delay of 1900 ms, and a flip angle of 90 degrees. Images were oriented parallel to a hypothetical line connecting the anterior and posterior commissures. Quantitative analysis of WMHV was performed using the Quantum 6.2 package on a Sun Microsystems Ultra 5 workstation.
White matter hyperintensity segmentation from surrounding tissue was done in two steps [23–25]. Non-brain elements were manually removed from the image by operator-guided tracing of the dura mater within the cranial vault. The resulting measure of the cranial vault was defined as the total cranial volume to correct for differences in head size among participants. The first step in image segmentation required the identification of brain matter. Image intensity non-uniformities were then removed from the image and the corrected image was modeled as a mixture of two gaussian probability functions with the segmentation threshold determined at the minimum probability between these distributions. Once brain matter segmentation was achieved, a single gaussian distribution was fitted to image data and a segmentation threshold for WMHV was determined a priori as 3.5 standard deviations (SDs) in pixel intensity above the mean of the fitted distribution of brain parenchyma. Morphometric erosion of two exterior image pixels was also applied to the brain matter image before modeling to remove the effects of partial volume cerebrospinal fluid pixels on WMH determination. White matter hyperintensity volume was expressed as the proportion of total cranial volume (TCV) to correct for head size, and log transformed to create a normal distribution (log-WMHV) for analysis as a continuous variable [23–25].
WHMV was expressed as the proportion of total cranial volume (TCV) to correct for head size, and natural log-transformed to create a normal distribution (log-WMHV) for analysis as a continuous variable. Investigators processing images were blinded to participant identifying and clinical information. The presence or absence of SBI on MRI was determined according to a protocol using the location, size, and imaging characteristic of the lesion [26]. Lesions 3 mm or larger were considered brain infarcts.
2.4 Statistical Analyses
Statistical analyses were conducted on SAS 9.1 software (SAS Institute, Cary, NC), with the level of statistical significance set at p<0.05. With sample size 1102, we have 84% of power to detect relative risk 0.66 of WMH Large between those with below the median of sRAGE and those with above the median of sRAGE. The Student t-test was used to examine the association between sample characteristics and sRAGE. We fitted logistic regression models with SBI as a binary outcome, and WMH volumes > 1 SD above the age-predicted mean were also defined as “large” and analyzed as a second binary outcome to calculate odds ratio (OR) and 95% confidence interval (CI) [27]. We also used linear regression with log-WMHV as a continuous outcome to calculate β and 95% CI. Serum levels of sRAGE were log-transformed to achieve linearity when it was used as a continuous measure. We also used quartiles of sRAGE (Q1 = lowest, Q2, Q3, Q4) since clinically relevant cutoffs are not well established. Final models adjusted for sociodemographic variables (age, sex, race-ethnicity, education, insurance status) and vascular risk factors (current smoking, HDL, LDL, diabetes, Estimated Glomerular Filtration Rate (eGFR), systolic and diastolic blood pressure). Interaction terms between sRAGE and race-ethnicity were tested to assess whether the effect of sRAGE on SBI or WMHV differed by race-ethnicity groups.
3. Results
3.1 Sample Characteristics
There were 1,102 participants with MRI and sRAGE measurements available for analysis. The characteristics of the study sample are presented in Table 1. The mean age of the study group at time of MRI was 70.7 ± 8.6 years. The median (interquartile range) for WHMV was 0.37% (0.21%–0.78%), and the prevalence of SBI was 16% (n=176). The median (interquartile range) for sRAGE was 898 pg/ml (648–1247 pg/ml).
Table 1.
Charact eristics of the cohort (N=1102 ) and levels of sRAGE.
| Characteristic | Prevalence | sRAGE (pg/ml) | P* |
|---|---|---|---|
| n (%) | Median (IQR) | ||
| Age | |||
| <70 years | 577 (52.4) | 930.1 (655.8-1304.8) | 0.015 |
| ≥70 years | 525 (47.6) | 871.3 (641.3-1177.9) | |
| Sex | |||
| Men | 444 (40.3) | 865.9 (642.2-1206.0) | 0.2674 |
| Women | 658 (59.7) | 927.8 (654.0-1265.2) | |
| Race-ethnicity | |||
| Hispanic | 708 (60.0) | 891.9 (655.3-1235.7) | <.0001 |
| Non-Hispanic black | 197 (20.0) | 757.4 (511.0-1081.9) | <.0001 |
| Non-Hispanic white | 170 (20.0) | 1120.5 (857.9-1631.0) | Reference |
| High school education | |||
| Yes | 508 (46.1) | 935.0 (660.3-1264.2) | 0.0587 |
| No | 594 (53.9) | 870.5 (642.9-1224.6) | |
| Insurance | |||
| Medicaid or no insurance | 510 (46.3) | 860.8 (626.4-1194.7) | 0.0179 |
| Private insurance or Medicare | 591 (53.7) | 929.3 (674.5-1287.2) | |
| Systolic (mm Hg) | |||
| <140 | 641 (58.2) | 929.29 (659.5-1264.5) | 0.1 |
| >=140 | 461 (41.8) | 858.1 (627.5-1201.8) | |
| Diastolic (mm Hg) | |||
| <90 | 964 (87.5) | 926.5 (655.9-1264.2) | 0.003 |
| >=90 | 138 (12.5) | 790.7 (615.5-1067.4) | |
| Diabetes Mellitus | |||
| Yes | 209 (19) | 841.9 (627.5-1188.0) | 0.3285 |
| No | 893 (81) | 910.0 (656.7-1259.9) | |
| Smoking | |||
| Current | 178 (16.2) | 835.8 (608.7-1188.0) | 0.0278 |
| Past | 403 (36.6) | 907.7 (659.5-1262.8) | 0.8493 |
| Never | 521 (47.3) | 928.4 (653.9-1262.6) | Reference |
| LDL (mg/dl) | |||
| <=130 | 745 (67.9) | 910.0 (658.8-1262.8) | 0.31 |
| >130 | 352(32.1) | 879.6 (638.4-1189.8) | |
| HDL (mg/dl) | |||
| <=40 for man,<=50 for woman | 421 (38.2) | 876.3 (661.3-1259.9) | 0.65 |
| >40 for man,>50 for woman | 680(61.8) | 909.3 (638.4-1233.7) | |
| History of hypertension | |||
| No | 760 | 950.9 (685.3-1213.4) | 0.07 |
| Yes | 342 | 872.4 (641.9-1213.4) | |
| eGFR | |||
| Severe | 230 (21) | 1021.4 (757.4-1340.2) | <.0001 |
| Mild | 645 (59) | 893.7 (642.7-1266.8) | 0.002 |
| Normal | 230 (21) | 796.0 (603.5-1109.3) | Reference |
Abbreviations: sRAGE= soluble Receptor for Advance d Glycatio n End- products; HDL=hi gh density lipoprote in; LDL=lo w density lipoprote in
Log transfor med sRAGE levels were used for t-test
There were differences in sRAGE levels by socio-demographic characteristics. Older participants were more likely to have lower sRAGE levels than younger participants, Hispanics and non-Hispanic blacks had lower sRAGE levels than whites (Figure 1), and those with more education and private medical insurance had higher sRAGE levels. Participants who were current smokers displayed lower sRAGE levels. Lower sRAGE levels were also associated with elevated systolic and diastolic blood pressures, and displayed a trend with a history of hypertension. Race-ethnic differences in sRAGE persisted even after adjusting for sociodemographic and vascular risk factors; compared to whites, sRAGE in blacks was 33% lower (p<0.0001) and in Hispanics 12% lower (p=0.008).
Figure 1.
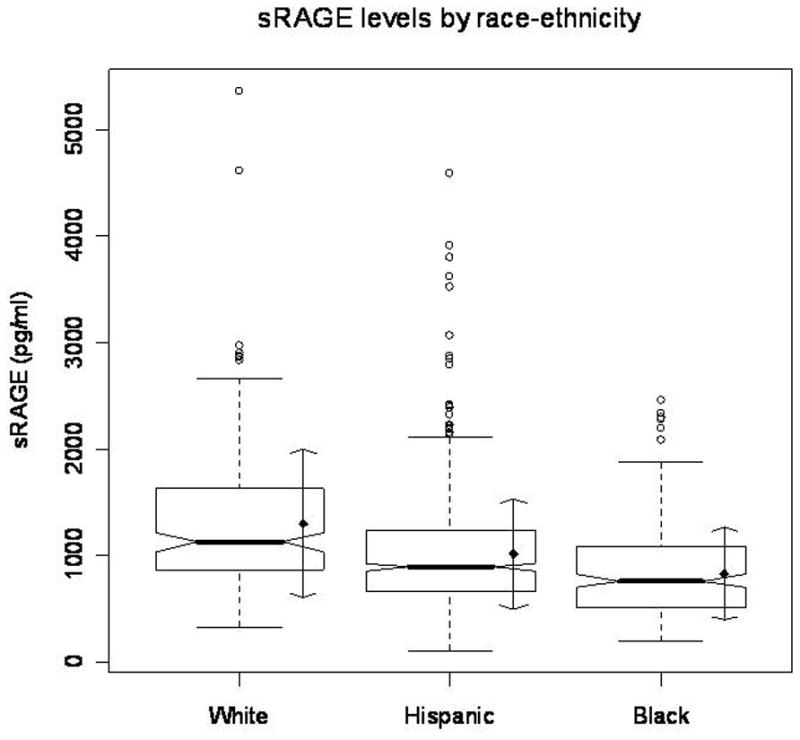
sRAGE levels differ amongst ethnic groups. sRAGE levels (pg/ml) were stratified by race-ethnicity. Hispanics and non-Hispanic blacks had lower sRAGE levels than whites (p <0.0001).
3.2 Association Between sRAGE Levels, WMHV and SBI in overall cohort
There was an association between sRAGE and WMHV (OR for large WMHV per SD of log-sRAGE = 0.76, 95% CI 0.64–0.89; p=0.001), which remained after adjusting for other risk factors (adjusted OR per SD of log-sRAGE =0.78, 95% CI 0.65–0.94; p=0.008). There was no association in the overall cohort between sRAGE levels and SBI (adjusted OR per SD of log-sRAGE = 0.91, 95% CI 0.76–1.09; p=0.29) or WMHV considered continuously (change in log-WMHV per SD of log-sRAGE = −0.04, 95% CI −0.09-0.02; p=0.16).
Because of the heterogeneity in sRAGE levels by race-ethnicity, we explored for interactions between sRAGE and race-ethnicity on the subclinical vascular outcomes. There was evidence of an interaction between sRAGE levels and race-ethnicity for both SBI and WMHV. The effect of sRAGE on SBI was significantly different for Hispanics vs whites (p = 0.04) and the effect of sRAGE on WMHV was significantly different for blacks vs whites (p=0.03). We therefore performed analyses stratified by race-ethnicity.
3.3 Association Between sRAGE Levels and SBI
Among Hispanics there was a trend toward an inverse association of serum sRAGE levels and SBI (adjusted OR per 1-SD change in log-sRAGE = 0.80; 95% CI 0.63–1.01; p=0.06). There was no similar association in whites or blacks (Table 2). To further explore this relationship, we analyzed sRAGE levels by quartiles in each race-ethnic group (Table 3). In unadjusted analyses among Hispanics, we observed a dose-response relationship of sRAGE on SBI. In particular, those in the highest quartile of sRAGE had a lower risk of SBI compared to those in the lowest quartile (OR 0.57; 95% CI 0.30 to 1.07; p=0.08). Among whites, an opposite trend was seen, but was not statistically significant. After adjusting for age, sex, education, insurance status, smoking, blood glucose, blood pressure, LDL, HDL, and eGFR, the association was significant in Hispanics (adjusted OR for Q4 of sRAGE compared to Q1 = 0.50; 95% CI 0.25– 0.99; p=0.048). In blacks, a similar trend was seen (adjusted OR for Q4 of sRAGE compared to Q1= 0.13; 95% CI 0.01– 1.13; p=0.06), but there was no association among whites.
Table 2.
sRAGE levels and silent brain infarcts, stratified by race-ethnicity.
| Race-Ethnicity | Adjusted OR* (95% CI) for covert brain infarcts per standard deviation of log-sRAGE | P |
|---|---|---|
| Non-Hispanic White | 1.33 (0.85–2.07) | 0.21 |
| Non-Hispanic Black | 0.85 (0.61–1.19) | 0.35 |
| Hispanic | 0.80 (0.63–1.01) | 0.06 |
Adjusted for age, sex, education, smoking, blood glucose, diastolic blood pressure, systolic blood pressure, low density lipoprotein, high density lipoprotein and estimated glomerular filtration rate
Table 3.
Associations between quartiles of sRAGE levels and silent brain infarct, stratified by race-ethnic group
| Model 1† | Model 2‡ | ||||||
|---|---|---|---|---|---|---|---|
| Odds ratio | 95% Confidence interval | P | Odds ratio | 95% Confidence interval | P | ||
| Non-Hispanic White | Quartile 1(referent) | -- | -- | ||||
| Quartile 2 | 1.67 | 0.29–9.54 | 0.57 | 1.49 | 0.22–10.09 | 0.68 | |
| Quartile 3 | 1.10 | 0.19–6.20 | 0.92 | 1.11 | 0.18–6.85 | 0.91 | |
| Quartile 4 | 2.45 | 0.51–11.78 | 0.26 | 2.62 | 0.48–14.40 | 0.27 | |
| Non-Hispanic Black | Quartile 1(referent) | -- | -- | ||||
| Quartile 2 | 1.71 | 0.75–3.87 | 0.20 | 1.85 | 0.74–4.60 | 0.19 | |
| Quartile 3 | 1.28 | 0.55–3.01 | 0.56 | 1.18 | 0.45–3.08 | 0.74 | |
| Quartile 4 | 0.14 | 0.02–1.12 | 0.06 | 0.13 | 0.02–1.13 | 0.06 | |
| Hispanic | Quartile 1(referent) | -- | -- | ||||
| Quartile 2 | 0.95 | 0.54–1.66 | 0.84 | 1.00 | 0.55–1.83 | 0.99 | |
| Quartile 3 | 0.71 | 0.39–1.30 | 0.27 | 0.86 | 0.45–1.64 | 0.65 | |
| Quartile 4 | 0.57 | 0.30–1.07 | 0.08 | 0.50 | 0.25–0.99 | 0.05 | |
Model 1: unadjusted
Model 2: adjusted for age, sex, education, smoking, blood glucose, diastolic blood pressure, systolic blood pressure, low density lipoprotein, high density lipoprotein and estimated glomerular filtration rate
3.4 Association between sRAGE Levels and WMHV
Among blacks, there was an inverse association between serum sRAGE levels and WMHV (a 12% decrease in WMHV per 1 SD increase in log-sRAGE; p=0.035) (Table 4). There was no similar association in whites or Hispanics. We further analyzed sRAGE levels by quartiles in each race-ethnic group (Table 5). In unadjusted analyses, among both blacks and Hispanics, there was a trend towards lower WMHV for those in the upper quartiles (Q4 for blacks and Q3 for Hispanics) of sRAGE than those in the lowest quartile. After adjusting for sociodemographic and vascular risk factors, among blacks, WHMV was 37% lower for those in the top quartile of sRAGE than the lowest quartile (β = −0.47; 95% CI −0.92 to −0.02; p=0.04).
Table 4.
sRAGE levels and white matter hyperintensity volume (WMHV), stratified by race-ethnicity
| Race-Ethnicity | Change in log-WMHV per SD log-sRAGE (95%CI) * | P |
|---|---|---|
| Non-Hispanic White | 0.07 (−0.06, 0. 21) | 0.30 |
| Non-Hispanic Black | −0.12 (−0.24, −0.01) | 0.04 |
| Hispanic | −0.04 (−0.11, 0.03) | 0.28 |
Adjusted for age, sex, education, smoking, blood glucose, diastolic blood pressure, systolic blood pressure, low density lipoprotein, high density lipoprotein and estimated glomerular filtration rate
Table 5.
Associations between quartiles of sRAGE levels and white matter hyperintensity volume by race-ethnic group
| Model 1† | Model 2‡ | ||||
|---|---|---|---|---|---|
| Change in log-WMHV compared to quartile 1 (95% CI) | P | Change in log-WMHV compared to quartile 1 (95% CI) | P | ||
| White | Quartile 1 (referent) | -- | -- | ||
| Quartile 2 | 0.30 (−0.17, 0.77) | 0.22 | 0.38 (−0.07, 0.83) | 0.10 | |
| Quartile 3 | 0.23 (−0.22, 0.67) | 0.32 | 0.24 (−0.18, 0.66) | 0.26 | |
| Quartile 4 | 0.36 (−0.06, 0.78) | 0.10 | 0.34 (−0.06, 0.75) | 0.10 | |
| Black | Quartile 1 (referent) | -- | |||
| Quartile 2 | 0.03 (−0.35, 0.41) | 0.88 | −0.02 (−0.39, 0.34) | 0.91 | |
| Quartile 3 | 0.04 (−0.35, 0.42) | 0.85 | −0.00 (−0.38, 0.38) | 0.99 | |
| Quartile 4 | −0.32 (−0.78, 0.15) | 0.19 | −0.47 (−0.92, −0.02) | 0.04 | |
| Hispanic | Quartile 1 (referent) | -- | |||
| Quartile 2 | −0.08 (−0.28, 0.12) | 0.45 | −0.03 (−0.20, 0.15) | 0.75 | |
| Quartile 3 | −0.19 (−0.39, 0.01) | 0.07 | −0.11 (−0.29, 0.07) | 0.22 | |
| Quartile 4 | −0.02 (−0.22, 0.19) | 0.87 | −0.10 (−0.28, 0.08) | 0.28 | |
Abbreviations: WMHV= white matter hyperintensity volume; SE=standard error
Model 1: unadjusted
Model 2: adjusted for age, sex, education, smoking, blood glucose, diastolic blood pressure, systolic blood pressure, low density lipoprotein, high density lipoprotein and estimated glomerular filtration rate
4. Discussion
In this first analysis of sRAGE as a marker of subclinical cerebrovascular disease, we found evidence of effect modification by race-ethnicity in a prospective stroke-free cohort study. We found that lower levels of sRAGE are associated with a higher prevalence of silent brain infarcts in Hispanic subjects, even after adjusting for vascular risk factors. Furthermore, we found that lower sRAGE levels were associated with increased WMHV in blacks after adjusting for other risk factors. Our findings therefore suggest that serum levels of sRAGE may be predictive not only of stroke risk, as previously shown [14–16], but also associated with subclinical cerebrovascular disease, particularly in ethnic groups with increased risk for cerebrovascular disease.
RAGE is a cell surface receptor present on most neurovascular cell types including endothelium, neurons, glia, and circulating inflammatory cells [28,29]. Recently, it has been shown that endogenous mechanisms exist to produce soluble isoforms of RAGE, including alternative splicing of the RAGE gene and cleavage of cell surface RAGE [1]. Furthermore, these soluble isoforms are measurable in human blood and their levels have been associated with a variety of pathological conditions including diabetes, cardiovascular disease, stroke, and Alzheimer disease [1,10,12,14]. In the current study, we found that sRAGE levels differed by race-ethnicity, with Hispanics and blacks having markedly lower levels than whites (Figure 1). Furthermore, after multivariable analysis, we found evidence of interactions between sRAGE and ethnicity on subclinical disease. We have previously reported on the measurement of biomarkers such as hsCRP, LpPLA2, and myeloperoxidase (MPO) in this cohort in relation to white matter disease [22], and we found an association primarily for LpPLA2 and MPO, but not for hsCRP. However, the cohort in this study was much smaller than the present cohort, and we did not find as strong differences in race-ethnicity as for sRAGE. Furthermore, even after adjusting for CRP, LpPLA2 and MPO, there were no appreciable differences in the magnitude of effect of sRAGE on SBI or WMHV, and the race-ethnicity differences remained the same as well.
Previous studies of sRAGE levels have been conducted mainly among homogeneous ethnic populations, focusing mainly on either white or Asian subjects, and have therefore not addressed the race-ethnic variations in sRAGE seen among minority populations [1]. Furthermore, the sRAGE levels seen in the Hispanic and black participants in our study were similar to those associated with vascular disease states in these previous studies. Most recently, in a recent report from the Dallas Heart Study, lower sRAGE levels were seen in blacks compared to Hispanic and whites, but no associations were seen between sRAGE levels by ethnicity and coronary artery disease [30]. However, lower sRAGE levels were found to correlate with increased coronary artery calcification in the entire cohort [30]. There are key differences between our participants and those of the Dallas Heart Study, including that ours is mainly Hispanic, while the Dallas Heart Study population is composed of much lower numbers of Hispanic subjects (~20%), and a higher proportion of blacks. Furthermore, our Hispanic subjects are predominantly from the Dominican Republic, whereas Hispanics in Dallas are predominantly of Mexican origin. Data from the Multi-Ethnic Study of Atherosclerosis has shown cardiovascular disease and risk factors differ among US Hispanic subgroups, in particular with those of Dominican compared to Mexican origin [31].
In comparison to previous studies of white or Asian control participants, white participant in our study displayed very similar sRAGE levels (in the 1000–1200 pg/ml range) [8],[7]. This raises the intriguing possibility that mechanisms such as genetic differences between ethnic groups may affect sRAGE levels. Recently, a number of studies have linked a number of polymorphisms in the RAGE gene with sRAGE levels [32–34], suggesting genetic variation in the RAGE gene itself may be implicated in these ethnic differences. Further evidence from studies in Asian subjects suggest a positive relationship between sRAGE levels and cardiovascular risk [35,36]. However, the vast majority of studies on Asian subject, albeit mainly focused on the measurement of the esRAGE specific isoform, demonstrate and inverse relationship between esRAGE levels and cardiovascular risk [8,37–41]. Whether such an ethnic difference in sRAGE levels do exist in Asian subjects needs to be addressed, as the majority of these studies are limited by the small number of subjects used these studies.
The pathogenesis of subclinical cerebrovascular disease, and especially white matter disease, is not entirely understood. It has been shown that subclinical brain infarcts and white matter hyperintensities predict stroke risk, cognitive impairment, and dementia, providing indirect evidence that white matter disease is indicative of an ischemic process [18,42]. We therefore speculate that in subjects with lower levels of sRAGE, an increased risk for subclinical disease is related to insufficient circulating levels being present to block RAGE-ligand interaction. Moreover, in Hispanics and blacks, among whom lower sRAGE levels are seen, the effect of low sRAGE levels is magnified. The clinical significance of these lower levels of sRAGE seen in minority groups in the northern Manhattan population requires further investigation.
The strengths of our study include the large sample number, inclusion of three race-ethnic groups living in the same community, and the quantitative assessment of white matter disease. The limitations, however, are that the current study is cross-sectional, which limits causal inferences. Also, the single measurements of sRAGE and MRI might not be representative of changes in levels over time. For future studies, serial measurements of sRAGE are needed, to establish whether the associations seen with cerebrovascular disease are more than chance findings. A further limitation is the method of measurement used for sRAGE. This ELISA measures the total soluble pool of sRAGE and does not differentiate between different sRAGE isoforms, resulting from alternative splicing or cleavage of the extracellular domain of RAGE from the cell surface [1]. To fully understand the potential role of these isoforms, future studies should measure these specific sRAGE isoforms separately, as ethnic and genetic differences could exist between levels in individuals. Understanding the individual contribution of alternatively spliced and cleaved RAGE to vascular disease pathogenesis may provide deeper insights into the mechanisms by which RAGE is associated with vascular disease.
In conclusion, our data suggest that lower sRAGE levels may be a biomarker for subclinical cerebral injury, especially in Hispanics and blacks. Further prospective and multi-ethnic studies of the predictive value of sRAGE in relation to cerebral injury are needed.
Acknowledgments
This work is supported by grants from the National Institute of Neurological Disorders and Stroke (R01 NS 29993, R01 48134, K02 NS 059729). Barry Hudson is funded by a Career Development award from the Juvenile Diabetes Research Foundation (JDRF). We would like to acknowledge Robert Delapaz, MD, for clinical readings of the brain MRI scans. We are also grateful to the staff of the Northern Manhattan Study, and in particular the project manager Janet DeRosa.
Footnotes
Publisher's Disclaimer: This is a PDF file of an unedited manuscript that has been accepted for publication. As a service to our customers we are providing this early version of the manuscript. The manuscript will undergo copyediting, typesetting, and review of the resulting proof before it is published in its final citable form. Please note that during the production process errors may be discovered which could affect the content, and all legal disclaimers that apply to the journal pertain.
References
- 1.Kalea AZ, Schmidt AM, Hudson BI. RAGE: a novel biological and genetic marker for vascular disease. Clin Sci (Lond) 2009;116:621–37. doi: 10.1042/CS20080494. [DOI] [PubMed] [Google Scholar]
- 2.Park L, Raman KG, Lee KJ, et al. Suppression of accelerated diabetic atherosclerosis by the soluble receptor for advanced glycation endproducts. Nat Med. 1998;4:1025–31. doi: 10.1038/2012. [DOI] [PubMed] [Google Scholar]
- 3.Muhammad S, Barakat W, Stoyanov S, et al. The HMGB1 receptor RAGE mediates ischemic brain damage. J Neurosci. 2008;28:12023–31. doi: 10.1523/JNEUROSCI.2435-08.2008. [DOI] [PMC free article] [PubMed] [Google Scholar]
- 4.Hudson BI, Carter AM, Harja E, et al. Identification, classification, and expression of RAGE gene splice variants. FASEB J. 2008;22:1572–80. doi: 10.1096/fj.07-9909com. [DOI] [PubMed] [Google Scholar]
- 5.Raucci A, Cugusi S, Antonelli A, et al. A soluble form of the receptor for advanced glycation endproducts (RAGE) is produced by proteolytic cleavage of the membrane-bound form by the sheddase a disintegrin and metalloprotease 10 (ADAM10) FASEB J. 2008;22:3716–27. doi: 10.1096/fj.08-109033. [DOI] [PubMed] [Google Scholar]
- 6.Geroldi D, Falcone C, Emanuele E, et al. Decreased plasma levels of soluble receptor for advanced glycation end-products in patients with essential hypertension. J Hypertens. 2005;23:1725–9. doi: 10.1097/01.hjh.0000177535.45785.64. [DOI] [PubMed] [Google Scholar]
- 7.Falcone C, Emanuele E, D’Angelo A, et al. Plasma levels of soluble receptor for advanced glycation end products and coronary artery disease in nondiabetic men. Arterioscler Thromb Vasc Biol. 2005;25:1032–7. doi: 10.1161/01.ATV.0000160342.20342.00. [DOI] [PubMed] [Google Scholar]
- 8.Katakami N, Matsuhisa M, Kaneto H, et al. Serum endogenous secretory RAGE level is an independent risk factor for the progression of carotid atherosclerosis in type 1 diabetes. Atherosclerosis. 2009;204:288–92. doi: 10.1016/j.atherosclerosis.2008.08.026. [DOI] [PubMed] [Google Scholar]
- 9.Santilli F, Bucciarelli L, Noto D, et al. Decreased plasma soluble RAGE in patients with hypercholesterolemia: effects of statins. Free Radic Biol Med. 2007;43:1255–62. doi: 10.1016/j.freeradbiomed.2007.06.017. [DOI] [PubMed] [Google Scholar]
- 10.Emanuele E, D’Angelo A, Tomaino C, et al. Circulating levels of soluble receptor for advanced glycation end products in Alzheimer disease and vascular dementia. Arch Neurol. 2005;62:1734–6. doi: 10.1001/archneur.62.11.1734. [DOI] [PubMed] [Google Scholar]
- 11.Yilmaz Y, Ulukaya E, Gul OO, et al. Decreased plasma levels of soluble receptor for advanced glycation endproducts (sRAGE) in patients with nonalcoholic fatty liver disease. Clin Biochem. 2009;42:802–7. doi: 10.1016/j.clinbiochem.2009.02.003. [DOI] [PubMed] [Google Scholar]
- 12.Basta G, Sironi AM, Lazzerini G, et al. Circulating soluble receptor for advanced glycation end products is inversely associated with glycemic control and S100A12 protein. J Clin Endocrinol Metab. 2006;91:4628–34. doi: 10.1210/jc.2005-2559. [DOI] [PubMed] [Google Scholar]
- 13.Geroldi D, Falcone C, Minoretti P, et al. High levels of soluble receptor for advanced glycation end products may be a marker of extreme longevity in humans. J Am Geriatr Soc. 2006;54:1149–50. doi: 10.1111/j.1532-5415.2006.00776.x. [DOI] [PubMed] [Google Scholar]
- 14.Montaner J, Perea-Gainza M, Delgado P, et al. Etiologic diagnosis of ischemic stroke subtypes with plasma biomarkers. Stroke. 2008;39:2280–7. doi: 10.1161/STROKEAHA.107.505354. [DOI] [PubMed] [Google Scholar]
- 15.Yokota C, Minematsu K, Tomii Y, et al. Low levels of plasma soluble receptor for advanced glycation end products are associated with severe leukoaraiosis in acute stroke patients. J Neurol Sci. 2009;287:41–4. doi: 10.1016/j.jns.2009.09.013. [DOI] [PubMed] [Google Scholar]
- 16.Park HY, Yun KH, Park DS. Levels of Soluble Receptor for Advanced Glycation End Products in Acute Ischemic Stroke without a Source of Cardioembolism. J Clin Neurol. 2009;5:126–32. doi: 10.3988/jcn.2009.5.3.126. [DOI] [PMC free article] [PubMed] [Google Scholar]
- 17.Vernooij MW, Ikram MA, Tanghe HL, et al. Incidental findings on brain MRI in the general population. N Engl J Med. 2007;357:1821–8. doi: 10.1056/NEJMoa070972. [DOI] [PubMed] [Google Scholar]
- 18.Vermeer SE, Hollander M, van Dijk EJ, et al. Silent brain infarcts and white matter lesions increase stroke risk in the general population: the Rotterdam Scan Study. Stroke. 2003;34:1126–9. doi: 10.1161/01.STR.0000068408.82115.D2. [DOI] [PubMed] [Google Scholar]
- 19.Vermeer SE, Longstreth WT, Jr, Koudstaal PJ. Silent brain infarcts: a systematic review. Lancet Neurol. 2007;6:611–9. doi: 10.1016/S1474-4422(07)70170-9. [DOI] [PubMed] [Google Scholar]
- 20.Sacco RL, Benson RT, Kargman DE, et al. High-density lipoprotein cholesterol and ischemic stroke in the elderly: the Northern Manhattan Stroke Study. JAMA. 2001;285:2729–35. doi: 10.1001/jama.285.21.2729. [DOI] [PubMed] [Google Scholar]
- 21.Nickolas TL, Khatri M, Boden-Albala B, et al. The association between kidney disease and cardiovascular risk in a multiethnic cohort: findings from the Northern Manhattan Study (NOMAS) Stroke. 2008;39:2876–9. doi: 10.1161/STROKEAHA.107.513713. [DOI] [PMC free article] [PubMed] [Google Scholar]
- 22.Wright CB, Moon Y, Paik MC, et al. Inflammatory biomarkers of vascular risk as correlates of leukoariosis. Stroke. 2009;40:3466–71. doi: 10.1161/STROKEAHA.109.559567. [DOI] [PMC free article] [PubMed] [Google Scholar]
- 23.DeCarli C, Murphy DG, Tranh M, et al. The effect of white matter hyperintensity volume on brain structure, cognitive performance, and cerebral metabolism of glucose in 51 healthy adults. Neurology. 1995;45:2077–84. doi: 10.1212/wnl.45.11.2077. [DOI] [PubMed] [Google Scholar]
- 24.DeCarli C, Maisog J, Murphy DG, et al. Method for quantification of brain, ventricular, and subarachnoid CSF volumes from MR images. J Comput Assist Tomogr. 1992;16:274–84. doi: 10.1097/00004728-199203000-00018. [DOI] [PubMed] [Google Scholar]
- 25.DeCarli C, Murphy DG, Teichberg D, et al. Local histogram correction of MRI spatially dependent image pixel intensity nonuniformity. J Magn Reson Imaging. 1996;6:519–28. doi: 10.1002/jmri.1880060316. [DOI] [PubMed] [Google Scholar]
- 26.DeCarli C, Miller BL, Swan GE, et al. Predictors of brain morphology for the men of the NHLBI twin study. Stroke. 1999;30:529–36. doi: 10.1161/01.str.30.3.529. [DOI] [PubMed] [Google Scholar]
- 27.Au R, Massaro JM, Wolf PA, et al. Association of white matter hyperintensity volume with decreased cognitive functioning: the Framingham Heart Study. Arch Neurol. 2006;63:246–50. doi: 10.1001/archneur.63.2.246. [DOI] [PubMed] [Google Scholar]
- 28.Yan SD, Chen X, Fu J, et al. RAGE and amyloid-beta peptide neurotoxicity in Alzheimer’s disease. Nature. 1996;382:685–91. doi: 10.1038/382685a0. [DOI] [PubMed] [Google Scholar]
- 29.Brett J, Schmidt AM, Yan SD, et al. Survey of the distribution of a newly characterized receptor for advanced glycation end products in tissues. Am J Pathol. 1993;143:1699–712. [PMC free article] [PubMed] [Google Scholar]
- 30.Lindsey JB, de Lemos JA, Cipollone F, et al. Association between circulating soluble receptor for advanced glycation end products and atherosclerosis: observations from the Dallas Heart Study. Diabetes Care. 2009;32:1218–20. doi: 10.2337/dc09-0053. [DOI] [PMC free article] [PubMed] [Google Scholar]
- 31.Allison MA, Budoff MJ, Wong ND, et al. Prevalence of and risk factors for subclinical cardiovascular disease in selected US Hispanic ethnic groups: the Multi-Ethnic Study of Atherosclerosis. Am J Epidemiol. 2008;167:962–9. doi: 10.1093/aje/kwm402. [DOI] [PMC free article] [PubMed] [Google Scholar]
- 32.Gaens KH, Ferreira I, van der Kallen CJ, et al. Association of polymorphism in the receptor for advanced glycation end products (RAGE) gene with circulating RAGE levels. J Clin Endocrinol Metab. 2009;94:5174–80. doi: 10.1210/jc.2009-1067. [DOI] [PubMed] [Google Scholar]
- 33.Abdel-Azeez HA, El-Okely AM. Association of the receptor for advanced glycation end products (RAGE) -374 T/A gene polymorphism and circulating soluble RAGE with nephropathy in type 1 diabetic patients. Egypt J Immunol. 2009;16:95–106. [PubMed] [Google Scholar]
- 34.Jang Y, Kim JY, Kang SM, et al. Association of the Gly82Ser polymorphism in the receptor for advanced glycation end products (RAGE) gene with circulating levels of soluble RAGE and inflammatory markers in nondiabetic and nonobese Koreans. Metabolism. 2007;56:199–205. doi: 10.1016/j.metabol.2006.09.013. [DOI] [PubMed] [Google Scholar]
- 35.Nakamura K, Yamagishi S, Adachi H, et al. Serum levels of sRAGE, the soluble form of receptor for advanced glycation end products, are associated with inflammatory markers in patients with type 2 diabetes. Mol Med. 2007;13:185–9. doi: 10.2119/2006-00090.Nakamura. [DOI] [PMC free article] [PubMed] [Google Scholar]
- 36.Yamagishi S, Adachi H, Nakamura K, et al. Positive association between serum levels of advanced glycation end products and the soluble form of receptor for advanced glycation end products in nondiabetic subjects. Metabolism. 2006;55:1227–31. doi: 10.1016/j.metabol.2006.05.007. [DOI] [PubMed] [Google Scholar]
- 37.Koyama H, Shoji T, Yokoyama H, et al. Plasma level of endogenous secretory RAGE is associated with components of the metabolic syndrome and atherosclerosis. Arterioscler Thromb Vasc Biol. 2005;25:2587–93. doi: 10.1161/01.ATV.0000190660.32863.cd. [DOI] [PubMed] [Google Scholar]
- 38.Katakami N, Matsuhisa M, Kaneto H, et al. Decreased endogenous secretory advanced glycation end product receptor in type 1 diabetic patients: its possible association with diabetic vascular complications. Diabetes Care. 2005;28:2716–21. doi: 10.2337/diacare.28.11.2716. [DOI] [PubMed] [Google Scholar]
- 39.Katakami N, Matsuhisa M, Kaneto H, et al. Serum endogenous secretory RAGE levels are inversely associated with carotid IMT in type 2 diabetic patients. Atherosclerosis. 2007;190:22–3. doi: 10.1016/j.atherosclerosis.2006.06.019. [DOI] [PubMed] [Google Scholar]
- 40.Choi KM, Yoo HJ, Kim HY, et al. Association between endogenous secretory RAGE, inflammatory markers and arterial stiffness. Int J Cardiol. 2009;132:96–101. doi: 10.1016/j.ijcard.2007.10.047. [DOI] [PubMed] [Google Scholar]
- 41.Katakami N, Matsuhisa M, Kaneto H, et al. Endogenous secretory RAGE but not soluble RAGE is associated with carotid atherosclerosis in type 1 diabetes patients. Diab Vasc Dis Res. 2008;5:190–7. doi: 10.3132/dvdr.2008.031. [DOI] [PubMed] [Google Scholar]
- 42.Jeerakathil T, Wolf PA, Beiser A, et al. Stroke risk profile predicts white matter hyperintensity volume: the Framingham Study. Stroke. 2004;35:1857–61. doi: 10.1161/01.STR.0000135226.53499.85. [DOI] [PubMed] [Google Scholar]