Abstract
BACKGROUND
Safe, accurate methods permitting simultaneous and/or repeated measurement of red blood cell (RBC) survival (RCS) are important to investigate pathophysiology and therapy of anemia. Methods using chromium 51 (51Cr) -labeled RBCs are unacceptable for infants, children, and pregnant women. We report RCS measured in vivo using RBCs labeled with several densities of biotin (BioRBCs).
STUDY DESIGN AND METHODS
Aliquots of autologous RBCs from eight healthy adult subjects were labeled separately at four discrete biotin densities, mixed, and infused. The proportion of each population of BioRBCs circulating was determined serially by flow cytometry over 20 weeks. For each population, RCS was assessed by the following: 1) post-transfusion BioRBC recovery at 24 hour (PTR24); 2) time to decrease to 50% of the enrichment at 24 hours (T50); and 3) mean potential lifespan (MPL).
RESULTS
Among the four BioRBC densities, no significant differences in PTR24 were observed. T50 and MPL were similar for the two lowest BioRBC densities. In contrast, the two highest BioRBC densities demonstrated progressively decreased T50 and MPL.
CONCLUSION
RBCs labeled at four biotin densities can be used to independently and accurately measure PTR24 and two lowest biotin densities can accurately quantitate long-term RCS. This method provides a tool for investigating anemia in infants, fetuses, and pregnant women with the following advantages over the standard 51Cr method: 1) study subjects are not exposed to radiation; 2) small blood volumes (e.g., 20 μL) are required; and 3) multiple independent RCS measurements can be made simultaneously in the same individual.
Circulating red blood cell (RBC) kinetics are best measured directly by short- and long-term survival of the RBC populations of interest – in contrast to indirect assessment by mathematical modeling.1 Direct assessment of red cell survival (RCS) requires the ability to distinguish RBC populations of interest from other RBCs circulating in the bloodstream, which can be accomplished by labeling the RBC populations of interest and then measuring the relative concentration of the labeled RBCs.
For decades, the method based on RBCs labeled with the radionuclide chromium-51 (51Cr) has been the accepted reference method (i.e., the “gold standard”) for determination of RBC volume and RCS.2 Limitations of the 51Cr method include the following: 1) only one population of RBCs can be studied at a time; 2) elution of 51Cr from RBCs (approximately 2% per day3) has substantial intersubject variation, thereby introducing error in measurement of RCS; and 3) radiation exposure in vulnerable populations such as fetuses, children, and pregnant women, is considered potentially dangerous for clinical studies and unethical for research purposes.4 Although use of nonradioactive chromium (e.g., 50Cr) eliminates radiation exposure, the associated costs and technical difficulties remain significant impediments.5–8 Even if these impediments could be overcome, problems of Cr elution and limitation to single RBC population studies remain.
Needed studies of RBC circulating kinetics in infants, fetuses, and pregnant women have been impeded by lack of a safe, accurate, and practical RBC label.4 Methods that detect different RBC populations on the basis of antigenic differences permit study of only allogeneic RBCs (i.e., not autologous). Methods detecting fetal versus adult hemoglobin content in RBCs can be used for only one transfusion of allogeneic RBCs.9 A reliable and feasible method for measuring RCS that does not require radiolabeling, while permitting multiple RCS measurements using either autologous or allogeneic blood, would provide a valuable tool for defining the physiology, pathophysiology, and responses to treatment for a variety of conditions in these vulnerable patient populations in which anemia and RBC transfusions are involved.
Here, we report a method for the simultaneous and independent measurements of RCS using multiple densities of BioRBCs. Our hypothesis was that short-term and long-term RCS, measured using RBCs labeled with increasingly greater densities of biotin, would agree with RCS determined using RBCs labeled with the lowest density – our “gold standard” – which had been previously validated against the 51Cr method.10
MATERIALS AND METHODS
Human studies
All studies were approved by the University of Iowa Committee on Research on Human Subjects (study performance site) and the institutional review board of the University of Arkansas for Medical Sciences (study analysis site). Written informed consent was obtained from each subject as part of the ongoing informed consent process.
Study population
Inclusion criteria included the following: 1) 18 to 65 years of age; 2) weight of more than 50 kg; 3) hemoglobin level of 125 g/L or more; and 4) negative direct antiglobulin test (DAT). Exclusion criteria included the following: 1) presence of an active chronic illness; 2) consumption of biotin supplements or raw eggs within 30 days; 3) blood donation in the previous 8 weeks; 4) blood loss in the previous 8 weeks due to epistaxis, gastrointestinal bleeding, trauma, diagnostic phlebotomy (> 30 mL), or other bleeding; 5) premenopausal women, to avoid menstrual blood loss; and 6) treatment with antibiotics in the week prior to initiating study participation to avoid suppression of erythropoiesis, which may accompany infection.
Eight healthy adults (five women) participated. Determination of red blood cell volume (RCV) by the BioRBC method in these same subjects has been previously reported.11 Briefly, in vivo circulating RCV was determined for each subject at each of three post-transfusion times (10, 20 and 60 minutes) simultaneously and independently by enumeration of autologous RBCs labeled at four discrete densities of biotin and calculation of the RCV using the dilution principle.
Age ranged from 23 to 62 years. Body mass ranged from 57.2 to 115.2 kg. Throughout the 20-week study period, hematologic blood testing was obtained at the intervals described below; neither blood hemoglobin concentration nor reticulocyte count changed importantly (Table 1). Likewise, RBC indices including hematocrit, mean red cell volume, and red cell distribution width changed little during the study (data not shown). These data provide evidence that the subjects remained in steady-state erythropoiesis during the study.
TABLE 1.
Monthly mean (± standard deviation) hemoglobin and reticulocyte counts
| Pre-Study | Week 4 | Week 8 | Week 12 | Week 16 | Week 20 | |
|---|---|---|---|---|---|---|
| Hemoglobin (g/L) | 140 ± 5 | 140 ± 6 | 141 ± 7 | 142 ± 6 | 142 ± 6 | 141 ± 6 |
| Retic count (× 109/μL) | 73 ± 34 | 64 ± 20 | 61 ± 19 | 58 ± 17 | 63 ± 17 | 60 ± 25 |
Study protocol
In each subject, aliquots of autologous RBCs were labeled with biotin at four discrete densities (see below), mixed together, and infused. Survival of each population of BioRBCs was determined at 20 minutes, at 24 hours, and at one- to two-week intervals until the percentage of that population had decreased to less than 0.06% (about 4% of the original enrichment measured at 20 minutes following infusion).
Biotinylation of RBCs
Blood was drawn from study subjects as previously described.11 Briefly, 250 mL of blood was obtained by venipuncture and collected into a citrate-phosphate-dextrose solution containing collection bag (Baxter Healthcare Corporation, Fenwal Division, Deerfield, IL). The RBCs were biotinylated to produce four distinct densities of BioRBCs as previously described.12 Plasma was removed from four 50-mL aliquots of the anticoagulated blood; RBCs were washed twice to remove residual plasma and then labeled with biotin at increasing concentrations of sulfo-succinimido-biotin (Pierce Chemical Co., Rockford, IL).12 As previously reported in our in vitro studies, a linear relationship between the density of biotin labels/RBC and the concentration of sulfo-succinimido-biotin reagent/mL of RBC was observed.13
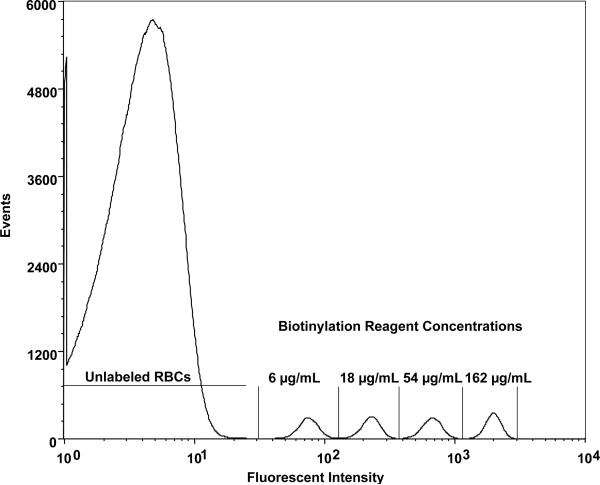
A reagent concentration of 6 μg/mL of RBC (17 nmol/mL of RBC) was chosen as the lowest biotinylation density because complete separation for this population of biotinylated RBCs from the endogenous fluorescence of unlabeled RBCs was observed in the population histogram of RBCs complexed with the fluorescent dye (Fig. 1). The biotinylation reagent concentration was increased in three-fold increments (i.e., 18, 54, and 162 μg of sulfo-succinimido-biotin/mL = 53, 158, and 474 nmol/mL, respectively) relative to the RBCs labeled at the 6 μg/mL (18 nmol/mL) of RBC. Choice of this increment balanced two opposing objectives: 1) avoid overlap between the adjacent populations in the fluorescent intensity histogram (Fig. 1), and 2) minimize the increments in reagent concentration in order to maximize the number of RBC populations studied. There was a limit on the highest concentration of biotinylation reagent because our previous experience (unpublished data) documented that reagent concentrations greater than approximately 250 μg/mL of RBC shortened long-term RCS. After incubation for 30 minutes at the four biotinylation reagent concentrations, each biotinylation reaction was stopped by washing the four RBC populations twice. This also served to remove remaining biotinylating reagent and reaction byproducts.
Fig. 1.
Flow cytometry histogram (Subject 1, Day 3 of survival) relating number of RBCs enumerated to log of fluorescent intensity for four populations of biotinylated human RBCs demonstrates the complete separation observed between each biotinylated RBC population and from the unlabeled RBC peak. “6, 18, 54, and 162 μg/mL” denote the populations of biotinylated RBCs produced by successive three-fold incremental increased of the biotinylation reagent, sulfo-succinimido-biotin.
Fig. 2.
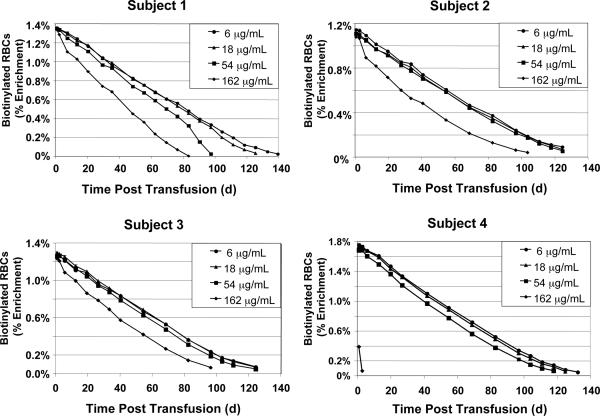
RBC survival for Subjects 1–4. RCS determined independently and simultaneously from the four populations of autologous BioRBC densities is depicted for Subjects 1–4.
Post-transfusion testing for hemolysis and for antibodies to BioRBCs
Prior to transfusion of the mixture of BioRBCs and every 4 weeks for approximately 20 weeks (see below), 1 mL of venous blood was collected from subjects for determination of hemoglobin, hematocrit, reticulocyte count, DAT, plasma free hemoglobin concentration, plasma haptoglobin concentration, and detection of antibodies to biotinylated antibodies. Plasma free hemoglobin concentration was measured spectrophotometrically. Plasma haptoglobin concentration was measured immuno-turbometrically. Free plasma hemoglobin, haptoglobin, and DAT testing were performed at the University of Iowa Hospital using commercial kits (Roche Diagnostics, Indianapolis, IN) and a Roche/Hitachi Modular Analyzer (Laval, QC, Can). In testing for antibodies to BioRBCs, plasma samples were tested using an antiglobulin technique against aliquots of group O RBCs from an adult human donor in which one aliquot was biotinylated and another was not (i.e., test and control RBCs) as previously described.14 A positive reaction was defined as visible agglutination in a test tube system. In a separate tube, RBCs with the K1 antigen (Kell) were reacted with anti-K1 in an antiglobulin phase, serving as a positive control.
Autologous blood transfusion and sampling
Weighed aliquots of 30 to 50 mL of each of the four populations of BioRBCs were mixed together and were infused into an antecubital vein over three to four minutes. The exact volume of the blood mixture infused was determined gravimetrically. The RBC counts (RCC) expressed as the total number of RBCs/μL for the populations of biotinylated RBCs were measured before and after mixing, prior to infusion, and in the timed venous blood samples using a hematology analyzer (Sysmex SE2100, Sysmex Corp, Kobe, JP). The end of the BioRBC infusion was designated Time 0 for determining results.
The amount of each BioRBC population added to the mixture was chosen to produce a final percentage of each population of about 1.5% of the total number of RBCs in each subject's circulation. One mL of venous blood was drawn at 20 minutes, 24 hours, and subsequently at one- to two-week intervals. Each distinct population of BioRBCs was enumerated by flow cytometry as previously described.15 Blood sampling continued until the percentage of BioRBCs remaining was below the lower limit of quantitation for each population of BioRBCs (< 0.06%). This lower limit of quantitation was defined empirically using conservative criteria and demanding conditions as follows. Using sheep RBCs (which are not biotinylated as readily as human RBCs)12 and twofold rather than threefold biotinylation reagent increments (which produce about 25% overlap of peaks),16 four BioRBC densities (18, 36, 72, and 144 μg/ml) were prepared in triplicate and serial dilutions of the labeled cells were prepared at BioRBCs percentages from 0.25% to 0.0156%. The overall mean accuracy was −6% (underestimate), and the mean precision was ±8%; at dilutions greater than 0.0156%, both accuracy and precision deteriorated. We chose four-fold greater than 0.0156% as the lower limit of quantitation.
Determination of RCS parameters
PTR 24
For each population of biotinylated RBCs, PTR24 was determined as the percentage of biotin-labeled cells remaining in the circulation 24 hours after transfusion relative to the 20-minute post-infusion blood sample. This time was chosen for convenience; extrapolation of 10, 20, and 60 minute sample time enrichments to Time 0 did not produce a significant change.
T50
For each population of BioRBCs, T50 was defined as the time when 50% of BioRBCs remained in the circulation relative to the percentage in circulation at 20 minutes. Rarely did any sample have an enrichment of a particular population that was exactly equal to 50% of the proportion of BioRBCs at 24 hours. Moreover, even should that rare event occur, choosing a single point would have allowed the analytical uncertainty in the assay to disproportionately influence the T50. To optimally determine the T50 for each population of BioRBCs, interpolation from a four point linear interpolation (the two nearest points with less than 50% loss and the two nearest points with greater than 50% loss) was used to determine the point at which the percentage of each population of BioRBCs population had decreased to 50% of the value at 24 hours.
MPL
For each population of BioRBCs, MPL was defined as the mean time when 100% of the biotin-labeled cells disappeared from the circulation – a measure that only approximates the RBC life span because it is impossible to precisely quantitate the final few RBCs as they are removed from the bloodstream. To determine MPL for each population of biotinylated RBCs, the percentage of each population remaining in circulation was plotted against the time after transfusion. In this study, the survival curves were fit by linear least-squares regression curve until about 10% of each population of BioRBCs remained; the extrapolation of this linear regression of all data points with greater than 10% remaining to the intersection with the time axis was designated the mean potential lifespan (MPL).
Because greater than 98% the BioRBCs remain in circulation for the first 24 hours, choice of 20 minutes for the reference time point is some what arbitrary. Choice of the 10-minute point or 60-minute point produced very similar results. The notable exception is density 162 μg/mL for Subject 4 (see Results).
Statistical analysis
Central tendency and variability of RCS parameters (PTR24, T50, or MPL) for each population of BioRBCs were expressed as the mean ± 1 standard deviation (SD). Differences in means for RCS parameters among the populations of biotinylated RBCs were tested for significance by one-way ANOVA with repeated measures. If differences were detected, post hoc testing was performed using Fisher's test with Bonferroni correction for multiple comparisons. These statistical analyses were performed with software (Statview, Abacus Concepts, Berkeley, CA). Significance was chosen as p ≤ 0.05.
RESULTS
Short-term RCS: PTR24
For the eight study subjects (excluding density 162 for Subject 4 as discussed below), the mean PTR24 values were not different among the four populations of fresh autologous BioRBCs. Expressed as percent of the 20-minute value, the mean ± standard deviation (SD) PTR24 values were 99.0 ± 3.2% for RBCs biotinylated with 6 μg/mL, 97.9 ± 3.6% for 18 μg/mL, 98.4 ± 2.1% for 54 μg/mL, and 96.3 ± 5.2% for 162 μg of biotinylating reagent/mL of RBC. Because the most of removal of BioRBCs labeled at density 162 for Subject 4 was occurred before 20 minutes, inclusion of this datum changes the mean PTR24 for density 162 very little (96.7 ± 4.9%) and did not change results of the statistical analysis.
Long-term RCS: T50 and MPL
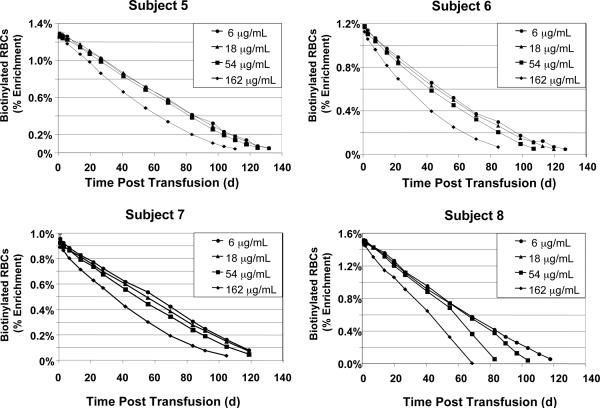
Figs. 2 and 3 depict the survival curves for the four populations of BioRBCs for each of the eight subjects. Examination of the survival curves revealed many similarities among subjects, but there were also a few striking differences. For most subjects, the survival curves encompassing most of the life span of each population of BioRBCs were well fit by linear least-squares regression until only about 10% of each population remained in the circulation. In all subjects, survival of RBCs biotinylated at 6 and 18 μg/mL was nearly identical to at least 100 days. Thereafter, survival of RBCs biotinylated at 6 and 18 μg/mL exhibited a curvilinear approach to the time axis, as expected, given the well-established variability of several days in the survival of RBCs released from the marrow on the same day.
Fig. 3.
RBC survival for Subjects 5–8. RCS determined independently and simultaneously as per Fig. 2.
For all eight subjects, the RBCs biotinylated at 162 μg/mL did not survive as long in the circulation as the 6 and 18 μg/mL populations; the 54 μg/mL populations exhibited intermediate shortening of RCS with variability among subjects (Figs. 2 and 3). These observations are consistent with our a priori hypothesis that heavier biotinylation can cause shortening of long-term RBC survival and, hence, when used to measure long-term RCS, can introduce artifactual underestimates in RCS of RBC populations of interest.
In Subject 4, the disappearance 162 μg/mL BioRBCs was far more rapid than in any other subject (Fig. 2). Although the number of 162 μg/mL RBCs should have produced an initial enrichment of about 1.7% (similar to the other three populations of biotinylated RBCs) in Subject 4, three-fourths of these BioRBCs were removed from circulation by 20 minutes. Moreover, this most heavily biotinylated population was undetectable after only seven days. Because these results were so strikingly different from the other subjects, the 162-μg/mL data for Subject 4 were excluded from the 162 group statistics (Fig. 4), and all data from Subject 4 were excluded from the ANOVA described below.
Fig. 4.
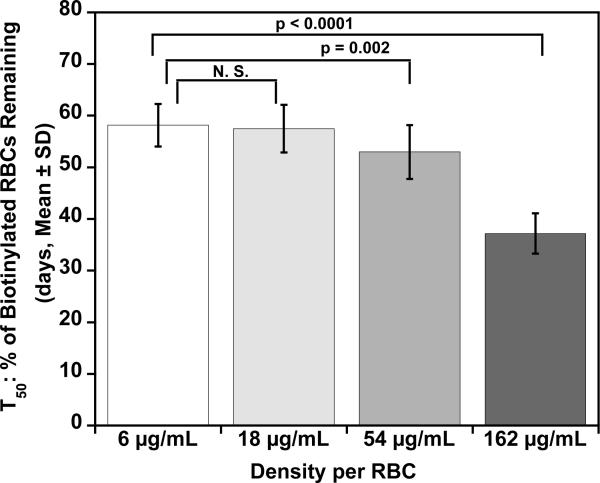
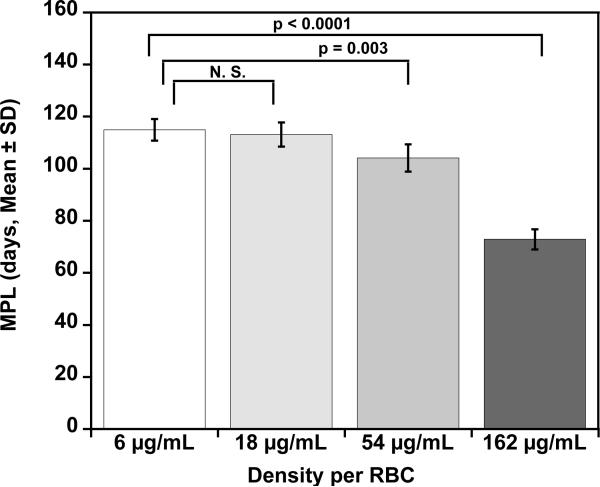
Mean T50 and MPL for each density of BioRBCs. Mean T50 values (A) for the four populations of autologous BioRBCs agree for the two lowest densities but are progressively shorter for the two highest densities. Mean MPL values (B) for the four populations of autologous BioRBCs agree for the two lowest densities but are progressively shorter for the two highest densities.
The initial observations concerning long-term RCS were confirmed by statistical comparisons of group means for T50 and MPL. For the two lowest biotinylation densities (6 and 18 μg/mL), neither mean T50 nor the mean MPL were significantly different (Fig. 4). In contrast, the two highest biotinylation densities showed progressive decreases in T50 and MPL, indicative of more rapid elimination and artifactually shortened RCS. For the two lowest biotinylation densities, the mean T50 values (58 ± 4 d and 57 ± 4 d, respectively) were similar to values calculated from a previous study that used a single biotin density (55 ± 4 d) or the elution-corrected 51Cr method (52 ± 4 d).10 Likewise, for the two lowest biotinylation densities, mean MPL (115 ± 8 d and 113 ± 9 d, respectively) were similar to values reported from a study that used a single biotin density (103 ± 8 d) or the elution corrected 51Cr method (116 ± 16 d).10 The MPL values are approximately twice those of the T50. This is not surprising because the survival curves are well modeled by a linear regression until only 10% to 15% of the labeled RBCs remain in circulation.
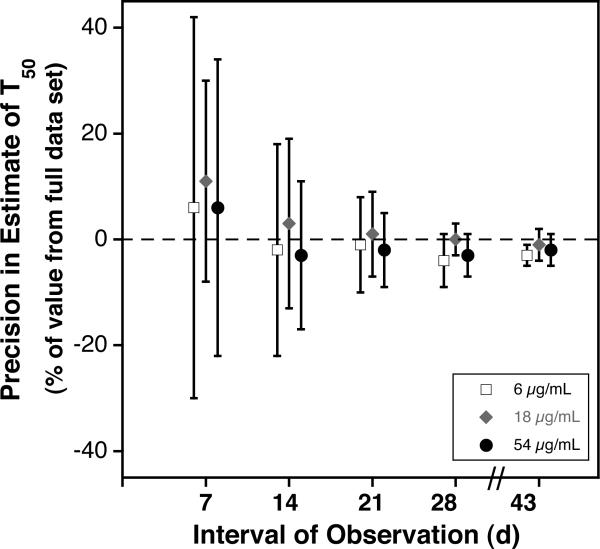
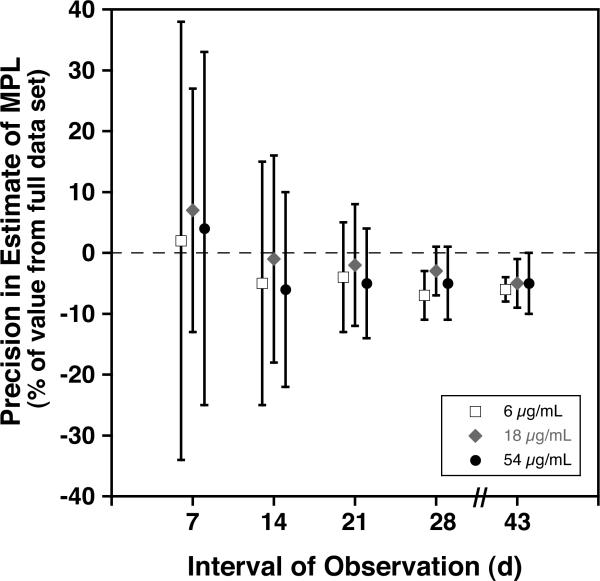
We sought to assess the effect on the precision of the estimates of T50 and MPL using reduced intervals of observation. To accomplish this, we reanalyzed the data sets for the subjects reported here, limiting the linear extrapolations to the data available for the first 7, 14, 21, 28, and 43 days of observation. Results provided in Fig. 5 A and B provide evidence that the precision of estimates for T50 and MPL is substantially reduced unless at least 28 days of data are used. For densities 6, 18, and 54 using 28 days, the percent differences from the estimate using the full data set (mean ± 1SD) were −2% ± 4% and −5% ± 5%, respectively for T50 and MPL. These percent differences are within the analytical error of the method (± 5%).
Fig. 5.
Effect of Length of Observation on Precision of Estimates of Long-Term RCS. For each the three lowest densities of autologous BioRBCs, mean ± 1 standard deviation of the difference in T50 (A) and in MPL (B) from the value obtained from the full data set is plotted against the interval of observation.
Tests for hemolysis of transfused autologous BioRBCs
Serial blood samples were drawn before transfusion of BioRBCs (range 6 to 26 hours) and at 60 minutes and 24 hours after transfusion of BioRBCs to detect acute changes in blood hemoglobin concentration, reticulocyte count, plasma free hemoglobin, and haptoglobin. In additional, blood hemoglobin and reticulocyte count were measured every one to two weeks. Comparison of pre- and post-transfusion values did not suggest hemolysis (Tables 1 and 2) including Subject 4, despite the rapid removal of RBCs biotinylated at 162 μg/mL.
TABLE 2.
Plasma haptoglobin concentrations before, 1, and 24 hours after transfusion of BioRBCs
| Subject | Time | Plasma free hemoglobin (mg/dL) | Haptoglobin |
|---|---|---|---|
| 1 | Before transfusion | 6 | 70 |
| 60 minutes | 83 | 52 | |
| 24 hours | 10 | 61 | |
| 2 | Before transfusion | 3 | 71 |
| 60 minutes | 11 | 66 | |
| 24 hours | 7 | 65 | |
| 3 | Before transfusion | 29 | 32 |
| 60 minutes | 54 | 38 | |
| 24 hours | 27 | 49 | |
| 4 | Before transfusion | 7 | 85 |
| 60 minutes | 9 | 70 | |
| 24 hours | 10 | 72 | |
| 5 | Before transfusion | 11 | 86 |
| 60 minutes | 8 | 71 | |
| 24 hours | 5 | 89 | |
| 6 | Before transfusion | 0 | <20 |
| 60min | 40 | <20 | |
| 24 hours | 2 | <20 | |
| 7 | Before transfusion | 22 | 77 |
| 60 minutes | 5 | 64 | |
| 24 hr | 29 | 80 | |
| 8 | Before transfusion | 3 | 114 |
| 60 minutes | 25 | 95 | |
| 24 hours | 7 | 108 |
Laboratory normal ranges are 0–5 mg/dL for plasma free hemoglobin and 30 to 200 mg/dL for plasma haptoglobin.
Subject 6 is of interest because all plasma haptoglobin concentrations are undetectable, including the pre-transfusion value. The subject had no history of hemolysis nor did members of the subject's family. This subject was not of Japanese ancestry, and hence congenital ahaptoglobinemia was not a likely explanation. The subject had a normal appearance, general health history, blood hemoglobin concentration, and reticulocyte count. Importantly, MPL and T50 were normal and the shape of the survival curve was similar to the other subjects (Fig. 2 and 3), providing evidence against significant chronic hemolysis.
Antibody formation to transfused autologous BioRBCs
Blood samples obtained monthly for four months were assayed for antibodies to BioRBCs. Only Subject 1 developed a transient positive test for antibody to BioRBCs. This female subject had no detectable antibody until week 12 at which point she developed weakly (+/−) positive antibodies; the strength of the reaction remained weakly positive through the end of the study. When next tested at 11 months post-transfusion, antibodies to BioRBCs had disappeared. The RCS was not altered noticeably in Subject 1 by the presence of this antibody, similar to previous reports.14
DISCUSSION
In the 1960's, concerns were raised about exposing fetuses, children, and pregnant women to radiation, and use of 51Cr and other radioisotopes was largely abandoned, greatly limiting subsequent investigations.4 Although methods based on RBC antigen mismatches between donors and recipients9 or the dilution of RBCs containing hemoglobin F in fetal and infant recipients by donor RBCs containing hemoglobin A are sufficiently sensitive for RBC volume studies post-transfusion, few studies in infants have been reported using either method17–20 and none in fetuses. Moreover, no RCS studies have been reported in infants, with only a few semi-quantitative studies in fetuses.21 There have been a few RCS studies of fetal erythrocytes in maternal circulation using fetal-maternal mismatched RBC antigens.22
For several reasons, biotin labeling of RBCs provides an important tool to study RBC physiology, anemia, and the response to RBC transfusions in fetuses, infants, children and pregnant women. Biotin labeling of RBCs has been safely applied in studies of circulating RBC kinetics.23 As with 51Cr, biotin permits labeling of either allogeneic or autologous RBCs and is sufficiently sensitive to perform RBC kinetic studies in fetuses and very low birth weight neonates. Unlike RBC labeling with 51Cr, biotin labeling of RBCs has the following additional advantages: 1) radiation exposure is avoided; 2) no error is introduced by label loss; and 3) multiple populations of RBCs can be studied simultaneously in the same individual by labeling with biotin at different densities.11,16,24,25 An important caveat here is that two RBC populations can be labeled with two different long-lived radionuclides, permitting the tracking of RCS in individuals for whom radiation exposure is not an issue. In addition, the biotin RBC labeling method is practical because 1) the required biotinylation reagents are inexpensive and commercially available, 2) the required measurement and synthesis equipment (a flow cytometer and sterile hood) are readily available, and 3) technician time required for analysis is modest.10,25 The present studies document that results of PTR24 measurements are nearly identical when assessed by separate populations of RBCs labeled with biotin at densities less than or equal to 162 μg/mL. We also found that that results of long-term RCS measurements are nearly identical when assessed by separate populations of RBCs labeled with biotin at densities less than or equal to 18 μg/mL. Hence, labeling of RBCs at discrete biotin densities provides a tool for measuring RCS of multiple separate populations of BioRBCs simultaneously without radiation exposure.
Multiple distinct populations of BioRBCs can be reproducibly and predictably prepared, transfused, and enumerated individually in vivo.12 10 Our observation that the two lowest densities had both short-term and long-term RCS that were nearly identical and that short-term and long-term RCS values were similar to those reported using other methods, provides evidence that biotinylation of RBCs at these densities does not injure RBCs, at least to the extent of measurably shortening RCS. We conclude that these two densities provide accurate quantitation of RCS. Using these two lowest densities, RCS of two allogeneic or autologous RBC populations can be determined simultaneously in the same subject. For example, PTR24 and long-term RCS of both fresh and stored RBCs from the same donor could be measured in the same subject when two RBC transfusions are given a few weeks apart. Moreover, RCS of RBCs from an allogeneic donor and harvested from autologous placental blood could be compared in the same infant.
Of particular note is the rapid removal of the RBCs biotinylated at 162 μg/mL for Subject 4. We have no explanation for this phenomenon. The observation that similar rapid removal of 162 μg/mL BioRBCs was seen is the subsequent study repeated in this same individual (again but not the lower biotin densities) suggests a biologic mechanism specific to the Subject, rather than a technical error in the study. In a pilot study, we saw rapid removal of RBCs biotinylated at densities greater that 162 μg/mL in another subject (data not shown). We speculate that biotinylation density greater than 250 μg/mL likely will lead to rapid removal of BioRBCs in a greater proportion of individuals.
The present results add to previous studies using BioRBCs to assess RCS in animals and in humans.23,26–29 There is currently no evidence for toxicity from the biotin label. Biotin has been administrated intravenously and orally in amounts several orders of magnitude higher than the amount used here without any reported toxic effects.30 Notwithstanding, we feel that BioRBCs should be infused into research subjects or patients with a positive direct antibody test against BioRBCs only with very careful supervision including the following a physician present by the bedside and medical precautions appropriate for an anaphylactic reaction, which we think this is very unlikely.
The biotin method using low biotin biotinylation densities and flow cytometric detection allows tracking of RBC survival than the 51Cr method. Elution rates for 51Cr method vary among individuals; in our hands, this has limited accuracy of estimates of survival.10, Assuming an enrichment similar to that used in the study presented here (approximately 2%), flow cytometric enumeration allows tracking of disappearance of at least 97% of BioRBCs. This greater sensitivity arises from the large linear dynamic range of flow cytometers. Reinfusion of labeled cells of a volume as little 0.05% is needed for measuring circulating RCV.11 However, duration of transfusion medicine studies in very low birth weight infants is often limited to the time during which these neonates are inpatients in a tertiary referral, neonatal, intensive care unit. Moreover, given the considerable effort and expense of studies in which RCS is followed though most of the MPL, we assessed the accuracy of determining T50 and MPL using reduced intervals of observation. For the three lowest biotin densities, reducing the interval of observation to the first four weeks does not introduce a meaningful bias in the group mean values of long-term RCS, and the precision as judged by the group standard deviation of the error relative to the value from the full data sets is similar to the analytical error of the method (± 5%).11 From a feasibility standpoint, we can successfully enumerate one million RBCs in a population histogram using as little as 15 μL of blood per sample for RCS studies. To follow the RCS for the minimum 28 days (instead of ≥100 days), an enrichment of as little as 0.15% would still yield acceptable counting statistics through 28 days. Thus, for an adult, as little as 5 mL and, for a 1000 g infant, as little as 70 μL of 100% labeled, single density BioRBCs would suffice for short- and long-term RCS quantitation.
In summary, this study documents that RBCs labeled with biotin at different densities can be used to study RCS of multiple RBC populations simultaneously and/or sequentially in adult humans. Survival of RBCs based on enumeration of biotinylated RBCs using flow cytometry is linear – establishing that the research subjects were in an erythropoetic steady state. The RBC survival data presented here agree well with the published observations of others. The PTR24 of 99% for each of the biotin densities is quite similar to the 96%-PTR24 reported by Mollison et al. using 51Cr31 and the 98.8%-PTR24 reported by Bentley et al. using 51Cr.32 Likewise, the mean MPL obtained using the two lowest densities (115 ± 8 d and 113 ± 9 d, respectively) were similar to those reported using 51Cr by us (116 ± 16 d)10 and others (Mollison et al.,31 115 days, and Bentley et al.,32 110 ± 21 days). The biotin label method is safe and offers advantages over the standard 51Cr method that extend beyond its use in pregnant women, neonates, infants, and children.
Acknowledgements
This work was supported by the Thrasher Research Fund 02825-3, the National Institutes of Health (NIH) Program Project Grant P01 HL046925, and Grant UL1RR024979 from the National Center for Research Resources (NCRR), a part of the NIH. Its contents are solely the responsibility of the authors and do not necessarily represent the official views of the CTSA NIH, or Thrasher Research Fund. We also thank the research nurses in Iowa's CRU, and Brandy VanDenBerg, Research Assistant to Dr. Mock, for providing editorial assistance to the authors and for facilitating the administrative and IRB aspects of the study. The Sysmex XE-2100 automatic hematology analyzer used in this study was generously provided on an on-loan basis from Sysmex Corporation, Kobe, Japan.
Abbreviations
- BioRBC
biotinylated red blood cells
- 51Cr
chromium 51
- DAT
direct antibody test
- MPL
mean potential red blood cell life span in circulation
- PTR24
post transfusion recovery of red blood cells after 24 hours in the circulation
- RCC
red blood cell count
- RCS
red blood cell survival
- RCV
red blood cell volume
- T50
time to disappearance of 50 percent of the labeled red blood cells from the circulation
Footnotes
Conflict of interest The authors declare that they have no conflicts of interest relevant to the manuscript submitted to TRANSFUSION.
REFERENCES
- 1.Freise KJ, Widness JA, Veng-Pedersen P. Erythropoietic response to endogenous erythropoietin in premature very low birth weight infants. J Pharmacol Exp Ther. 2010;332:229–37. doi: 10.1124/jpet.109.159905. http://www.ncbi.nlm.nih.gov/entrez/query.fcgi?cmd=Retrieve&db=PubMed&dopt=Citation&list_uids=19808699. [DOI] [PMC free article] [PubMed] [Google Scholar]
- 2.International Committee for Standardization in Haematology Recommended methods for radioisotope red-cell survival studies. Br J Haematol. 1980;45:659–66. doi: 10.1111/j.1365-2141.1980.tb07189.x. [DOI] [PubMed] [Google Scholar]
- 3.Mollison PL, Engelfriet CP, Contreras M. Chapter 4: The transfusion of red cells. In: Mollison PL, Engelfriet CP, Contreras M, editors. Blood Transfusion in Clinical Medicine. Blackwell Scientific Publications; London: 1987. pp. 99–115. [Google Scholar]
- 4.Brugnara C, Platt OS. The Neonatal Erythrocyte and Its Disorders. In: Nathan DG, Oski FA, editors. Nathan and Oski's Hematology of Infancy and Childhood. W. B. Saunders Company, Inc.; Philadelphia: 2003. pp. 19–55. [Google Scholar]
- 5.Faxelius G, Raye J, Gutberlet R, Swanstrom S, Tsiantos A, Dolanski E, Dehan M, Dyer N, Lindstom D, Brill AB, Stahlman M. Red cell volume measurements and acute blood loss in high-risk newborn infants. J. Pediatr. 1977;90:273–81. doi: 10.1016/s0022-3476(77)80650-1. [DOI] [PubMed] [Google Scholar]
- 6.Silver HM, Seebeck M, Carlson R. Comparison of total blood volume in normal, preeclamptic, and nonproteinuric gestational hypertensive pregnancy by simultaneous measurement of red blood cell and plasma volumes. Am J Obstet Gynecol. 1998;179:87–93. doi: 10.1016/s0002-9378(98)70255-8. http://www.ncbi.nlm.nih.gov/entrez/query.fcgi?cmd=Retrieve&db=PubMed&dopt=Citation&list_uids=9704770. [DOI] [PubMed] [Google Scholar]
- 7.Silver HM, Weinstein EA, Cowett RM, Patterson KY, Veillon C. Measurement of red blood cell mass by labelling with enriched stable isotopes of chromium. J. Soc. Gynecol. Invest. ABST. 1995;2 [Google Scholar]
- 8.Silver HM, Seebeck MA, Cowett RM, Patterson KY, Veillon C. Red cell volume determination using a stable isotope of chromium. J. Soc. Gynecol. Invest. 1997;4:254–9. [PubMed] [Google Scholar]
- 9.Fisher J, Matthes JW, Wynn R, Al-Ismail SA, Hoy TG, Wardrop CA, Williams JL. Determination of red cell volume in infants needing blood transfusion. Transfusion Medicine. 2000;10:219–24. doi: 10.1046/j.1365-3148.2000.00256.x. [DOI] [PubMed] [Google Scholar]
- 10.Mock DM, Lankford GL, Widness JA, Burmeister LF, Kahn D, Strauss RG. Measurement of red cell survival using biotin labeled red cells: Validation against 51Cr labeled red cells. Transfusion. 1999;39:156–62. doi: 10.1046/j.1537-2995.1999.39299154729.x. [DOI] [PubMed] [Google Scholar]
- 11.Mock D, Matthews N, Zhu S, Burmeister L, Zimmerman M, Strauss R, Schmidt R, Nalbant D, Cress G, Widness J. Red blood cell (RBC) volume can be independently determined in vivo in humans using RBCs labeled at different densities of biotin. Transfusion. 2010 doi: 10.1111/j.1537-2995.2010.02770.x. Accepted. http://dx.doi.org/10.1111/j.1537-2995.2010.02770.x. [DOI] [PMC free article] [PubMed] [Google Scholar]
- 12.Mock D, Matthews N, Strauss R, Burmeister L, Schmidt R, Widness J. Red cell volume can be independently determined in vitro using sheep and human red cells labeled at different densities of biotin. Transfusion. 2009;49:1178–85. doi: 10.1111/j.1537-2995.2009.02095.x. http://www.ncbi.nlm.nih.gov/entrez/query.fcgi?cmd=Retrieve&db=PubMed&dopt=Citation&list_uids=19220818. [DOI] [PMC free article] [PubMed] [Google Scholar]
- 13.Mock DM, Mock NI, Lankford GL, Burmeister LF, Strauss RG, Widness JA. Red cell volume can be accurately determined in sheep using a nonradioactive biotin label. Pediatr. Res. 2008;64:528–32. doi: 10.1203/PDR.0b013e318183f119. [DOI] [PMC free article] [PubMed] [Google Scholar]
- 14.Cordle DG, Strauss RG, Lankford GL, Mock DM. Antibodies provoked by the transfusion of biotin-labeled red cells. Transfusion. 1999;39:1065–9. doi: 10.1046/j.1537-2995.1999.39101065.x. [DOI] [PubMed] [Google Scholar]
- 15.Mock DM, Matthews NI, Strauss RG, Burmeister LF, Schmidt R, Widness JA. Multiple red cell volumes (RCV) can be independently determined in sheep in vivo using red cells (RBCs) labeled at 4 biotin densities. FASEB J. 2009 doi: 10.1111/j.1537-2995.2009.02095.x. [Updated April 18–24, 2009; Cited June 24, 2010]. Available from: http://www.fasebj.org/cgi/content/meeting_abstract/23/1_MeetingAbstracts/795.12. [DOI] [PMC free article] [PubMed] [Google Scholar]
- 16.Mock D, Matthews N, Zhu S, Burmeister L, Zimmerman M, Strauss R, Schmidt R, Nalbant D, Freise K, Veng-Pedersen P, Widness J. Red blood cell (RBC) volume can be independently determined in vivo in the sheep using ovine RBCs labeled at different densities of biotin. Transfusion. 2010 doi: 10.1111/j.1537-2995.2010.02744.x. In press. http://dx.doi.org/10.1111/j.1537-2995.2010.02770.x. [DOI] [PMC free article] [PubMed] [Google Scholar]
- 17.Hudson I, Cooke A, Holland B, Houston A, Jones JG, Turner T, Wardrop CAJ. Red cell volume and cardiac output in anaemic preterm infants. Arch Dis Child. 1990;65:672–5. doi: 10.1136/adc.65.7_spec_no.672. [DOI] [PMC free article] [PubMed] [Google Scholar]
- 18.Phillips HM, Holland BM, Abdel-Moiz A, Fayed S, Jones JG, Turner TL, Wardrop CJ, Cockburn F. Determination of red cell mass in assessment and management of anaemia in babies needing blood transfusion. Lancet. 1986;i:882–4. doi: 10.1016/s0140-6736(86)90988-8. [DOI] [PubMed] [Google Scholar]
- 19.Aladangady N, McHugh S, Aitchison TC, Wardrop CA, Holland BM. Infants' blood volume in a controlled trial of placental transfusion at preterm delivery. Pediatrics. 2006;117:93–8. doi: 10.1542/peds.2004-1773. http://www.ncbi.nlm.nih.gov/entrez/query.fcgi?cmd=Retrieve&db=PubMed&dopt=Citation&list_uids=16396865. [DOI] [PubMed] [Google Scholar]
- 20.Aladangady N, Aitchison TC, Beckett C, Holland BM, Kyle BM, Wardrop CA. Is it possible to predict the blood volume of a sick preterm infant? Arch Dis Child Fetal Neonatal Ed. 2004;89:F344–7. doi: 10.1136/adc.2003.039008. http://www.ncbi.nlm.nih.gov/entrez/query.fcgi?cmd=Retrieve&db=PubMed&dopt=Citation&list_uids=15210672. [DOI] [PMC free article] [PubMed] [Google Scholar]
- 21.Egberts J, van Kamp IL, Kanhai HH, Meerman RH, Giordano PC, Gravenhorst JB. The disappearance of fetal and donor red blood cells in alloimmunised pregnancies: a reappraisal. Br J Obstet Gynaecol. 1997;104:818–24. doi: 10.1111/j.1471-0528.1997.tb12026.x. http://www.ncbi.nlm.nih.gov/entrez/query.fcgi?cmd=Retrieve&db=PubMed&dopt=Citation&list_uids=9236647. [DOI] [PubMed] [Google Scholar]
- 22.Dziegiel MH, Koldkjaer O, Berkowicz A. Massive antenatal fetomaternal hemorrhage: evidence for long-term survival of fetal red blood cells. Transfusion. 2005;45:539–44. doi: 10.1111/j.0041-1132.2005.04262.x. http://www.ncbi.nlm.nih.gov/entrez/query.fcgi?cmd=Retrieve&db=PubMed&dopt=Citation&list_uids=15819674. [DOI] [PubMed] [Google Scholar]
- 23.Suzuki T, Dale GL. Biotinylated erythrocytes: in vivo survival and in vitro recovery. Blood. 1987;70:791–5. [PubMed] [Google Scholar]
- 24.Mock DM, Lankford GL, Widness JA, Burmeister LF, Kahn D, Strauss RG. Measurement of circulating red blood cell volume using biotin labeled red cells: Validation against 51Cr labeled red cells. Transfusion. 1999;39:149–55. doi: 10.1046/j.1537-2995.1999.39299154728.x. [DOI] [PubMed] [Google Scholar]
- 25.Mock DM, Lankford GL, Widness JA, Burmeister LF, Kahn D, Strauss RG. RBCs labeled at two biotin densities permit simultaneous and repeated measurements of circulating RBC volume. Transfusion. 2004;44:431–7. doi: 10.1111/j.1537-2995.2004.00654.x. [DOI] [PubMed] [Google Scholar]
- 26.Suzuki T, Dale GL. Senescent erythrocytes: Isolation of in vivo aged cells and their biochemical characteristics. Proc. Natl. Acad. Sci. USA. 1988;85:647–1651. doi: 10.1073/pnas.85.5.1647. [DOI] [PMC free article] [PubMed] [Google Scholar]
- 27.Suzuki T, Dale GL. Membrane proteins in senescent erythrocytes. Biochem. J. 1989;257:37–41. doi: 10.1042/bj2570037. [DOI] [PMC free article] [PubMed] [Google Scholar]
- 28.Dale GL, Daniels RB, Beckman J, Norenberg SL. Characterization of senescent red cells from the rabbit. Adv Exp Med Biol. 1991;307:93–103. doi: 10.1007/978-1-4684-5985-2_9. [DOI] [PubMed] [Google Scholar]
- 29.Dale GL, Daniels RB. Quantitation of immunoglobulin associated with senescent erythrocytes from the rabbit. Blood. 1991;77:1096–9. [PubMed] [Google Scholar]
- 30.Mock D. Biotin: Physiology, dietary sources and requirements. In: Caballero B, Allen L, Prentice A, editors. Encyclopedia of Human Nutrition. Academic Press; London: 2004. [Google Scholar]
- 31.Mollison PL, Engelfriet CP, Conteras M. Blood Transfusion in Clinical Medicine. Blackwell Scientific Publications; London: 1993. [Google Scholar]
- 32.Bentley SA, Glass HI, Lewis SM, Szur L. Elution correction in 51Cr red cell survival studies. Br. J. Haematol. 1974;26:179–84. doi: 10.1111/j.1365-2141.1974.tb00461.x. [DOI] [PubMed] [Google Scholar]


