Abstract
Osteon morphotype scores (MTSs) allow for quantification of mechanically important collagen/lamellar variations between secondary osteons when viewed in circularly polarized ight (CPL). We recently modified the 6-point MTS method of Martin et al. (Martin RB, Gibson VA, Stover SM, Gibeling JC, Griffin LV (1996a) Osteonal structure in the equine third metacarpus. Bone 19, 165-71) and reported superiority of this modified method in correlating with ‘tension’ and ‘compression’ cortices of both chimpanzee proximal femoral diaphyses and diaphyses of other non-anthropoid bones that are loaded in habitual bending (Skedros et al. 2009, 2011). In these studies, the ‘tension’ and ‘compression’ cortices differed significantly in predominant collagen fiber orientation (CFO) based on weighted-mean gray levels (CFO/WMGLs) in CPL images. In chimpanzee femora, however, some osteons were difficult to score with the 6-point method; namely, ‘hybrids’ with peripherally bright ‘hoops’ and variability in alternating rings within the osteon wall. We hypothesized that some of these hybrids would be more prevalent in regions subject to torsion than bending. In this perspective the present study was aimed at expanding our 6-point scoring method (S-6-MTS) into two 12-point methods with six additional morphotypes that considered these hybrids. Three- and 4-point methods were also evaluated. We hypothesized that at least one of these other methods would out-perform the S-6-MTS in terms of accuracy, reliability, and interpreting torsion vs. bending load histories. Osteon morphotypes were quantified in CPL images from transverse sections of eight adult chimpanzee femora (neck, proximal diaphysis, mid-diaphysis), where the mid-diaphysis and base- and mid-neck locations have relatively more complex loading (e.g. torsion + bending) than the proximal diaphysis, where bending predominates. Correlation coefficients between CFO/WMGL and MTSs showed that the S-6-MTS method was either stronger or equivalent to the 12-point methods, and typically stronger than the 3- and 4-point methods for all load environments. In nearly all instances the S-6-MTS is more reliable and accurate when it is applied to cases where interpreting load history requires distinguishing habitual bending from torsion. Consequently, in studies of osteonal adaptations for these load histories the 3- and 4-point methods are not stronger correlates, and the extra time required to assign additional scores in the 12-point methods is both unnecessary and can be highly unreliable.
Keywords: bone adaptation, chimpanzee femur, collagen fiber orientation, load history, osteon
Introduction
Osteon morphotype scoring, first introduced by Martin et al. (1996a), is a useful method for discerning mechanically relevant variations in the regional distributions of secondary osteons (Haversian systems) when viewed under circularly polarized light (CPL). In a microscopic study of thin plane-parallel transverse sections of diaphyseal cortices of equine third metacarpals viewed in CPL, Martin et al. (1996a) described six phenotypic variants of the secondary osteons. They also introduced a numerical method for scoring regional variations in their distribution. Under CPL these osteon morphotypes are distinguished by variations in birefringent (‘brightness’) patterns that are attributed to their lamellar collagen organization/orientation. These range from ‘hoop’ osteons, containing a bright peripheral ring of highly oblique-to-transverse collagen fibers, to ‘distributed’ osteons, with highly oblique-to-transverse collagen patterns distributed across the entire osteon wall (bone from the central canal of the osteon to the outer edge of the osteon; Fig. 1). The Martin et al. scoring scheme, which can be expressed as an osteon ‘morphotype score’ (MTS), represents a significant advance in interpreting bone adaptation for two main reasons. First, the regional prevalence of these osteon morphotypes appears to be common, having been observed in various bones of diverse species (Vincentelli, 1978; Riggs et al. 1993a; Skedros et al. 1996, 2009; Currey, 2002; Warshaw, 2007; McFarlin et al. 2008; Beraudi et al. 2010). Secondly, osteon morphotypes can, independently of osteon population density, significantly influence regional mechanical behavior (e.g. between anterior and posterior cortices) during physiological and supra-physiological loading (including fracture; Hiller et al. 2003; Bigley et al. 2006; Ebacher et al. 2007); however, this issue is not yet commonly recognized in advanced studies (Tommasini et al. 2005; Zimmermann et al. 2009).
Fig. 1.
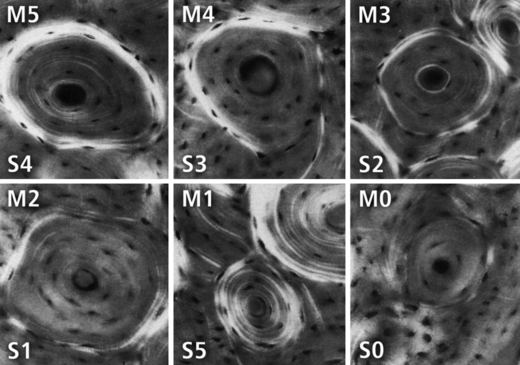
The 6-point morphotype scoring schemes with examples of each birefringence pattern (‘morphotype’). These images are reproduced from the original study of Martin et al. (1996a). The original scoring scheme from Martin et al. (1996a) is designated with an ‘M’ in the upper left corner of each osteon image. Our modified 6-point scoring scheme, also used in the present study, is designated with an ‘S’ in the lower left corner of each osteon image. The scores in the modified 6-point scheme (S-6-MTS) are as follows: 0 = category N, a dark osteon with no birefringent lamellae; 1 = category OWI, a combination of OI and OW; 2 = category OW, similar to O but the birefringent peripheral ring is weak; 3 = category OI, similar to O but the birefringent peripheral ring is incomplete; 4 = category O osteon with dark interior and strongly birefringent peripheral lamellae; 5 = category D, birefringent lamellae are distributed throughout the wall of the osteon (‘distributed’ osteon group). This group includes ‘bright’ osteons (less frequent) and ‘alternating’ osteons (more frequent). Note that a birefringent peripheral lamella, or ‘ring’, is also called a ‘hoop’.
As shown in Fig. 1, we modified the osteon MTS scheme of Martin et al. (1996a) as a means for more accurately interpreting relationships between morphotypes and specific load environments (Skedros et al. 2009). In bones that receive habitual bending, it has been shown (in CPL images) that osteon morphotypes with relatively greater amounts of transverse collagen (bright birefringence) distributed in the osteon wall represent adaptation for prevalent compression, whereas osteon morphotypes with more longitudinal collagen (dark) represent adaptation for prevalent tension (Riggs et al. 1993a,b; Skedros et al. 2004, 2006, 2007a). In our previous study of adult chimpanzee (Pan troglodytes) femora, however, we encountered osteon morphotypes that were difficult to score when using either of these previous 6-point scoring methods (Skedros et al. 2011). These osteon morphotypes typically had complete or variably complete ‘alternating’ birefringent rings within the osteon wall, in addition to having bright peripheral ‘hoops’ (compare Figs 2 and 3). Therefore, many of these osteons appeared to be ‘hybrids’, having characteristics of both hooped and alternating morphotypes. The fact that these hybrids were often scored as ‘distributed’ morphotypes in our scoring scheme (S5 in Fig. 1) appeared to be one additional reason why our 6-point MTS out-performed the 6-point MTS of Martin et al. (1996a). In other words, because our scoring scheme juxtaposes the numerical score of strongly hooped osteons (‘4’) with the score of distributed (bright or alternating) osteons (‘5’), it is less likely that these hybrids would skew the score toward lower numerical values because they would be scored as either ‘4’ or ‘5’ (most typically the latter). By contrast, in Martin's scheme, the strongly hooped osteons receive a ‘5’ and distributed osteons a ‘1’. Therefore, the score for a hybrid osteon in the Martin scheme could be ‘1’, skewing the MTS to lower numerical values that could be erroneous in a mechanically adaptive context (Skedros et al. 2009). Nevertheless, our advanced scoring method has been criticized by Beraudi et al. (2010) in a study of the distribution of osteons in a human fibula. They state that:
Fig. 2.
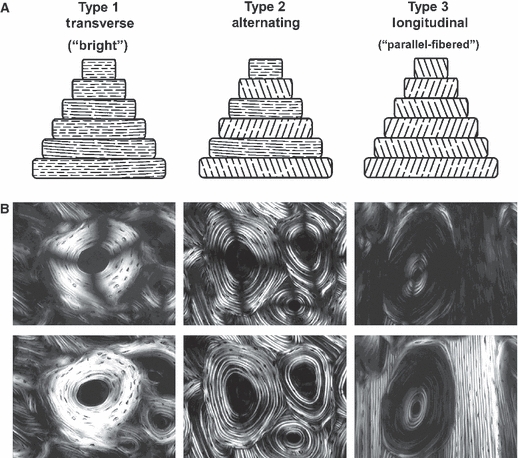
Examples of three-osteon morphotypes in linearly polarized light (top microscopic images) and circularly polarized light (bottom microscopic images; the dark cross-shaped extinction patterns are absent). The illustrations at the top of this figure are diagrammatic depictions of the predominant collagen fiber orientation (CFO) patterns that are believed be to the physical basis of the birefringence seen in the successive lamellae of the osteons in the microscopic images. The osteon images are from Bromage et al. (2003), and the layout of the figure is based on both Bromage et al. (2003) and Ascenzi & Bonucci (1968). These investigators ascribe to the view that the birefringence (gray-level) variations, seen for example in the ‘alternating’ osteon, are primarily based on lamellar variations in predominant CFO. Other investigators have argued that variations in the density of collagen fibers account for the gray-level variations in the alternating osteons (Marotti, 1996); this view is not well supported by experimental data and also appears to be influenced by limitations of specimen preparation techniques (Yamamoto et al. 2000). (Images are reproduced with permission of The Anatomical Record Part B, The New Anatomist; John Wiley and Sons Inc., Malden, MA, USA).
Fig. 3.
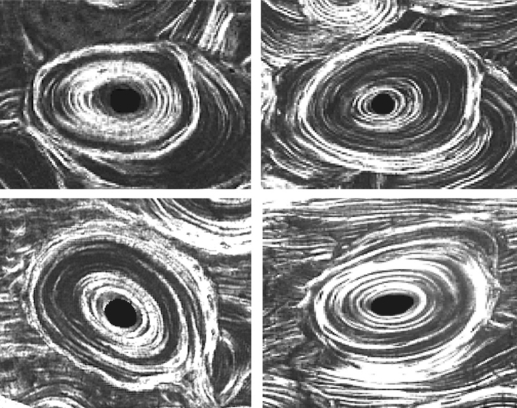
Four examples of ‘hybrid’ osteons. Each image was obtained using circularly polarized light and the 100-μm sections of unstained bone were embedded in polymethyl methacrylate. The images are obtained using the same magnification and illumination; each image is 275 μm wide.
The classification of Martin et al. (1996a), as well as Skedros et al. (2009), did not consider a very representative type of osteon [alternating], typically found in human samples …. [the Martin/Skedros] kind of classification could introduce some noise in the data collection because the differences among 4 of the 6 proposed classes are based on small changes in the external ring of the osteon (Beraudi et al. 2010, pp. 261).
This concern appears to be one reason why Beraudi et al. (2010) avoided these six-osteon classifications and, consequently, used a modification of the four-osteon classification described by Bigley et al. (2006; Fig. 4). The modification of Beraudi et al. (2010), which they state is purely a ‘morphological classification’, contrasts with the morphological and biomechanical contexts that form the foundation of our osteon MTS. Additionally, Beraudi et al. (2010) did not realize that in our scoring scheme the prevalent ‘alternating’ osteon morphotype and the much less common ‘bright’ morphotype were both scored as ‘5’ in the ‘distributed’ osteon group (Fig. 1).
Fig. 4.
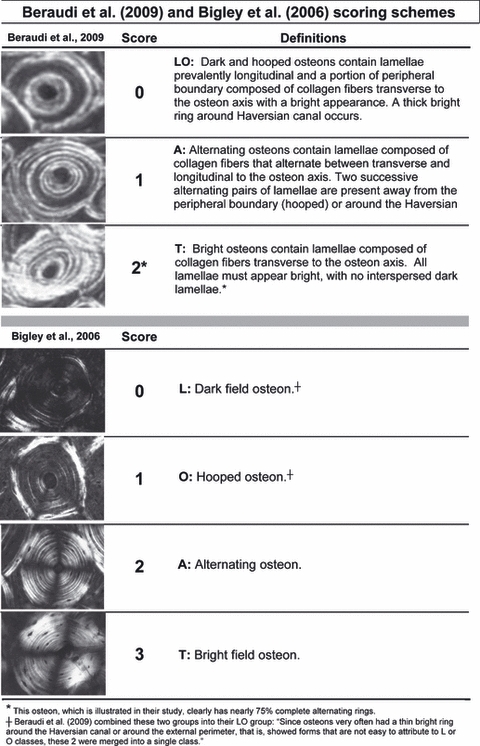
Examples of the osteon morphotypes described by Beraudi et al. (2010) and Bigley et al. (2006). Shown are also the definitions of each of these osteon morphotypes and their assigned numerical score. (Images are reproduced with permission granted by Alina Beraudi, Lanny Griffin, and Elsevier Ltd., Oxford, UK.)
In an attempt to more accurately evaluate regional variations in osteon morphotypes and eliminate the discrepancies outlined above, we developed two 12-point osteon MTSs as expansions of our 6-point scoring method. These new scores: (i) specifically consider hooped/alternating hybrids, (ii) reduce the influence of ‘small changes’ in the completeness and strength of the peripheral bright ring (hoop) of the osteon on the final osteon MTS, and (iii) consider the overall amount of oblique-to-transverse (‘compression-adapted’) collagen within the osteon wall (Fig. 5 and as described below). In addition to addressing the criticisms of Beraudi et al. (2010), the new 12-point scores also consider the mechanical relevance of the morphotypes evaluated by Bigley et al. (2006) as described in the Appendix 1. They also consider the various potentially mechanically relevant hybrid morphotypes that we observed in our prior studies and that Vincentelli (1978) also observed in human tibiae where high bending and torsional stresses occur. Finally, we had observed a high prevalence of hybrid osteons that might be related to age and/or habitual loads in our CPL images of human limb bone sections (femora and fibulae) (unpublished observations). The present study, in part, also addresses this issue by determining whether the new 12-point scoring methods correlate more strongly with load history when compared to scoring methods that do not specifically consider these hybrid osteons.
Fig. 5.
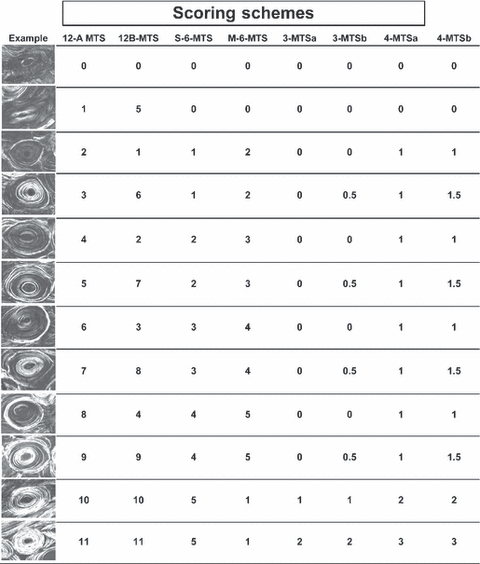
Illustrations of osteons and their scores for 12A-MTS, 12B-MTS, S-6-MTS, M-6-MTS, 3-MTSa,b, and 4-MTSa,b. Each image was obtained using circularly polarized light and the 100-μm sections of unstained bone were embedded in polymethyl methacrylate. The images are obtained using the same magnification and illumination; each image is ca. 275 μm wide. It should be noted that the 12-point scores allow for the designation of hybrid osteons (e.g. 3, 5, 7, and 9 in the 12A-MTS).
We hypothesize that these 12-point methods will more clearly reveal osteon MTS differences between ‘tension’ (lateral) and ‘compression’ (medial) cortices of the chimpanzee proximal femoral diaphysis, as well as help in distinguishing these regions from the more torsion-loaded locations (described below). It is also predicted that the 12-point methods will generally correlate more strongly with variations in predominant CFO in multiple cortical areas (e.g. octants around entire cross-sections of the bone) when compared to either of the previous 6-point scoring methods shown in Fig. 1. Furthermore, we also evaluated scores that are based on the three-osteon designations of Beraudi et al. (2010) and on the four-osteon designations of Bigley et al. (2006), both of which we hypothesize will under-perform when compared to the 12-point methods. Another purpose of this study was to evaluate intra- and interobserver reliability to determine whether accuracy could be maintained when several observers are used to reduce the overall time required for osteon scoring. This is an important practical consideration because the 12-point scoring methods are very time-consuming.
In addition to the chimpanzee proximal femoral diaphysis examined in our previous study (Skedros et al. 2011), the present study also examines the mid-diaphysis and two neck locations (base neck and mid-neck) because they likely have relatively more complex loading (e.g. torsion + bending) than the proximal diaphysis (Skedros & Baucom, 2007). Although increased hybrid morphotypes are expected in locations with more prevalent/predominant torsional loading, regional variations in osteon MTSs are not expected because the bone matrix is believed to be generally adapted to the regionally uniformly/diffusely distributed shear stresses (Skedros & Hunt, 2004; Skedros et al. 2009). In this study, birefringence variations seen in the CPL images from these five section locations are expressed as differences in WMGLs that represent differences in predominant CFO (Mason et al. 1995; Skedros et al. 1996; Bromage et al. 2003). Because predominant CFO expressed as WMGLs can reliably reflect adaptation for a regionally prevalent strain mode (e.g. tension vs. compression), these values (‘CFO/WMGLs’) are used to define the presence of regional strain-mode-related matrix adaptation (Boyde & Riggs, 1990; Skedros & Hunt, 2004; Skedros et al. 2004, 2007b, 2009). Therefore, for the purposes of this study, regional variations in prevalent/predominant strain modes (e.g. tension vs. compression) were inferred from corresponding CFO/WMGL data.
Materials and methods
Chimpanzee specimens and sections
One femur was obtained from each of eight adult chimpanzees (Pan troglodytes). The sample included four females (8–39 years old, mean 28.0 ± 14.4), three males (18–31 years old, mean 25.3 ± 6.7), and one adult animal of unknown age and sex (total sample with known ages: 26.7 ± 11.0 years). The chimpanzees were born in the colony from the Yerkes National Primate Research Center, Lawrenceville, GA, USA. The animals were housed in large enclosures with features of natural habitat. None of the animals in our study was old enough to restrict their movement repertoire. Review of clinical records and gross examination of the bones revealed no evidence of arthritic changes in the articular aspects of the bones and no angular deformities. Furthermore, there was no history of surgeries on the femoral or pelvic regions, and there were no data regarding the prevalence of specific ambulatory activities.
All bones were obtained in a fresh-frozen state. They were thawed and manually cleaned of soft tissue and periosteum. From each bone, five 1.0–1.5-cm transversely cut segments were obtained from these section ‘levels’: (i) one from the mid-neck, (ii) one from the base neck, (iii) one just distal to the inferior base of lesser trochanter (80% diaphysis location), (iv) one from the 70% proximal diaphysis (70% location), and (v) one from the mid-diaphysis (50% location; Fig. 6). All of the undecalcified and unstained sections were ultrasonically cleaned for 5 min to remove debris (Branson B200 Ultrasonic Cleaner; Danbury, CT, USA) and then were embedded in optically clear polymethyl-methacrylate (PMMA) using published methods (Emmanual et al. 1987).
Fig. 6.
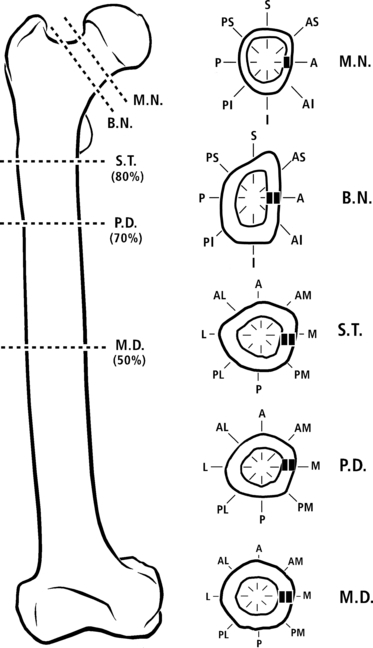
Illustration of a right femur from one of the chimpanzees. Shown are the five sections and their octant locations. M.N., mid-neck; B.N., base neck; S.T., sub-trochanteric (80% diaphysis); P.D., proximal diaphysis (70%); M.D., mid-diaphysis (50%).
In each of these sections, octant locations were defined for image analysis (Fig. 6). In the diaphyseal sections the octants were: anterior, anterior-medial, medial, posterior-medial, posterior, posterior-lateral, lateral, and anterior-lateral. In the neck sections the octants were: anterior, superior-anterior, superior, superior-posterior, posterior, posterior-inferior, inferior, and anterior-inferior.
Using a low-speed, diamond blade saw (Exact, West Germany) and continuous water irrigation, a 1.0-mm-thick transverse section was obtained from each PMMA-embedded segment. One surface of each of these sections was ultramilled to a high luster finish (Reichert/Jung Ultramiller). The milled surface was then mounted with cyanoacrylate glue onto a glass slide and the opposite side was milled to achieve a uniform overall thickness of 100 (± 5) μm (Skedros et al. 1996). Milling ensured that minute topography, which can affect image gray levels, was eliminated (Vajda et al. 1998).
Collagen fiber orientation (CFO) analysis
Milled sections were analyzed for predominant CFO using CPL according to the method of Boyde & Riggs (1990). They were viewed in the light microscope after being placed between appropriately crossed left- and right-hand sheets of circular polarizing material [HNCP37 × 0.030 inch (0.762 mm) filters; Polaroid Corporation, Norwood, MA, USA] (Neville, 1980). Regional differences in CFO were quantified in terms of corresponding differences in the transmitted light intensity, where darker gray levels represent relatively more longitudinal CFO (‘tension’ adaptation) and brighter gray levels relatively more oblique-to-transverse CFO (‘compression’ adaptation; Boyde & Riggs, 1990; Skedros, 1994, 2001; Fig. 7). This method assumes that all other specimen-dependent factors that can artifactually change the intensity of transmitted light (e.g. variations in specimen thickness, debris in the embedding media) are eliminated (Skedros et al. 1996; Skedros, 2001; Bromage et al. 2003).
Fig. 7.
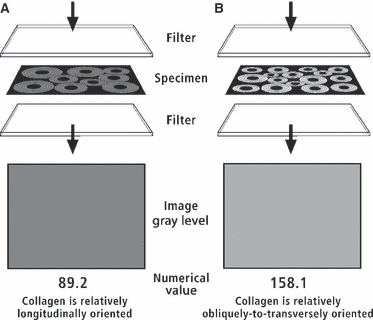
Illustration showing how polarizing filters are configured for detecting differences in CFO/WMGL. Darker WMGLs indicate more longitudinally oriented collagen; brighter WMGLs indicate more transverse-to-oblique collagen.
Gray level values were quantified at the octant locations of each section. Two 50× images were analyzed in the mid-cortex at each octant of each sub-trochanteric and proximal diaphyseal section. Because of the relatively thin cortices of the femoral neck, only one image was obtained in most of these octant locations (e.g. the superior cortex of the mid-neck was 2.8 ± 1.1 mm thick, whereas the height of each image was 1.4 mm). The only exception in the neck was the inferior octant location, which was consistently sampled with two images because of a mean cortical thickness of 4.5 mm. There were 1280 × 1024 pixels per image (2.3 mm2 per image) and 0.562 pixels per square micrometer. For a typical osteon (including the central canal), there were ca. 21 800 pixels (38 790 μm2) and ca. 6 pixels across the typical thickness of a lamella (7 μm).
Using algorithms of a computerized imaging system (image pro plus v.4.5; Universal Imaging Corporation, West Chester, PA, USA) and a video camera (Optronics MagnaFIRE SP, Goleta, CA, USA), the grayscale images from each cortex were digitized directly from the microscope (Nikon Eclipse E600; Nikon Corp., Tokyo, Japan) and stored onto a compact disk (Memorex CD-R, LM-32024581; Cerritos, CA, USA). Uniformity and consistency of the light source across the entire field of view was periodically verified using the algorithms of the imaging system (Skedros et al. 1996).
Differences in transmitted light intensity are seen in the images as differences in gray levels (shades of gray). Image gray levels were converted into integer values ranging from 0 to 255. For each image the area fractions of pixels (as a fraction of total pixels) with a discrete gray level were calculated. A gray level histogram was then constructed, and a WMGL was calculated from the histogram according to the methods described by Bloebaum et al. (1997). The 20 darkest gray levels (0–19) were eliminated from the calculation of WMGLs since they represent porous spaces and other tissue voids (e.g. osteocyte lacunae, central canals, and artifactual cracks). Average WMGLs were calculated using WMGLs from the one to two images taken in each cortex (octant) of each section. In our laboratory, we have shown that using these methods to quantify regional CFO differences by analyzing WMGLs produces relative differences that are similar to the ‘longitudinal structure index’ used by Martin & Ishida (1989), Martin et al. (1996b,c);, and Takano et al. (1999). For the purposes of this study, WMGL data are described as ‘CFO/WMGL’.
Osteon morphotype scoring schemes
The criteria for selecting a secondary osteon were in accordance with those described by Martin et al. (1996a) and included: (i) presence of a scalloped cement line, (ii) absence of a Volkmann's canal connection, and (iii) nearly complete or complete refilling. The osteons with borders intersecting the edge of the image were not selected. This stipulation also excluded osteons with boundaries that were not visible due to large ‘overlaps’ of other osteons. We also adhered to additional methods of Beraudi et al. (2010), where all the osteons with noncircular or partially deformed geometry were excluded because they could not be classified unambiguously. Although these exclusions limit the number of osteons that can be given an MTS, they allowed us to identify each osteon correctly without making assumptions about any non-visible portion of an osteon. No additional scheme was devised for scoring osteon fragments. Nevertheless, the fragments and ‘deformed’ osteons represented < 5% of the imaged areas in this study.
General definition of an ‘alternating’ osteon
In our recent study (Skedros et al. 2009), we identified ‘alternating’ osteons in accordance with the definition of Bigley et al. (2006): ‘An alternating osteon was defined as having at least two successive alternating pair of [bright] lamellae away from the peripheral boundary (hooped) or around the Haversian canal’. This definition required modification for the present study for several reasons, including that Beraudi et al. (2010) significantly modified it (see footnote of Fig. 4) and because of other mechanically related reasons. For example, when there are only two or three rings, the two-ring cutoff in the Bigley et al. definition is potentially problematic in a mechanical context because the osteon wall is still relatively dark in CPL (i.e. prevalent longitudinally oriented collagen = ‘tension adapted’). In turn, it also does not seem appropriate that these relatively dark, poorly ringed osteons would be placed into the ‘distributed’ (‘compression-adapted’) group in our 6-point score – this is how we scored them previously (Skedros et al. 2009). Therefore, as described in more detail below, we modified the definition of ‘alternating’ osteons as those with four or more bright rings with > 75% completeness regardless of whether or not they were adjacent to the central canal. Consequently, if there were three or fewer rings around the central canal then the osteon could not be considered ‘alternating’. [In this case it would have been an ‘LO’ (i.e. ‘hoop’ or ‘dark’) osteon in the Beraudi et al. (2010) classification vs. an ‘alternating’ osteon in the Bigley et al. (2006) classification (Fig. 4).]
The 6-point schemes: ‘M-6-MTS’ and ‘S-6-MTS’
Our analysis started with the Martin 6-point scoring method (‘M-6-MTS’), which scores the osteons as: dark = 0, distributed (‘alternating’ and ‘bright’) = 1, weak incomplete hoop = 2, weak hoop = 3, incomplete hoop = 4, and hoop = 5 (Fig. 1; Martin et al. 1996a).
Next, we used our modified 6-point osteon scoring scheme (‘S-6-MTS’), which scores the osteons as: dark = 0, weak incomplete hoop = 1, weak hoop = 2, incomplete hoop = 3, hoop = 4, and distributed (‘alternating’ and ‘bright’) = 5 (Fig. 1; Skedros et al. 2009). Compared to the M-6-MTS, the S-6-MTS is considered an advanced method because it is more mechanically relevant – it juxtaposes the numerical scores of the osteons with the brightest birefringence (i.e. oblique-to-transverse CFO = ‘compression-adapted’ collagen).
The 12-point schemes: ‘12A-MTS’ and ‘12B-MTS’
In their studies of non-anthropoid bones, Martin et al. (1996a) and Skedros et al. (2009) did not specifically report the prevalence of the ‘hybrid’ osteons that we observed in chimpanzee femora in our previous study (Skedros et al. 2011); namely, osteons with variable amounts of alternating birefringent patterns and peripheral hoops that did not correspond well to any of the six scores (Fig. 3). As noted, some of these osteons could be scored as being either hooped or distributed in the 6-point scores. In turn, we noted increased observer error in classifying these osteons. For these reasons we developed two new 12-point scoring methods that specifically consider these hybrid osteons.
The first 12-point scoring method (‘12A-MTS’) places more emphasis on the ‘hoop’ at the osteon periphery and less emphasis on the alternating pattern within the osteon wall (Figs 8 and 9). The 12A-MTS is therefore an expansion of the S-6-MTS because it still primarily emphasizes the birefringence intensity and completeness of the hoop. In addition to having scores that sequentially increase in accordance with hoop strength (birefringence intensity) and completeness, the 12A-MTS secondarily considers the number of ‘alternating’ lamellae in the osteon wall. By contrast, the second 12-point scoring method (‘12B-MTS’) places more emphasis on the alternating pattern in the osteon wall and less emphasis on the hoop (see below, and Figs 10 and 11).
Fig. 8.
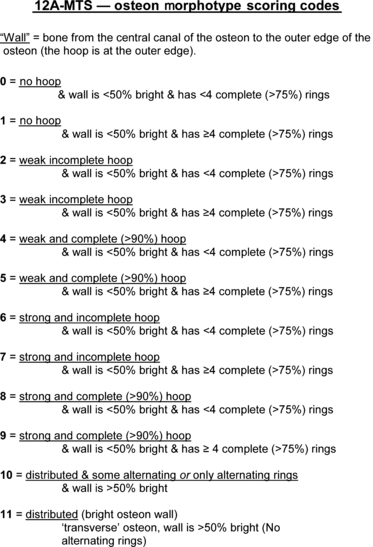
Specific definitions of each osteon morphotype in the 12A-MTS scheme.
Fig. 9.
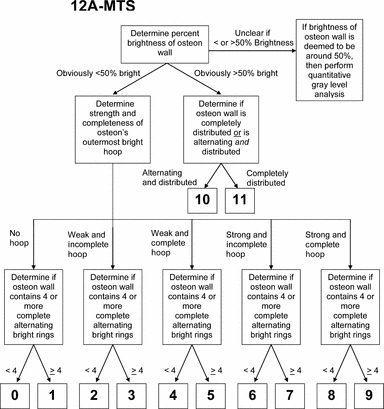
Algorithm used to aid observers for scoring using the 12A-MTS scheme.
Fig. 10.
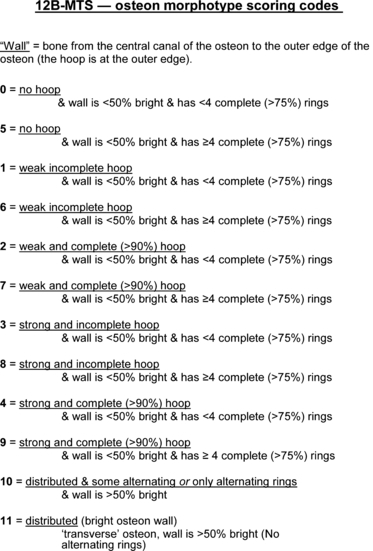
Specific definitions of each osteon morphotype in the 12B-MTS scheme.
Fig. 11.
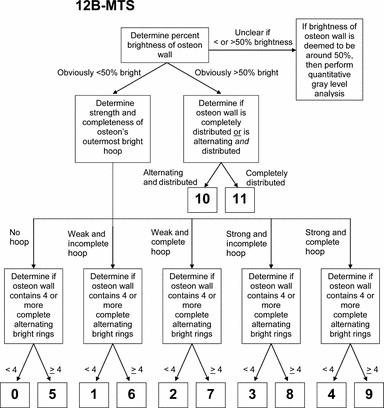
Algorithm used to aid observers for scoring using the 12B-MTS scheme.
In the 12A-MTS scheme, if the osteon wall contained > 50%‘bright’ collagen, then the osteon was given a score of 10 or 11. The 50% brightness cutoff was defined at the midpoint of the gray-level spectrum. There were two main reasons for this specific cutoff value: (i) it helped segregate complete from incomplete alternating osteons, and (ii) it is associated with enhanced adaptation for compression because brighter gray levels reflect more oblique-to-transverse collagen fibers. An osteon with relatively uniformly ‘bright’ collagen distributed across its wall (i.e. no clear alternating rings) was given a score of 11. An osteon with > 50% wall brightness in addition to some alternating rings was given a score of 10. By contrast, in the 12A-MTS, if the osteon wall contained < 50% brightness, then the osteon was given an integer score of 9 or less depending on the completeness and strength of the hoop. Score distinctions were also made based on the four-ring cutoff (Fig. 8).
The 12B-MTS follows some of the criteria used in the 12A-MTS. Identically to the 12A-MTS, the 12B-MTS not only considers the hoop strength and completeness, but also the percentage of brightness in the osteon wall (Figs 10 and 11). In contrast to the 12A-MTS, the 12B-MTS scoring is stratified with emphasis primarily on the percentage brightness and number of alternating rings, and secondarily considers the presence and completeness of the peripheral hoop.
In the 12B-MTS, if the osteon wall contained > 50%‘bright’ collagen, then the osteon was given a score of 10 or 11. An osteon with a relatively uniformly bright wall was given a score of 11, whereas an osteon with > 50% brightness but with some alternating rings was given a score of 10. In this context, there was no difference with the other 12-point score method. If the osteon wall was < 50% bright, then it was given an integer score of 9 or less. Unlike the 12A-MTS, M-6-MTS, and S-6-MTS methods, the 12B-MTS method more strongly emphasizes the presence of alternating ring patterns, more so than the strength or completeness of a hoop. Additional specific descriptions of this scoring scheme can be found in Fig. 10.
The 3- and 4-point schemes: ‘3-MTSa’ and ‘4-MTSa’
Osteon morphotype scores were also calculated for each image using the three-osteon designations of Beraudi et al. (2010) and the four-osteon designations of Bigley et al. (2006) (Figs 4 and 5). In addition to being based on mechanical property differences (Bigley et al. 2006), these osteon score schemes were evaluated because they are also easier to accomplish than the more tedious 6- and 12-point scores.
As mentioned above, to calculate the 3- and 4-point scores for the ‘hybrid’ osteons (features of hooped and alternating) that we encountered, it was necessary to modify the definitions of alternating osteons that were used by Bigley et al. (2006) and Beraudi et al. (2010). As noted, in our previous study (Skedros et al. 2009) we used the Bigley et al. two-ring cutoff for designating an alternating osteon; however, in that study we found that a large majority of alternating osteons had four or more rings. This was our main reason for modifying the definition of an ‘alternating’ osteon as an osteon with four or more bright rings that were also > 75% complete.
Another modification made in the present study was that when rings are clustered adjacent to the central (Haversian) canal, the osteon is not considered to be ‘alternating’when there are fewer than four rings. This contrasts with the Beraudi et al. (2010) scheme where osteons are not considered to be alternating when the rings, regardless of number, are clustered adjacent to the central canal.
Assessing the potential affect of ring number and/or wall brightness in non-alternating osteons in the simpler methods: ‘3-MTSb’ and ‘4-MTSb’
In the present study we also emphasized the ‘degree of brightness’ of the wall in the 3- and 4-point methods because the regression analyses of Bigley et al. (2006) showed that the amount of brightness of the wall correlated positively with the strength of the individual osteon (Fig. 5). Consequently, there are specific morphotypes where it was deemed important to variably adjust the numerical score of some osteons using these methods: (i) when ≤ 3 vs. ≥ 4 rings (all > 75% complete) were adjacent to the central canal, or (ii) when there were > 4 rings adjacent to the central canal but these additional rings were < 75% incomplete. Specifically, the osteons referred to here are considered to be hybrids and are assigned scores 3, 5, 7, and 9 in the 12A-MTS scheme (left column of Fig. 5). To provide an estimate of the effect that these osteons might have if they had been scored with more emphasis placed on the brightness of the osteon wall, one half of these osteons that correspond to these four 12A-MTS categories received a higher score in the 3-MTS and 4-MTS methods. The re-scoring of one-half of these osteons was considered to be a reasonable estimate based on an overview of all of the CPL images. These increased scores are shown as 3-MTSb and 4-MTSb in Fig. 5, and the adjusted scores include those that are increased from 0 to 0.5, and from 1.0 to 1.5.
Morphotype scoring team
Our osteon morphotype scoring team consisted of the principal investigator (J.G.S.) and four well-trained observers: three undergraduate students, and one graduate student (C.J.K.). All four observers underwent numerous tutorials under the direction of the principal investigator and practiced scoring 4 days a week for 2 months prior to the final osteon morphotype scoring. All observers were blinded to image location and to the hypothesis of the study.
At the end of the training period, but before the actual scoring began, each of the observers scored the same 15 images, three from each section location. Using described methods (Skedros et al. 2009), an average osteon MTS was then determined for each of these images (Trial A). Two weeks later, each of the observers once again scored the same 15 images, and an average osteon MTS was again determined for each image (Trial B). From these two datasets, we found that Observer 1, the graduate student, had the highest intra-observer correlation (r = 0.96) between Trial A and Trial B, just ahead of Observer 2 (r = 0.95), Observer 3 (r = 0.93), and Observer 4 (r = 0.86; Table 1). Therefore, the graduate student was considered the ‘lead morphotype scorer’. Because of inconsistency in scoring, which could not be rectified with additional training, Observer 4 was excused from further scoring duties (described further below in the Results section).
Table 1.
Results of intra- and inter-observer correlations
| Intra-observer r values | Observer 1 | Observer 2 | Observer 3 | Observer 4 |
| 0.96 | 0.95 | 0.93 | 0.86* | |
| Inter-observer r values | Obs 1 vs. Obs 2 | Obs 1 vs. Obs 3 | Obs 1 vs. Obs 4 | |
| 0.73 | 0.71 | 0.53* | ||
| Obs 2 vs. Obs 3 | Obs 2 vs. Obs 4 | Obs 3 vs. Obs 4 | ||
| 0.68 | 0.33*† | 0.32*† |
Observer 4 was removed from the study because of his relatively low intra-observer and inter-observer correlations during the training phase. Obs, observer.
Non-significant (P > 0.05) correlations. All other correlations are significant (P < 0.01).
Morphotype scoring protocol
Following the training period, the two remaining undergraduate students (Observers 2 and 3) were each given images from one-half of the sample to score. The graduate student was given images from all eight chimpanzee femora (ca. 570 images) to score. The final scoring was done during a 6-week period. To increase the accuracy of their scoring, each of the three observers was also given: (i) a set of images of 18 osteons with exact percent brightness values (WMGL calculated from the 236 gray-level spectrum; Fig. 12), and (ii) images of osteons representing each of the 12-point scores (Fig. 5). Consistency during the scoring (i.e. intra-observer r values > 0.93, as shown by Observer 3 during final training) was verified by having each observer re-score five images three times, after finishing each one-third of their assigned images.
Fig. 12.
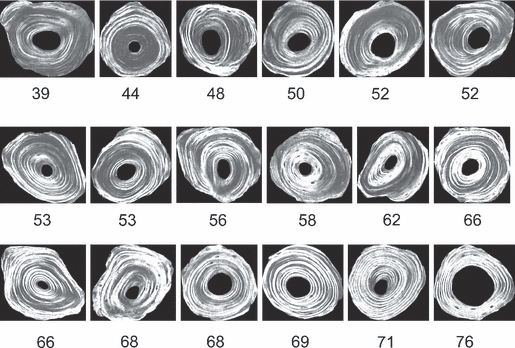
Template of 18 osteons that were used to aid observers in determining if osteons fall above or below the 50% WMGL cut-off for the brightness of the osteon wall. The values refer to the percent WMGLs that were calculated from the wall of each osteon from the 236 gray-level spectrum.
Scoring was facilitated with the use of a computer image-analysis program (adobe photoshop CS2, v.9.0.2; San Jose, CA, USA). Each observer would open the CPL image in the photoshop program and score each osteon using one of several different color-coded and numerically labeled dots indicating the possible morphotype scores (Fig. 13). The observer would then identify individual osteons and electronically ‘paste’ the appropriate dots on each osteon corresponding with their numerical scores. After each of the osteons received pasted dots, the images were printed and stored, and the scores were entered into a spreadsheet for statistical analysis.
Fig. 13.
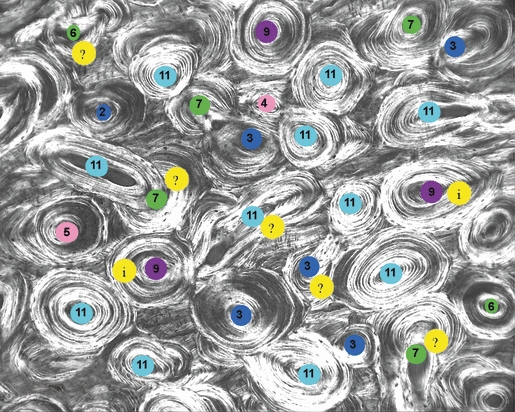
Representative image with osteon MTSs (colored dots corresponding to the 12A-MTS) and other symbols that are described in the text.
Scoring dilemmas and problems: 50% brightness and cement line determination
One of the most significant dilemmas encountered in the scoring process was that in many cases it was difficult to determine whether the osteon wall had overall brightness above or below the 50% threshold. If the observer could not easily determine whether the percent brightness was above or below 50% with the unaided eye while referring to the 18 osteon template, then the osteon was marked as ‘intermediate’ and given the label of ‘i’; this was electronically applied to the osteon in the photoshop program. Our initial intention was to determine the percent brightness of ca. 25% of all osteons using the same pixel routine used to obtain WMGL data for each CPL image. Although this pixel analysis routine yielded accurate WMGL data, it was deemed impractical because it was very time-consuming. Therefore, it was used only when there was a discrepancy between two observers (e.g. if one observer independently considered the osteon to be < 50% brightness and the other observer independently considered the osteon as being > 50% brightness) or if the osteon was marked with an ‘i’. The pixel analysis routine was used to determine percent brightness for ca. 8% of the ca. 10 500 osteons that were scored in this study.
In addition to the challenge of determining osteon wall brightness above or below 50%, the dilemma of accurately determining the location of the cement line of some osteons was encountered. The cement line is the outer boundary of the osteon (Skedros et al. 2005). For example, osteons with an unclear cement line can be atypical osteons, including drifting, dumbbell-shaped, and merging/splitting osteons (Skedros et al. 2007b; Keenan et al. 2010). In this case, subjective judgments are required that have the potential to increase error in the scoring. To reduce this error, atypical osteons (< 5% of all osteons scored) were excluded from scoring. The lead morphotype observer made the final judgment in these cases. Typically, two to three osteons per image were eliminated because they were not easy to score due to difficulty in determining the cement line.
For the remaining ‘typical’ osteons, one solution for accurately identifying the cement line was to have the principal investigator determine the cement lines of every osteon before they were scored. However, in this study a simpler method was used. This included having all the observers mark osteons in which the cement line was not completely distinguishable with a ‘?’ that was electronically applied to the image in the photoshop program. They also marked these osteons with the dots containing what they felt were the most appropriate MTSs. The final judgment in these cases was a consensus of the lead morphotype scorer and the principal investigator.
After all osteon identification and scoring dilemmas were resolved and all osteons that could be scored were scored, then all six MTSs (M-6-MTS, S-6-MTS, 12A-MTS, 12B-MTS, 3-MTSa, and 4-MTSa) for each osteon were entered into a spreadsheet. Adjustments for the re-scoring used in the 3-MTSb and 4-MTSb methods (Fig. 5) were then made. Average osteon MTS scores per image were calculated using described methods (Skedros et al. 2009) for each of the final eight scoring methods using the individual osteon scores from two observers.
Statistical analysis
For all statistical analyses, each of the five sections was considered independently. Also, in this study: (i) no attempt was made to analyze the outer (periosteal) and inner (endosteal) images because doing so was beyond the scope of the present study, and (ii) the analysis used octant data (i.e. the analysis did not use ‘regions’ that combined any of the octants). Pearson product-moment correlation coefficients (r values) were obtained for all comparisons between the average osteon MTSs and CFO/WMGL data from the octants at each of the five sections, and for all data from all sections combined. The magnitudes of the resulting correlation coefficients (r) were interpreted according to the classification of Hinkle et al. (1979). In this scheme, coefficients in the ranges of 0.9–0.99, 0.7–0.89, 0.5–0.69, 0.3–0.49, and 0.0–0.29 are interpreted as representing very high, high, moderate, low, and little if any correlation, respectively. Comparisons of average osteon MTSs and CFO/WMGL data between quadrants were assessed for statistical significance using a Kruskal–Wallis multiple-comparison anova design (Sokal & Rohlf, 1995; Number Cruncher Statistical Systems, 2004 version; J. Hintze, Kaysville, UT, USA). An alpha level of ≤ 0.05 was considered statistically significant. Only quadrant (four of the octant locations) comparisons are reported to better compare and contrast the sections that are believed to receive habitual bending (i.e. stereotypical loading in a generally predictable direction). The preferential loading regime and/or direction in each section were presumed to be: (i) medial-to-lateral bending in the proximal diaphyseal sections (70% and 80%; Skedros & Baucom, 2007), (ii) primarily torsion (no preferential bending direction) in the mid-diaphysis (50% sections; Skedros et al. 2006), and (iii) anterior-superior to posterior-inferior bending in the base- and mid-neck sections (Beckstrom et al. 2010).
Results
Examples of the osteon morphotypes from the proximal diaphyseal sections of one bone are shown in Fig. 3 of our previous study (Skedros et al. 2011).
Intra- and interobserver variations
For the 12A-MTS score, analysis of interobserver correlations showed statistically significantly high correlations between Observer 1 and Observer 2 (r = 0.73), and between Observer 1 and Observer 3 (r = 0.71), and a moderate correlation between Observer 2 and Observer 3 (r = 0.68; Table 1). Results are similar for the 12B-MTS (data not shown). As noted, examination of the intra- and interobserver correlations revealed that Observer 4 was not up to par with the other observers. Observer 4's intra-observer correlation was the lowest of the four (r = 0.86) and he had relatively low correlations with each of the other observers (r = 0.53, 0.33, and 0.32; Table 1). As described above, after the principal investigator evaluated the practice/training scores and the intra- and interobserver statistics, it was decided that the graduate student had the most consistent and accurate scores, and thus he was appointed ‘lead morphotype scorer’. At that time observer 4 was excused and his data were discarded because of his relatively weak intra- and interobserver correlations. In comparison with the 12-point methods, the 6-point, 3-point, and 4-point methods all had high inter- and intra-observer correlations, exceeding 0.85 and 0.80, respectively.
Pearson correlations (r values) for CFO/WMGL vs. osteon morphotype scores (MTSs)
Table 2 lists results of Pearson correlations obtained from octant data from each section and from data from all sections combined. These results show that the S-6-MTS method more strongly correlated with regional CFO/WMGL data than the 12B-MTS, 3-MTS, and 4-MTS methods. These results also show that the S-6-MTS method was, in nearly all cases, approximately equivalent to the 12A-MTS method. In contrast to the other scores, the M-6-MTS correlations were distinctly different, not only because they were moderate or low but because they were also negative.
Table 2.
Results of correlation analyses of CFO/WMGL with the osteon morphotype scores (MTSs)
 |
Summary of section data and non-parametric anovas of paired comparisons
Table 3 lists selected data from all octants of each section: (i) total number of secondary osteons per section and for each numerical value in the S-6-MTS, (ii) numbers of alternating and bright osteons, and the ratios of these morphotypes, (iii) population densities of all complete secondary osteons (N.On/T.Ar, no. mm−2) and the percentage of osteonal bone area in a total image area (T.Ar, excluding pores) [(On.B/T.Ar) × 100] (Skedros et al. 2009, 2011). Table 4 lists results of paired comparisons of average osteon MTSs and CFO/WMGL data between quadrants from each section location. In the torsion-loaded mid-diaphysis section (i.e. where broad shifts occur in the neutral axis) there were, as expected, no significant regional differences in CFO/WMGL, 12A-MTS, S-6-MTS, or 12B-MTS. However, the M-6-MTS showed a significant difference between posterior and lateral cortices at the mid-diaphysis. At mid-diaphysis there were also significant differences between posterior and anterior cortices in all of the 3- and 4-point scores.
Table 3.
Osteon numbers (total and for the S-6-MTS), population densities, and percentage osteonal bone areas at each section location
| Osteon numbers per sub-group | ||||||||||||
|---|---|---|---|---|---|---|---|---|---|---|---|---|
| S-6-MTS data | ||||||||||||
| Hooped groups | ||||||||||||
| Section | Total 2nd Osteons scored | On.N/T.Ar [no. mm−2] | On.B/T.Ar [%] | Dark ‘0’ | ‘1’ | ‘2’ | ‘3’ | ‘4’ | Distributed group (Alternating + Bright) ‘5’ | Alternating (A) | Bright (B) | A:B [ratio] |
| 50% | 2666 | 30.8 (7.1) | 70.2 (22.5) | 26 | 553 | 532 | 556 | 187 | 812 | 717 | 95 | 7.5 |
| 70% | 2830 | 31.6 (8.3) | 71.7 (24.8) | 36 | 594 | 504 | 585 | 200 | 911 | 807 | 104 | 7.8 |
| 80% | 2800 | 31.5 (7.2) | 74.4 (23.4) | 22 | 609 | 473 | 587 | 218 | 891 | 837 | 54 | 15.5 |
| Base neck | 1011 | 22.9 (8.6) | 61.8 (28.1) | 10 | 249 | 121 | 311 | 75 | 245 | 181 | 64 | 2.8 |
| Mid-neck | 1134 | 23.0 (8.9) | 60.5 (27.1) | 12 | 219 | 144 | 283 | 75 | 401 | 315 | 86 | 3.7 |
2nd, secondary; On.N/T.Ar, secondary osteon population density (‘OPD’); On.B/T.Ar, area of secondary bone expressed as a percentage ([On.B/T.Ar] × 100).
Means and (standard deviations) are shown for N.On/T.Ar and On.B/T.Ar; these parameters were determined using methods described by Skedros et al. (2009), Skedros et al. (2011).
Table 4.
Non-parametric anova results of paired comparisons of CFO/WMGL and the osteon morphotype scores (MTSs)
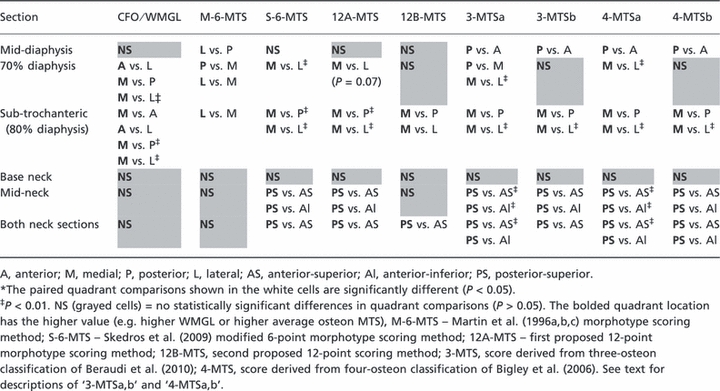 |
Examination of the data from the 70% and 80% diaphyseal sections also showed important differences between the S-6-MTS and the two 12-point methods. For example, in contrast to the statistically significant medial vs. lateral (‘compression’ vs. ‘tension’) difference in the S-6-MTS data (as expected), the 12A-MTS data showed a strain-mode-related trend (P = 0.07) while the 12B-MTS data showed no significant medial–lateral difference. However, the 4-MTSa and 3-MTSa scores corroborated the medial vs. lateral CFO/WMGL difference in this location. Although the M-6-MTS also showed a significant medial vs. lateral difference at the 70% location, the lateral ‘tension’ cortex had paradoxically higher scores (i.e. in the other schemes the higher MTS reflects ‘compression’ adaptation). At the 80% (sub-trochanteric) section, a paradoxical result was only shown by the M-6-MTS; otherwise the results in this section were similar when using all of the other MTS methods.
Figure 14 shows the prevalence of the osteon morphotypes from the quadrant locations (anterior, posterior, medial, and lateral) of the 70% and 80% diaphyseal sections for the following scores: 12A-MTS, S-6-MTS, 3-MTSa, and 4-MTSa. Examinations of the 3-MTSa and 4-MTSa data show that it was not necessary to distinguish the dark osteons from the hooped osteons in the 4-MTS method. This is because there are only 11 dark osteons in these four quadrants of the 70% and 80% diaphyseal locations. Hence, lumping the dark and the hooped osteons into one category (‘0’ score in the 3-MTS), as was done by Beraudi et al. (2010), did not degrade the ability of the 3-MTSa, when compared to the 4-MTSa, to detect regional morphotype differences or to correlate with CFO/WMGL (Tables 2 and 4).
Fig. 14.
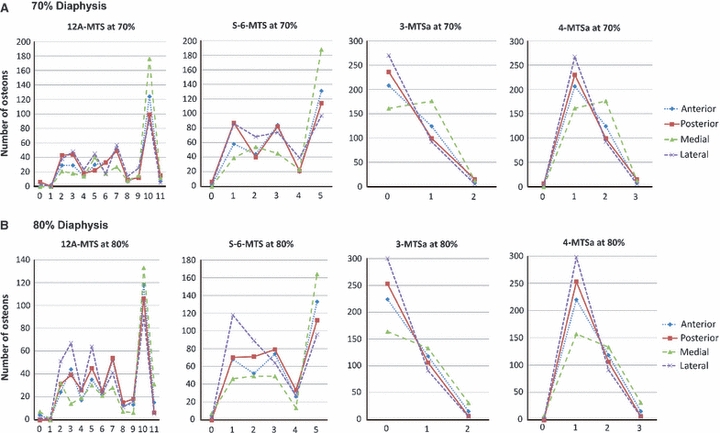
Mean data from anterior, posterior, medial, and lateral cortices of the 70% and 80% sections for the 12A-MTS, S-6-MTS, 3-MTSa, and 4-MTSa scores. The values along the x-axis (abscissa) are the individual osteon morphotype scores. Note that the S-6-MTS does not distinguish between alternating and distributed osteon morphotypes; these are lumped into the ‘distributed’ osteon group (scored as ‘5’, see Fig. 1).
Figure 14 also shows that, similar to the 3-MTSa and 4-MTSa methods, the 12A-MTS method allows for distinguishing alternating from bright osteons – this is not possible in the S-6-MTS. These 12A-MTS, 3-MTSa, and 4-MTSa methods also reveal the relatively high prevalence of alternating osteons. In the four quadrants of the 70% and 80% locations, there were only 96 bright osteons compared to 939 alternating osteons. Nevertheless, compared to these methods, the S-6-MTS method had higher, or equivalent (12A-MTS), strengths of correlations with CFO/WMGL because of the preponderance of alternating osteons in the ‘distributed’ group of the S-6-MTS (Table 3).
There were no significant regional differences in paired quadrant comparisons of the CFO/WMGL data in either the mid-neck or base-neck sections (left column of Table 4). Furthermore, in all cases the data from the base-neck region show no significant regional differences in osteon MTSs and CFO/WMGL (all columns in Table 4). By contrast, in the mid-neck regions the S-6-MTS, 12A-MTS, 3-MTSa,b, and 4-MTSa,b methods showed significant differences between posterior-superior vs. anterior-superior cortices, and between posterior-superior vs. anterior-inferior cortices. In this mid-neck comparison, the 12B-MTS method did not show significant regional differences in any of the paired comparisons. These results in the mid-neck are nearly identical to those obtained after combining both of the neck sections (bottom row in Table 4).
Section location analysis of hybrid osteon prevalence in torsion vs. bending
To demonstrate the potential use of the 12A-MTS for detecting osteonal adaptation for torsional loading, the regional percent prevalence of hybrid osteons was quantified and compared between the more torsionally loaded femoral neck and mid-diaphysis vs. the habitually bent proximal diaphysis. This analysis was only possible with data obtained from the 12A-MTS because it allows for the identification of osteon hybrids. In each of these three locations the combined percent prevalence (no. of all hybrids/total osteon count) was quantified using the following osteon hybrid morphotypes: 3, 5, 7, and 9 (Fig. 5). Although hybrid osteons are common in these locations (range 32–41% of all osteons), there were no significant differences in their percent prevalence (all P values > 0.2).
Discussion
Results of this study show that the S-6-MTS method was typically stronger and in some instances equivalent to the 12-point methods, and the S-6-MTS was nearly always stronger than the 3- and 4-point methods. Due to its emphasis on the peripheral hoop, the 12A-MTS was the only score that had similar correlation coefficients with the S-6-MTS. However, the S-6-MTS also had notably greater intra- and interobserver reliability than either of the 12-point methods. The S-6-MTS is also most obviously superior to both of the 12-point methods in the proximal diaphyseal sections where medial (compression) to lateral (tension) bending is prevalent. Although paired comparisons using the 3-MTS and 4-MTS methods are consistent with this bending direction, these relatively simpler scores revealed unexpected differences in the mid-diaphysis section (Table 4). The S-6-MTS is therefore more consistent in corroborating CFO/WMGL data in habitual bending and torsion environments. Compared to the S-6-MTS and all of the other methods, the M-6-MTS was distinctly different because it negatively correlated with CFO/WMGL. This reflects the fact that the M-6-MTS does not juxtapose the osteon morphotypes with the highest collagen birefringence (Figs 1 and 5).
The cantilevered morphology of the chimpanzee femoral head and neck appears to be the main reason that the proximal diaphysis likely experiences a medial–lateral (compression-tension) strain distribution (Kalmey & Lovejoy, 2002; Lovejoy et al. 2002; Skedros & Baucom, 2007). Support for this interpretation in the proximal diaphysis includes the higher (brighter) WMGLs in the medial cortex when compared to the lateral cortex. Evidence for the presence of prevalent torsion at the mid-diaphysis includes its more annular cross-sectional shape – this morphology suggests the presence of a broadly shifting neutral axis (Currey, 2002; Lieberman et al. 2004). A history of torsional loading at the mid-diaphysis would produce prevalent and more diffusely distributed shear stresses, which is consistent with our data showing no significant CFO/WMGL differences between any of the quadrants at the mid-diaphysis. However, at the mid-diaphysis there were significant differences between posterior vs. lateral cortices in the M-6-MTS data, and between posterior vs. anterior cortices in the 3-MTSa,b and 4-MTSa,b data; the S-6-MTS and the two 12-point methods showed no significant differences, as expected. These findings support the conclusion that the S-6-MTS and the two 12-point methods are less likely to lead to erroneous interpretations of load history in habitual torsion.
Regarding intra- and interobserver errors
One purpose of this study was to determine whether accuracy could be maintained when using several observers to reduce the time required for osteon scoring. This was an important practical consideration because the 12-point scoring methods are very time-consuming. Using more than one observer not only helps to ensure that the data can be independently corroborated, but also helps to identify errors, some of which might not have been anticipated and might not be easy to correct. The steps taken in preparing our observers for their scoring assignments clearly showed the importance/necessity of this process – we identified, and eliminated, an observer who could not correct his inconsistency and inaccuracy. Averaging scores was also deemed important in our study in view of the fact that when using the 12-point scores our best interobserver correlation was 0.73. This primarily reflects the difficulty in identifying hybrid osteons. By contrast, when using the S-6-MTS in the present study and in our previous study the interobserver correlations were on the order of 0.85–0.90 (Skedros et al. 2009). Nevertheless, automated methods are needed to increase accuracy and precision for all methods.
Future directions for advancing osteon MTSs – osteon diameter and hybrids
We do not deny that there is a role for osteon scoring schemes that are simpler than the S-6-MTS. For example, it may be important in some situations to make the bright vs. alternating distinction that is allowed by the 3- and 4-point MTS methods. Although the S-6-MTS showed stronger correlations with CFO/WMGL when compared to the 3-MTS and 4-MTS scores, it is limited by the fact that it does not distinguish bright osteons from alternating osteons – they are both considered to be distributed osteons (scored as ‘5’ in the S-6-MTS; Figs 1 and 14). By this logic, the 3-MTS, 4-MTS, and 12A-MTS scores might be of value in studies where it is deemed important to distinguish these two osteon morphotypes. This could be important in view of these facts: (i) bright and alternating osteons have significantly different mechanical properties in push-out tests (Bigley et al. 2006), (ii) shear strength decreases when the percentage of alternating osteons increases (Bigley et al. 2006), and (iii) alternating osteons are typically more prevalent than bright osteons. For example, in the present study we found that alternating osteons are 7.5-fold more prevalent than bright osteons (Table 3).
There may also be circumstances/situations where scoring methods that identify hybrid osteons are essential. A few examples could include studies of aging, degenerative conditions, or diseases where changes in the population densities of hybrid osteons could occur. Support for these possibilities is shown by the strong positive correlation between age and the percent prevalence of hybrid osteons that is revealed by Vincentelli's (1978) data from polarized light images of transversely sectioned human tibiae (n = 55; age range 18–85). Even in view of this finding, it is unclear why there are relatively more ‘hybrid’ secondary osteons in our chimpanzee femora than in the various non-primate bones we have studied. We suspect that the increased prevalence of hybrid osteons may not be ‘interspecies differences’per se but rather are adaptations for shear stresses produced by the more complex loading that likely occurs in most of the regions of the chimpanzee femur that we studied. However, our results did show significant differences in the population densities of hybrid osteons between the more habitually bent proximal diaphysis and the other locations where torsion is presumably more prevalent/predominant. Before conducting our study, we were aware that Vincentelli (1978) had described hybrid secondary osteons, but he did not devise a weighted scoring scheme. In that study, the distributions of five-osteon morphotypes were quantified, where the morphotypes that resembled our hooped/alternating hybrids were his ‘type 3’ or ‘intermediate’ osteons (ca. 20% of all osteons quantified). In Vincentelli's scheme, the numerical designation assigned to his ‘intermediate’ (hybrid) osteon was between his bright/alternating morphotypes (types 1 and 2) and darker morphotypes (types 4 and 5). Because Vincentelli examined only tibiae, there is no way to make comparisons about the percent prevalence of intermediate osteons in the tibiae with bones that receive less torsion. However, by evaluating quadrants (anterior, posterior, medial, and lateral), he was able to establish positive relationships between the prevalence of darker osteons with tension strains (anterior cortex) and the prevalence of brighter osteons with compression strains (posterior cortex).
Study limitations
One limitation of our study is that the animals were not wild. A question that then arises is whether the ambulatory activities of our chimpanzees were sufficient to evoke regional bone adaptations that resemble those in wild animals. There are data suggesting that very few loading cycles are sufficient for maintaining bone mass (Rubin et al. 1995, 1996). This might suggest that even brief amounts of loading are sufficient to produce regional strain-mode-related remodeling variations such as those shown in the bones examined in this study. This possibility can be adequately evaluated by studying the histomorphology of sections from bones of large samples of wild and captive chimpanzees. The only data that refer to this issue in larger primates that we could locate have been published in baboons (Schnitzler et al. 1993; McFadden & Bracht, 2003). Unfortunately, these two studies did not consider the microstructure of cortical bone. Nevertheless, they did not reveal clear differences in bone structure between captive and wild groups.
Another limitation is that we do not have in vivo strain data on our bones, nor could we locate in vivo strain data in the published literature dealing with the post-cranial skeleton of chimpanzees. Consequently, all of the inferences that are made in this study regarding the habitual loading environments of the various section locations are based on observations or indirect data. This is a constraint that makes this type of research necessarily retrospective in many bones, especially anthropoid bones.
Conclusions
In conclusion, the S-6-MTS method out-performed the 3-MTS, 4-MTS, and 12B-MTS methods by: (i) correlating more strongly (or equivalently with respect to the 12A-MTS) with CFO/WMGL at all of the five section locations; (ii) consistently showing statistically significant differences between ‘tension’ (lateral) vs. ‘compression’ (medial) cortices of the habitually bent proximal diaphysis while showing expected nonsignificant differences in the more torsionally loaded mid-diaphysis and femoral neck; and (iii) having much greater interobserver reliability than the 12-point methods. The S-6-MTS method is also superior to both of the 12-point methods because: (i) it showed much stronger or nearly equivalent correlations (12B-MTS and 12A-MTS, respectively): (ii) it required the designation of fewer osteon morphotypes, thus making the process less time-intensive and less prone to errors; and (iii) although osteon ‘hybrids’ of the hooped/alternating morphotypes are identified by the 12-point methods, a segregated analysis of their prevalence did not show any advantage over the S-6-MTS in revealing presumed prevalent/predominant torsion in the mid-diaphysis and neck regions. Consequently, in studies of osteonal bone adaptation for habitual bending and torsion, the 3- and 4-point methods are typically weaker than the S-6-MTS for these load histories, and the extra time required to assign six additional scores in the 12-point methods is both unnecessary and highly unreliable. However, the 12A-MTS, 3-MTSa, and 4-MTSa scores may be useful for applications that require distinctions to be drawn between alternating and bright osteons, and the 12A-MTS for applications that require distinguishing hybrid osteons. Automated methods need to be established for better accuracy and to allow data to be reliably compared between different laboratories.
Acknowledgments
The authors thank Adam Beckstrom, Pat Campbell and Jordan Nugent for their technical contributions to this project, and Roy Bloebaum for laboratory support at the Bone and Joint Research Laboratory at the Veterans Affairs Medical Center in Salt Lake City, Utah, USA. This project was supported by a grant from the Orthopaedic Research and Education Foundation (OREF 01-024) and by research funds of the Department of Veterans Affairs, USA and the Utah Bone and Joint Center, Salt Lake City, Utah, USA.
Appendix 1: Biomechanics of osteon morphotypes
We designed this study from the perspective/opinion that attempts at classifying secondary osteons must be based upon both morphological and mechanical contexts. This assertion is based on a series of investigations by Ascenzi and co-workers that focused on the mechanical properties of individual secondary osteons (Ascenzi & Bonucci, 1967, 1968, 1972; Ascenzi et al. 1973, 1982; Martin et al. 1998; Currey, 2002). These investigators showed that variations in osteonal lamellae orientation have significant effects on mechanical and fracture behaviors in specific types of loading, including compression, tension, shear, and bending. For example, in alternating osteons, each successive lamella adds additional durability to the osteon as a whole because the variations in lamellar morphology within the osteon wall help resist microdamage propagation (Martin et al. 1998; Currey, 2002; Bigley et al. 2006; Gupta et al. 2006). Differences in the matrix/lamellar organization that distinguish hooped from alternating osteons may be a principal way that osteonal bone accommodates a locally prevalent strain mode (tension, compression, or shear) without incurring a deleterious amount of strain-mode-specific microdamage (Boyce et al. 1998; Ebacher et al. 2007; Mendenhall et al. 2007; Horn et al. 2010).
Bigley et al. (2006) recently advanced the mechanical pushout methods pioneered by Ascenzi and co-workers and reported important details of the mechanical properties of individual osteons in isolation and with consideration of the histomorphology of their surrounding matrix. Using the diaphysis of the third metacarpal of a thoroughbred horse and observations in both polarized light and scanning electron microscopy, their experimental study revealed clear differences in interfacial strength associated with variations in CFO that typify the four osteon morphotypes that they evaluated (Fig. 4). In their pushout tests, ‘interfacial’ failure was typically observed at the cement line ‘interface’ or within the osteon wall (i.e. interlamellar ‘interface’). For alternating osteons the cement line is weaker (12.4 MPa) than the interlamellar interface (33.3 MPa, P = 0.04). By contrast, the cement line is stronger for the bright osteon (47.1 MPa) than for the interlamellar interface (33.4 MPa, P = 0.04). Overall, bright osteons had the highest interfacial debonding strength (40.3 MPa), and dark osteons had the lowest strength (22.8 MPa; P < 0.05). In terms of maximum interfacial shear stress, the bright osteons also had highest stress (82.6 MPa), the dark osteons had the least (63.6 MPa; P < 0.05), and alternating and hooped osteons had intermediate values (76.3 MPa and 71.0 MPa, respectively). Their linear regression analyses also suggest that there may be a relationship between the amount of oblique-to-transverse CFO (compression-adapted collagen in the osteon wall) and these important mechanical properties, independent of the presence of alternating rings. The histomorphology of the surrounding matrix also profoundly influenced the shear strength of the osteons. For example, as the fractions of bright, dark, and hooped osteons increased, the debond shear strength increased, whereas when alternating osteons increased, the shear debond strength decreased. In view of these mechanical test results, it is clear that osteon MTSs that are based in mechanical and morphological contexts should distinguish bright from alternating osteons in addition to distinguishing hooped from non-hooped osteons.
References
- Ascenzi A, Bonucci E. The tensile properties of single osteons. Anat Rec. 1967;158:375–386. doi: 10.1002/ar.1091580403. [DOI] [PubMed] [Google Scholar]
- Ascenzi A, Bonucci E. The compressive properties of single osteons. Anat Rec. 1968;161:377–391. doi: 10.1002/ar.1091610309. [DOI] [PubMed] [Google Scholar]
- Ascenzi A, Bonucci E. The shearing properties of single osteons. Anat Rec. 1972;172:499–510. doi: 10.1002/ar.1091720304. [DOI] [PubMed] [Google Scholar]
- Ascenzi A, Bonucci E, Simkin A. An approach to the mechanical properties of single osteonic lamellae. J Biomech. 1973;6:227–235. doi: 10.1016/0021-9290(73)90044-4. [DOI] [PubMed] [Google Scholar]
- Ascenzi A, Benvenuti A, Bonucci E. The tensile properties of single osteonic lamellae: technical problems and preliminary results. J Biomech. 1982;15:29–37. doi: 10.1016/0021-9290(82)90032-x. [DOI] [PubMed] [Google Scholar]
- Beckstrom A, Skedros J, Kiser C, et al. Predominant collagen fiber orientation data support the multi-domain load hypothesis in the chimpanzee femur. Am J Phys Anthropol Suppl. 2010;50:63. [Google Scholar]
- Beraudi A, Stea S, Bordini B, et al. Osteon classification in human fibular shaft by circularly polarized light. Cells Tissues Organs. 2010;191:260–268. doi: 10.1159/000240045. [DOI] [PubMed] [Google Scholar]
- Bigley RF, Griffin LV, Christensen L, et al. Osteonal interfacial strength and histomorphometry of equine cortical bone. J Biomech. 2006;39:1629–1640. doi: 10.1016/j.jbiomech.2005.05.006. [DOI] [PubMed] [Google Scholar]
- Bloebaum RD, Skedros JG, Vajda EG, et al. Determining mineral content variations in bone using backscattered electron imaging. Bone. 1997;20:485–490. doi: 10.1016/s8756-3282(97)00015-x. [DOI] [PubMed] [Google Scholar]
- Boyce TM, Fyhrie DP, Glotkowski MC, et al. Damage type and strain mode associations in human compact bone bending fatigue. J Orthop Res. 1998;16:322–329. doi: 10.1002/jor.1100160308. [DOI] [PubMed] [Google Scholar]
- Boyde A, Riggs CM. The quantitative study of the orientation of collagen in compact bone slices. Bone. 1990;11:35–39. doi: 10.1016/8756-3282(90)90069-b. [DOI] [PubMed] [Google Scholar]
- Bromage TG, Goldman HM, McFarlin SC, et al. Circularly polarized light standards for investigations of collagen fiber orientation in bone. Anat Rec. 2003;274B:157–168. doi: 10.1002/ar.b.10031. [DOI] [PubMed] [Google Scholar]
- Currey JD. Bones: Structure and Mechanics. Princeton: Princeton University Press; 2002. [Google Scholar]
- Ebacher V, Tang C, McKay H, et al. Strain redistribution and cracking behavior of human bone during bending. Bone. 2007;40:1265–1275. doi: 10.1016/j.bone.2006.12.065. [DOI] [PubMed] [Google Scholar]
- Emmanual J, Hornbeck C, Bloebaum RD. A polymethyl methacrylate method for large specimens of mineralized bone with implants. Stain Technol. 1987;62:401–410. doi: 10.3109/10520298709108030. [DOI] [PubMed] [Google Scholar]
- Gupta H, Stachewicz U, Wageraier W, et al. Mechanical modulation at the lamellar level in osteonal bone. J Mater Res. 2006;21:1913–1921. [Google Scholar]
- Hiller LP, Stover SM, Gibson VA, et al. Osteon pullout in the equine third metacarpal bone: effects of ex vivo fatigue. J Orthop Res. 2003;21:481–488. doi: 10.1016/S0736-0266(02)00232-2. [DOI] [PubMed] [Google Scholar]
- Hinkle DE, Wiersma W, Jurs WG. Applied Statistics for the Behavioral Sciences. Chicago: Rand McNally College Pub. Co; 1979. [Google Scholar]
- Horn J, Williams T, Mendenhall SD, et al. Microdamage morphology and distribution in the OVX fatigue-loaded rat ulna: effects of absolute estrogen status and strain mode on microdamage accumulation and repair. 2010. 56th Annual Meeting of the Orthopaedic Research Society 173.
- Kalmey JK, Lovejoy CO. Collagen fiber orientation in the femoral necks of apes and humans: do their histological structures reflect differences in locomotor loading? Bone. 2002;31:327–332. doi: 10.1016/s8756-3282(02)00828-1. [DOI] [PubMed] [Google Scholar]
- Keenan K, Knight A, Tingey S, et al. Drifting osteons occur in higher concentrations in habitual tension environments: a microstructural toughening mechanism? Am J Phys Anthropol Suppl. 2010;50:140. [Google Scholar]
- Lieberman DE, Polk JD, Demes B. Predicting long bone loading from cross-sectional geometry. Am J Phys Anthropol. 2004;123:156–171. doi: 10.1002/ajpa.10316. [DOI] [PubMed] [Google Scholar]
- Lovejoy CO, Meindl RS, Ohman JC, et al. The Maka femur and its bearing on the antiquity of human walking: applying contemporary concepts of morphogenesis to the human fossil record. Am J Phys Anthropol. 2002;119:97–133. doi: 10.1002/ajpa.10111. [DOI] [PubMed] [Google Scholar]
- Marotti G. The structure of bone tissues and the cellular control of their deposition. Ital J Anat Embryol. 1996;101:25–79. [PubMed] [Google Scholar]
- Martin RB, Ishida J. The relative effects of collagen fiber orientation, porosity, density, and mineralization on bone strength. J Biomech. 1989;22:419–426. doi: 10.1016/0021-9290(89)90202-9. [DOI] [PubMed] [Google Scholar]
- Martin RB, Gibson VA, Stover SM, et al. Osteonal structure in the equine third metacarpus. Bone. 1996a;19:165–171. doi: 10.1016/8756-3282(96)00167-6. [DOI] [PubMed] [Google Scholar]
- Martin RB, Mathews PV, Lau ST, et al. Collagen fiber organization is related to mechanical properties and remodeling in equine bone. A comparison of two methods. J Biomech. 1996b;29:1515–1521. [PubMed] [Google Scholar]
- Martin RB, Mathews PV, Lau ST, et al. Use of circularly vs. plane polarized light to quantify collagen fiber orientation in bone. Trans Orthop Res Soc. 1996c;21:606. [Google Scholar]
- Martin R, Burr D, Sharkey N. Mechanical properties of bone. In: xxx xx, xxxx xx., editors. Skeletal Tissue Mechanics. New York: Springer-Verlag New York, Inc; 1998. pp. 127–180. [Google Scholar]
- Mason MW, Skedros JG, Bloebaum RD. Evidence of strain-mode-related cortical adaptation in the diaphysis of the horse radius. Bone. 1995;17:229–237. doi: 10.1016/8756-3282(95)00213-w. [DOI] [PubMed] [Google Scholar]
- McFadden D, Bracht MS. The relative lengths and weights of metacarpals and metatarsals in baboons (Papio hamadryas) Horm Behav. 2003;43:347–355. doi: 10.1016/s0018-506x(02)00048-x. [DOI] [PubMed] [Google Scholar]
- McFarlin SC, Terranova CJ, Zihlman AL, et al. Regional variability in secondary remodeling within long bone cortices of catarrhine primates: the influence of bone growth history. J Anat. 2008;213:308–324. doi: 10.1111/j.1469-7580.2008.00947.x. [DOI] [PMC free article] [PubMed] [Google Scholar]
- Mendenhall S, Kitterman R, Skedros JG. Microdamage morphology and distribution in the fatigue-loaded rat ulna: Effects of age and strain mode on osteon-related repair. 2007. 53nd Annual Meeting of the Orthopaedic Research Society.
- Neville AC. Optical methods in cuticle research. In: Miller TA, editor. Cuticle Techniques in Arthropods. New York: Springer-Verlag; 1980. pp. 45–89. [Google Scholar]
- Riggs CM, Lanyon LE, Boyde A. Functional associations between collagen fibre orientation and locomotor strain direction in cortical bone of the equine radius. Anat Embryol. 1993a;187:231–238. doi: 10.1007/BF00195760. [DOI] [PubMed] [Google Scholar]
- Riggs CM, Vaughan LE, Boyde A, et al. Mechanical implications of collagen fibre orientation in cortical bone of the equine radius. Anat Embryol. 1993b;187:239–248. doi: 10.1007/BF00195761. [DOI] [PubMed] [Google Scholar]
- Rubin CT, Gross TS, McLeod KJ, et al. Morphologic stages in lamellar bone formation stimulated by a potent mechanical stimulus. J Bone Miner Res. 1995;10:488–495. doi: 10.1002/jbmr.5650100321. [DOI] [PubMed] [Google Scholar]
- Rubin CT, Fritton S, Sun YQ, et al. Biomechanical parameters which stimulate bone formation: the ugly duckling of the skeletal growth factors. In: Davidovitch Z, Norton LA, editors. Biological Mechanisms of Tooth Movement and Craniofacial Adaptation. Boston: Harvard Society for the Advancement of Orthodontics; 1996. pp. 51–59. [Google Scholar]
- Schnitzler CM, Ripamonti U, Mesquita JM. Bone histomorphometry in baboons in captivity. Bone. 1993;14:383–387. doi: 10.1016/8756-3282(93)90168-a. [DOI] [PubMed] [Google Scholar]
- Skedros JG. Collagen fiber orientation in skeletal tension/compression systems: a potential role of variant strain stimuli in the maintenance of cortical bone organization. J Bone Miner Res. 1994;9:S251. [Google Scholar]
- Skedros JG. Collagen fiber orientation: a characteristic of strain-mode-related regional adaptation in cortical bone. Bone. 2001;28:S110–S111. [Google Scholar]
- Skedros JG, Baucom SL. Mathematical analysis of trabecular ‘trajectories’ in apparent trajectorial structures: the unfortunate historical emphasis on the human proximal femur. J Theor Biol. 2007;244:15–45. doi: 10.1016/j.jtbi.2006.06.029. [DOI] [PubMed] [Google Scholar]
- Skedros JG, Hunt KJ. Does the degree of laminarity mediate site-specific differences in collagen fiber orientation in primary bone? An evaluation in the turkey ulna diaphysis. J Anat. 2004;205:121–134. doi: 10.1111/j.0021-8782.2004.00318.x. [DOI] [PMC free article] [PubMed] [Google Scholar]
- Skedros JG, Mason MW, Nelson MC, et al. Evidence of structural and material adaptation to specific strain features in cortical bone. Anat Rec. 1996;246:47–63. doi: 10.1002/(SICI)1097-0185(199609)246:1<47::AID-AR6>3.0.CO;2-C. [DOI] [PubMed] [Google Scholar]
- Skedros JG, Hunt KJ, Bloebaum RD. Relationships of loading history and structural and material characteristics of bone: development of the mule deer calcaneus. J Morphol. 2004;259:281–307. doi: 10.1002/jmor.10167. [DOI] [PubMed] [Google Scholar]
- Skedros JG, Holmes JL, Vajda EG, et al. Cement lines of secondary osteons in human bone are not mineral-deficient: new data in a historical perspective. Anat Rec A Discov Mol Cell Evol Biol. 2005;286:781–803. doi: 10.1002/ar.a.20214. [DOI] [PubMed] [Google Scholar]
- Skedros JG, Dayton MR, Sybrowsky CL, et al. The influence of collagen fiber orientation and other histocompositional characteristics on the mechanical properties of equine cortical bone. J Exp Biol. 2006;209:3025–3042. doi: 10.1242/jeb.02304. [DOI] [PubMed] [Google Scholar]
- Skedros JG, Sorenson SM, Hunt KJ, et al. Ontogenetic structural and material variations in ovine calcanei: a model for interpreting bone adaptation. Anat Rec. 2007a;290:284–300. doi: 10.1002/ar.20423. [DOI] [PubMed] [Google Scholar]
- Skedros JG, Sorenson SM, Jenson NH. Are distributions of secondary osteon variants useful for interpreting load history in mammalian bones? Cells Tissues Organs. 2007b;185:285–307. doi: 10.1159/000102176. [DOI] [PubMed] [Google Scholar]
- Skedros JG, Mendenhall SD, Kiser CJ, et al. Interpreting cortical bone adaptation and load history by quantifying osteon morphotypes in circularly polarized light images. Bone. 2009;44:392–403. doi: 10.1016/j.bone.2008.10.053. [DOI] [PubMed] [Google Scholar]
- Skedros JG, Kiser CJ, Mendenhall SD. A weighted osteon morphotype score outperforms regional osteon percent prevalence calculations for interpreting cortical bone adaptation. Am J Phys Anthropol. 2011;144:41–50. doi: 10.1002/ajpa.21365. [DOI] [PubMed] [Google Scholar]
- Sokal RR, Rohlf FJ. Biometry. The Principles and Practice of Statistics in Biological Research. 3rd edn. New York: W.H. Freeman and Co; 1995. [Google Scholar]
- Takano Y, Turner CH, Owan I, et al. Elastic anisotropy and collagen orientation of osteonal bone are dependent on the mechanical strain distribution. J Orthop Res. 1999;17:59–66. doi: 10.1002/jor.1100170110. [DOI] [PubMed] [Google Scholar]
- Tommasini SM, Nasser P, Schaffler MB, et al. Relationship between bone morphology and bone quality in male tibias: implications for stress fracture risk. J Bone Miner Res. 2005;20:1372–1380. doi: 10.1359/JBMR.050326. [DOI] [PubMed] [Google Scholar]
- Vajda EG, Skedros JG, Bloebaum RD. Errors in quantitative backscattered electron analysis of bone standardized by energy-dispersive x-ray spectrometry. Scanning. 1998;20:527–535. doi: 10.1002/sca.1998.4950200708. [DOI] [PubMed] [Google Scholar]
- Vincentelli R. Relation between collagen fiber orientation and age of osteon formation in human tibial compact bone. Acta Anat (Basel) 1978;100:120–128. doi: 10.1159/000144890. [DOI] [PubMed] [Google Scholar]
- Warshaw J. Anthropology. New York: The City University of New York; 2007. Primate bone microstructural variability: relationships to life history, mechanical adaptation and phylogeny. [Google Scholar]
- Yamamoto T, Domon T, Takahashi S, et al. Twisted plywood structure of an alternating lamellar pattern in cellular cementum of human teeth. Anat Embryol (Berl) 2000;202:25–30. doi: 10.1007/pl00008241. [DOI] [PubMed] [Google Scholar]
- Zimmermann EA, Launey ME, Barth HD, et al. Mixed-mode fracture of human cortical bone. Biomaterials. 2009;30:5877–5884. doi: 10.1016/j.biomaterials.2009.06.017. [DOI] [PubMed] [Google Scholar]


