

Abstract
Mechanical allodynia, the perception of innocuous tactile stimulation as painful, is a severe symptom of chronic pain often produced by damage to peripheral nerves. Allodynia affects millions of people and remains highly resistant to classic analgesics and therapies. Neural mechanisms for the development and maintenance of allodynia have been investigated in the spinal cord, brainstem, thalamus, and forebrain, but manipulations of these regions rarely produce lasting effects. We found that long-term alleviation of allodynic manifestations is produced by discreetly lesioning a newly discovered somatosensory representation in caudal granular insular cortex (CGIC) in the rat, either before or after a chronic constriction injury of the sciatic nerve. However, CGIC lesions alone have no effect on normal mechanical stimulus thresholds. In addition, using electrophysiological techniques, we reveal a corticospinal loop that could be the anatomical source of the influence of CGIC on allodynia.
Introduction
Pain responses to otherwise innocuous tactile stimuli (mechanical allodynia) promote protective behaviors for healing. However, when the nociceptive system itself is damaged, allodynia is a primary and debilitating symptom of neuropathic pain and presents a chronic syndrome that is highly resistant to analgesics or surgical intervention.
Research concerning the mechanisms of allodynia has focused on sensitization of both the PNS and CNS (Campbell and Meyer, 2006). Models of central sensitization have concentrated on spinal circuits primarily, but supraspinal modulation seems an essential adaptive mechanism to modify pain-evoked spinal reflexes according to immediate behavioral requirements. It is also at supraspinal levels that pain is most likely perceived, and thus its modulation here seems teleologically congruent. However, in cases of peripheral or central damage to the nociceptive system, supraspinal modulation may also be maladaptive and play a key role in allodynia as well as other neuropathic pain syndromes (Campbell and Meyer, 2006; Apkarian et al., 2009; Sandkühler, 2009). Much research concerning supraspinal modulation has focused on control centers within the brainstem (Fields and Basbaum, 1999; Porreca et al., 2002), in which it has been proposed that a spinal–brainstem–spinal positive feedback loop may facilitate and maintain neuropathic pain states, yet pharmacological and surgical manipulation of these centers does not produce long-term relief from allodynia, turning attention to other supraspinal areas (Saadé and Jabbur, 2008; Apkarian et al., 2009).
In the forebrain, the insular cortex is of interest because human imaging studies suggest its activation in neuropathic pain syndromes (Peyron et al., 1998; Ostrowsky et al., 2002; Becerra et al., 2006; Witting et al., 2006; Alvarez et al., 2009). Similarly, several animal studies have described responses of a distinct rostral region of the rat insula, the rostral agranular insular cortex (RAIC), to persistent inflammatory (Wei et al., 2001; Lei et al., 2004) as well as neuropathic pain (Alvarez et al., 2009), and have indicated a role in modulation of acute pain thresholds (Jasmin et al., 2003) and allodynia (Coffeen et al., 2011). In contrast, there have been no reports of the involvement of caudal granular insular cortex (CGIC) in acute or chronic pain modulation. This is surprising given that high-resolution epicortical evoked potential mapping has shown recently that CGIC, and not RAIC, is highly responsive to somatosensory stimulation and has a clear somatotopic organization (Benison et al., 2007; Rodgers et al., 2008).
Here, we examined the effect of lesioning CGIC on allodynia produced by chronic constriction injury (CCI) of the sciatic nerve. We optimized the CCI model and the behavioral testing conditions to create stable allodynia for 2–3 months (Milligan et al., 2006a,b; Sloane et al., 2009). We performed tract tracing to determine efferent pathways potentially underlying the effect of CGIC lesions on allodynia. Finally, we recorded unit activity of the lumbar dorsal horn in response to stimulation/inactivation of CGIC and primary somatosensory cortex (SI), as well as in response to stimulation of the sciatic nerve, to functionally evaluate corticospinal modulation.
Materials and Methods
All procedures were performed in accordance with University of Colorado Institutional Animal Care and Use Committee guidelines for the humane use of laboratory animals in biological research.
Evoked potential mapping.
Male Sprague Dawley rats (300–400 g) were anesthetized to surgical levels using subcutaneous injections of ketamine–xylazine–acepromazine (45, 9, and 1.5 mg/kg body weight, respectively), placed on a regulated heating pad, and maintained with subsequent injections throughout the experiment so that the eyeblink reflex could be barely elicited. A unilateral craniotomy was performed over the right hemisphere extending from bregma to 3 mm rostral of lambda and from the midsagittal suture past the lateral aspect of the temporal bone, exposing a maximal area of the surgically accessible hemisphere. The dura was reflected and the exposed cortex regularly irrigated with Ringer's solution containing the following (in mm): 135 NaCl, 3 KCl, 2 MgCl, and 2 CaCl, pH 7.4 (at 37°C).
Somatosensory responses were evoked by electrical stimulation of the contralateral forepaw, hindpaw, and midtrunk that were shaved and coated with conductive jelly. A bipolar electrode (500 μm tips; 1.0 mm separation) attached to a constant-current source delivered biphasic current pulses to the exposed skin. Auditory click stimuli (0.1 ms monophasic pulses) were delivered using a high-frequency piezoelectric speaker placed ∼15 cm lateral to the contralateral ear (ear bars removed). During auditory and somatosensory stimulation, intensities were adjusted to the lowest level, yielding a stable evoked potential. Adequate auditory stimuli were ∼30 dB sound pressure level at 15 cm. Somatosensory stimuli were 0.5–1.5 mA square wave pulses (1.0 ms), shown in previous studies to reliably evoke potentials in the somatosensory field of CGIC (CGIC is labeled PV or ISF in previous works) (Benison et al., 2007; Rodgers et al., 2008). In some rats, whisker stimulation was also provided by 0.1 ms pulses delivered to a solenoid with attached 3.0 cm armature constructed from hypodermic tubing. Whisker displacements were ∼0.5 mm on the rostrocaudal axis (Benison et al., 2007).
Epipial maps of somatosensory (SEPs) and auditory (AEPs) evoked potentials were recorded using a flat multielectrode array consisting of 256 Ag wires in a 16 × 16 grid (tip diameter, ∼100 μm; interelectrode spacing, 500 μm) covering a 7.5 × 7.5 mm area of the left hemisphere in a single placement (Benison et al., 2007; Rodgers et al., 2008). The array was pressed against the cortex with sufficient force to establish contact of all electrodes. The required pressure had no effect on evoked potential amplitude, poststimulus latency, or morphology when compared with potentials recorded previously with more lightly placed small arrays. Recordings were referenced to a Ag/AgCl ball electrode secured over the contralateral frontal bone and were simultaneously amplified (2000×; NerveAmp; Center for Neural Recording, Washington State University, Pullman, WA), analog filtered (bandpass cutoff, −6 dB at 0.1–3000 Hz; roll-off, 5 dB/octave), and digitized at 10 kHz. Evoked potentials were averaged over 64 stimulus presentations. SEPs and AEPs were mapped in six rats without lesions to establish the locations of primary and secondary somatosensory and auditory cortex [SI, SII, primary auditory cortex (AI), and AII, respectively], as well as the somatosensory and auditory fields of CGIC in relationship to skull landmarks. Similar mapping was used to functionally verify the completeness of insular lesions in subsequent rats.
Spinal multiunit recording during stimulation/inactivation of CGIC and SI.
In eight rats, a laminectomy exposed ∼10 mm of dorsal spinal cord at the lumbar enlargement (dura reflected) for laminar recording of multiunit activity (MUA). The spine was stabilized with clamps positioned just rostral and caudal to the laminectomy. A single large stainless steel surface electrode (tip diameter, ∼100 μm) was used to map the location of the largest sciatic evoked response in the ipsilateral spinal cord. Once this was established, a linear 16-electrode array (10 μm2 contacts, 100 μm spacing) was inserted ∼1 mm lateral to midline into the left dorsal horn of the region with the largest sciatic evoked response until the top electrode was barely visible at the surface (see Fig. 7E). Potentials were simultaneously amplified (1000×), analog filtered (bandpass cutoff, −6 dB at 300–3000 Hz; roll-off, 5 dB/octave), and digitized at 10 kHz. Single trials (300 ms duration; n = 64) of evoked activity were stored for subsequent computation of MUA. In all rats, the left sciatic nerve (SN) was exposed and isolated at the midthigh level. A pair of silver hook electrodes were placed around the SN for stimulation (silver, Teflon-coated except for the hooks, 0.5 mm spacing). The exposed nerve was covered with mineral oil at 37°C to prevent drying. Electrical stimulation was applied to the SN via a constant-current device (World Precision Instruments) in 1.0 ms square biphasic pulses, at minimum current sufficient to evoke reliable responses (0.4–0.6 mA). Spinal responses were also recorded during surface cortical stimulation (0.4–0.8 mA; 1.0 ms biphasic pulses) of CGIC or SI using a bipolar stainless steel electrode (0.5 mm contact spacing) straddling the hindlimb representation of the target cortical region. Sciatic and CGIC evoked responses were repeated in four rats after inactivation of CGIC using cortical injection of muscimol (5 μl of 9 μm muscimol, dissolved in 0.01 m PBS, was injected at 700 μm depth into the center of the target cortical site; a small, 1.0-mm-diameter piece of filter paper was placed over the injection site immediately after needle (Hamilton) extraction to prevent spread of excess solution beyond the target region]. Cortical evoked responses were mapped after each experiment to ensure focal suppression of the target region and no effect on nontarget regions. Similar responses were recorded in the remaining four rats after muscimol inactivation of the hindlimb representation of SI.
Figure 7.

CGIC activation contributes to the late multiunit response in dorsal horn lumbar spinal cord. A, Electrical stimulation of contralateral CGIC alone elicits robust, late (on latency 25.2 ± 2.1 ms) MUA, measured by a laminar electrode (1 × 16, 100 μm spacing), in layers 4–6 (dashed box) of the lumbar enlargement. MUA for all 64 individual trials under each condition is collapsed across each electrode in all the laminar figures. B, After inactivation of CGIC by muscimol injection, no additional spinal MUA is elicited by electrical CGIC stimulation (pre-CGIC inactivation, or data from A shown in blue and post-inactivation shown in red). C, Electrical stimulation of the ipsilateral sciatic nerve evoked two bursts of MUA in the same recording site as A and B. An early component (a) mostly confined to the layers 1–4 of the dorsal horn and a late component (b) that begins 43.1 ± 1.4 ms after the early component and is primarily restricted to layers 4–6 (dashed box). D, Sciatic stimulation MUA before CGIC activation, or data from C is shown in blue, and MUA from sciatic stimulation after CGIC inactivation is shown in red. After CGIC inactivation sciatic stimulation failed to evoke late-phase MUA in layers 4–6 and attenuated the early component (arrow; did not reach significance). E, Photomicrograph of Nissl-stained lumbar spinal tissue, showing laminar electrode placement. Laminae are marked with red dashed lines. Black arrows indicate the corresponding electrical traces from C. The dashed box highlights electrodes in which CGIC effects were observed. D, Dorsal; L, lateral. F, Quantified MUA from D showing MUA in spinal cord, evoked by sciatic stimulation, subdivided into dorsal and ventral electrodes; blue bars represent data before CGIC inactivation and red bars represent MUA data after CGIC inactivation. MUA magnitude is normalized to the maximum across electrodes and conditions for a given rat and therefore can range from 0.0 to 1.0. *p ≤ 0.05.
Chronic insular lesions.
Surgical anesthesia was the same as used for electrophysiology. An incision was made over the temporalis muscle, which was bluntly dissected to reveal the squamosal and frontal bones. Two burr holes over each hemisphere were made, separated by 1.0 mm on the rostrocaudal axis. It should be noted that all CGIC lesions in the study were done bilaterally. The exact coordinates of the burr holes were based on skull landmarks derived from field potential mapping of somatosensory and auditory fields within CGIC. Based on these coordinates, bilateral lesions were made through one burr hole located 4.0 mm rostral and 1.0 mm dorsal, and another 3.0 mm rostral and 0.0 mm dorsal to the foramen located on the squamosal bone dorsal to the connection of the zygomatic arch. Burr holes allowed for injection of 0.28 μl of NMDA (5%) solution in 0.01 m PBS at a depth of 600 and 300 μm by a microinjector (Nanoliter 2000; World Precision Instruments) mounted on a stereotaxic positioner. After the injection, the burr holes were filled with warmed (35°C) paraffin wax (95%) and mineral oil (5%) solution and cemented in place with dental cement. The incisions were sutured, and the rats were monitored closely for the next 7 d. Postoperative and maintenance doses of 0.9% saline (10 ml) were administered after recovery from anesthesia. No systemic analgesics were used during recovery, because these could create confounds for measurement of allodynia. However, topical lidocaine and antibiotic was applied to the wounds for 5 d postsurgically. Sham lesion rats received identical procedures, including microinjector insertions but with no NMDA injected.
Chronic constriction injury and behavioral tests.
CCI was created at midthigh level of the left hindleg as described previously (Bennett and Xie, 1988). Four sterile, surgical chromic gut sutures (cuticular 4-0, chromic gut, 27 inches, cutting FS-2; Ethicon) were loosely tied around the isolated sciatic nerve under isoflurane anesthesia (Phoenix Pharmaceutical). Only control rats in Figure 5 did not receive CCI ligations.
Figure 5.

CGIC lesions do not affect low- or high-threshold mechanical sensitivity. A, Bilateral CGIC or sham lesion was performed after baseline measurement at day 0 (dashed line). The reversal period for CGIC lesion attenuation of allodynia defined in Figure 4 is shaded. B, High-threshold mechanical sensitivity was tested at the end of von Frey measurements to determine whether CGIC lesions reduced high-threshold sensitivity. Post hoc analysis showed no significant difference in either paw between CGIC (black bars) and sham lesion (white bars; p > 0.05).
All rats were acclimated to the colony room for 1 week after arrival before any experimental or behavioral conditions were tested. Rats were then gently handled by the experimenter for 5 min on 3 consecutive days. Rats were allowed to habituate to the testing room, conditions, and apparatus (quiet room with low-intensity red light and room temperature of 82–84°F) on four occasions before the initial von Frey baseline test. A von Frey test (Chaplan et al., 1994) for mechanical allodynia was performed in the rear portion of the plantar surface of the left and right hindpaws, an area known to be innervated by the sciatic nerve (Chacur et al., 2001; Milligan et al., 2001). A logarithmic series of 10 calibrated Semmes–Weinstein monofilaments (von Frey hairs; Stoelting) were applied randomly to the left and right hindpaws to define the threshold stimulus intensity required to elicit a paw-withdrawal response. In all cases, rats responded to the presentation of the von Frey monofilament with a brisk withdrawal response on three consecutive trials. Baseline and control responses to thicker filaments were within stimulation parameters that did not cause a physical lift of the rat's paw, and in no case was a response on any experiment above this stimulation threshold. Log stiffness of the hairs was determined by log10 (milligrams × 10) and ranged from 3.61 (4.07 g) to 5.18 (15.136 g). The behavioral responses were used to calculate absolute threshold (the 50% paw-withdrawal threshold) by fitting a Gaussian integral psychometric function using a maximum-likelihood fitting method (Harvey, 1986; Treutwein and Strasburger, 1999; Milligan et al., 2000, 2001). This fitting method allowed parametric analyses that otherwise would not be appropriate (Milligan et al., 2000, 2001). In the first group of rats, CGIC (n = 11) or sham (n = 11) lesions were performed 14 d before CCI ligation, and subsequent behavioral testing was continued for 90 d after CCI ligation. In a second group of rats, CGIC (n = 6) or sham (n = 6) lesions were performed 14 d after CCI ligation (4 d after the development of stable allodynia). Behavioral testing in these rats continued for 60 d after CCI ligation.
To measure high-threshold pinch sensitivity, a modified Randall–Selitto test was used (Luis-Delgado et al., 2006). A laboratory-fabricated measurement device consisted of a pair of large blunt forceps (15 cm long; flat contact area; 7 × 1.5 mm with smooth edges) equipped with four strain-gauge transducers, wired in a full Wheatstone bridge, which were connected to a calibrated strain meter (model DP25-S; Omega Engineering). Calibration of the instrument was performed with known weights and yielded a linear output ranging from 0.0 to 1500 g.
The tested rat was placed on a table and loosely restrained with a towel masking the eyes to limit environmental influences. The tips of the forceps were placed on the dorsal and ventral surfaces of the hindpaw, and care was taken to apply the same tip length for each trial. The applied force was incremented by hand at a speed of ∼200 × g every 3 s until the paw withdrawal. The analog output of the strain meter was visualized on a software storage oscilloscope (MathWorks), allowing the experimenter to monitor the slope of mechanical force application over time during each test. The oscilloscope stored values for all forces applied and permitted visual detection of spikes in force attributable to the withdrawal, allowing for maximum thresholds to be determined with low variability. Measurement was repeated three times for each hindpaw during each testing session, and the mean force exerted for each paw was reported.
Histology.
After electrophysiological lesion verification, perfused brains were harvested and frozen (−80°C). Sections, 30 μm, were collected throughout the lesion area and mounted on slides. Sections were fixed for 1 h in 4% paraformaldehyde at room temperature, washed (six times for 5 min in PBS), treated with 0.3% H2O0 solution, and then washed and treated with an Avidin/Biotin Blocking kit (Vector Laboratories). Tissue was washed and incubated with mouse anti-neuron-specific nuclear protein (NeuN) monoclonal antibody (1:5000; MAB377 MSxNeuN; Millipore Bioscience Research Reagents) at 4°C for 48 h in a buffer consisting of 1% bovine serum albumin, 0.25% carrageen lambda, and 5% Triton X-100 in PBS. After washes in PBS, tissue was incubated at room temperature for 2 h with biotinylated goat-anti mouse secondary antibody (1:200; Jackson Laboratories), washed, and incubated for 2 h with a standard Avidin/Biotin Complex (ABC) kit (Vectastain ABC kit; Vector Laboratories). After washes in PBS, NeuN was visualized with 3,3′-diaminobenzidine (DAB) and nickel chromogens. Sections were cleared and coverslipped, and the lesions were examined, blinded as to experimental results, under a bright-field microscope with neurons identified as cells with black nuclei.
Neuronal tracing.
Surgical preparation and injection sites were the same as per insular lesions but restricted to the right hemisphere. Injections of biotinylated dextran amine (BDA) (Vector Laboratories) were made through a glass capillary by using alternating positive current of 5 μA at 7 s on, 7 s off for 10 min at 300 and 600 μm depths for a total of 20 min per burr hole in eight rats. Rats were allowed to recover and survive for 1–2 weeks, after which they were deeply anesthetized and transcardially perfused with 4% paraformaldehyde. Brains were removed and sunk overnight in 30% sucrose. Tissue was sliced at 40 μm and collected floating. Tissue was washed (six times for 5 min in PBS), treated with 0.3% H2O0 solution, washed, and treated with an Avidin/Biotin Blocking kit (Vector Laboratories). BDA was visualized with DAB chromogen. Sections were mounted on slides, dried overnight, counterstained in Hematoxylin QS (Vector Laboratories), dehydrated in ascending alcohols, cleared, and coverslipped. Slides were examined under dark-field microscope.
Analysis.
The loci of sensory responsive regions were determined by mapping the root mean squared (RMS) power of the SEP or AEP field potential, using bicubic spline interpolation of evoked potential amplitudes across the electrode array. This method has been demonstrated in previous work to have a spatial accuracy <80 μm (Rodgers et al., 2008). Areal locations were determined in relation to bregma on the rostrocaudal axis and the midline on the dorsoventral axis and reported as the mean (mm) ± SEM. MUA from laminar dorsal horn recordings was computed by superimposing all rectified single trials for a given condition (sciatic or CGIC stimulation), manually setting thresholds for each electrode to lie just above prestimulus baseline activity, and then computing the across trial sum of points falling above threshold within preset response windows (see Fig. 7A, dashed box). MUA magnitude was normalized to the maximum across electrodes and conditions for a given rat.
The effect of CGIC lesions on allodynia was analyzed using a two-way, repeated measures ANOVA, with the first factor consisting of lesion group (CGIC or sham lesion) and the second factor consisting of the time after CCI ligation. Post hoc comparisons were performed using t tests with the Bonferroni's correction setting thresholds for significance at p ≤ 0.0036 (0.05/14 comparisons) in Figures 3 and 4, and Tukey's multiple comparisons test in Figure 5. Normalized MUA amplitudes of dorsal horn responses were compared before and after muscimol inactivation of either CGIC or SI using t tests of selected laminar electrode groups (significance set at p ≤ 0.05).
Figure 3.

Lesions of CGIC before CCI ligation prevent long-term maintenance of allodynia. A, Baseline low-threshold mechanical sensitivity, as measured by von Frey test, is measured in the ipsilateral paw to the injury before CGIC bilateral lesion (day −14, arrowhead) and 14 d after CGIC or sham lesion (day 0) with no difference in sensitivity attributable to lesion observed. CCI ligation is performed on day 0 after the second baseline measurement (dashed line). Allodynia can be seen developing in both sham and CGIC lesion groups until day 14 after CCI ligation, at which time the allodynic responses of the CGIC lesion group significantly decrease compared with the sham group, where they remain for the duration of the study (90 d). B, Mirror allodynic responses in the contralateral paw to CCI ligation can be seen, and similar mitigation of long-term allodynia is observed. The light gray traces show the ipsilateral paw data.
Figure 4.

Lesions of CGIC after CCI ligation reverse allodynia. A, CCI ligation is induced at day 0 (dashed line) in all rats, after full development of allodynia, as measured in the ipsilateral paw to the injury by the von Frey test, rats had bilateral CGIC or sham lesions (day 14, arrowhead). One week later, CGIC lesion rats show mitigation of allodynia that continues for the duration of the study. The critical reversal period of ≈21 d attributable to CGIC lesion is shaded. B, Mirror allodynia in the contralateral paw to CCI ligation shows a very similar pattern of development and reversal of allodynia by CGIC lesion. The ipsilateral data are shown in light gray. The reversal period is shaded.
The group numbers are as follows: mapping Figure 1A–E, n = 4; CGIC lesion before CCI, n = 22, 11 lesion, 11 sham; CGIC lesion after CCI, n = 12, 6 lesion, 6 sham; high-threshold pinch mechanical sensitivity, Figure 5, A and B, n = 12, 6 lesion, 6 sham; anatomical tracing, n = 8, with confined injection sites; spinal electrophysiology, n = 8, 4 CGIC inhibition, 4 SI inhibition.
Figure 1.
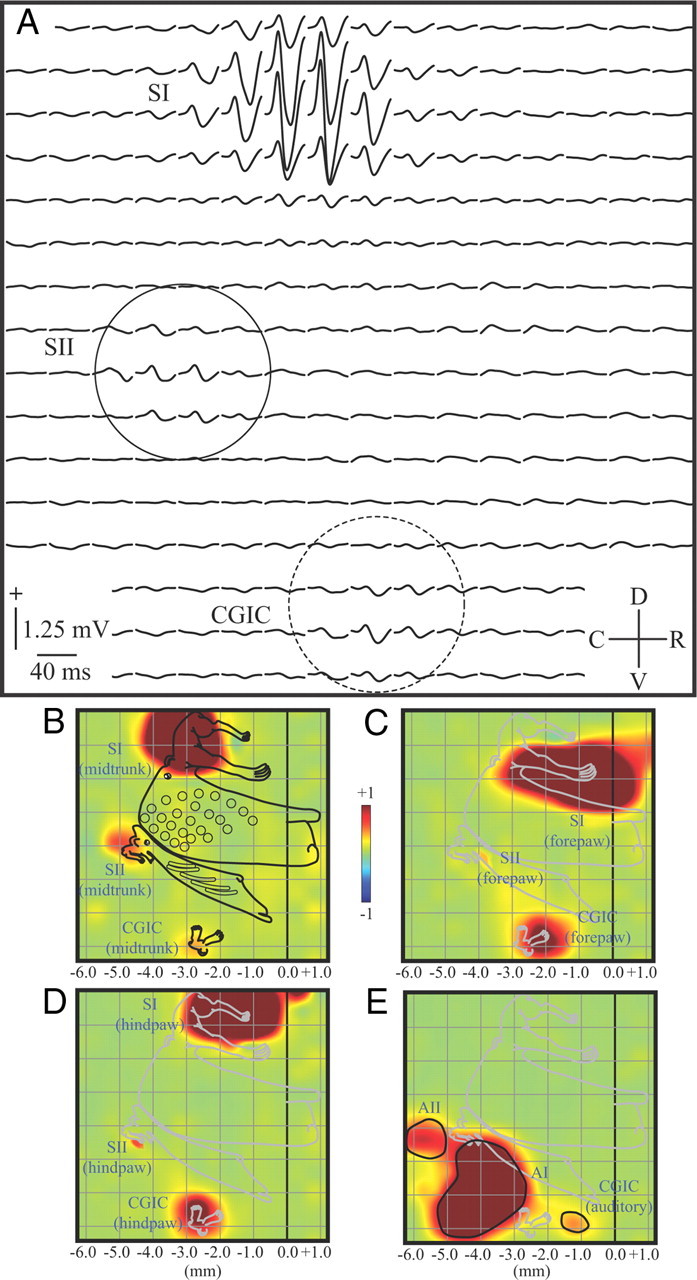
Areal delineation of primary, secondary, and caudal granular insular cortex. A, Epipial somatosensory potentials recorded from a 16 × 16 electrode array evoked by midtrunk electrical stimulation and averaged across six rats. SI, SII (solid circle), and the CGIC (dashed circle) responded, showing a typical biphasic positive/negative waveform. B, Normalized map of the RMS power of the midtrunk SEP from rats in A, with a superimposed ratunculus from a previous study and stereotaxic markings. The dark line at 0.0 represents bregma. Responses were largest in SI located most dorsally, with smaller responses in SII and the CGIC located most ventrally. C, D, Similar maps of the forepaw and hindpaw responses, respectively. D, Normalized map of the AEP from the same rats. Three loci of activation were recorded. The most caudal is AII, with AI just rostral to this locus. The CGIC auditory field is rostral to both AI and the CGIC somatosensory response. C, Caudal; D, dorsal; R, rostral; V, ventral.
Results
Areal delineation of primary, secondary, and insular sensory cortex
Figure 1A depicts SEPs (averaged across six rats) recorded from the right hemisphere in response to stimulation of the midtrunk. Responses were composed of a typical positive/negative waveform and were of largest amplitude at the most dorsal electrode sites in the region of primary somatosensory cortex (Fig. 1A, SI). Responses at two other more ventral regions were also apparent, reflecting activation of SII (Fig. 1A, solid circle) and CGIC (Fig. 1A, dashed circle). To better visualize the spatial distribution of responses in these regions, the RMS power of the SEPs were mapped (Fig. 1B). The largest responses in the array (at SI) were clipped at 50% maximum value, and the maps were then normalized so that smaller-amplitude responses in SII and CGIC were more apparent. A detailed ratunculus, that was derived from an earlier study of the complete body representations of SI, SII, and the CGIC (Benison et al., 2007), was scaled and superimposed on these maps for anatomical reference (complete body maps were not obtained in the present study).
In the present recordings, bregma (b) (Fig. 1B–E, 0.0 mm) and the midline (m) were positioned ∼1.2 mm caudal and 2.5 mm dorsal to the right and top borders of the electrode array, respectively. Based on these anatomical landmarks, the center of the midtrunk response in SI was located at (b, −3.15 ± 0.15; m, +3.42 ± 0.09 mm). The more caudal and ventral SII was located at (b, −4.79 ± 0.12; m, +6.33 ± 0.12 mm). The most ventral responses were in CGIC and located at (b, −2.77 ± 0.12; m, +9.13 ± 0.10 mm) (Fig. 1B). Forepaw representations (Fig. 1C) for SI, SII, and CGIC were (b, −1.01 ± 0.11; m, +4.51 ± 0.09 mm), (b, −3.94 ± 0.12; m, +6.80 ± 0.13 mm), and (b, −2.20 ± 0.11; m, +9.30 ± 0.08 mm), respectively. Similar responses to hindpaw stimulation (Fig. 1D) were (b, −1.55 ± 0.12; m, +3.12 ± 0.11 mm), (b, −4.51 ± 0.12; m, +6.91 ± 0.12 mm), and (b, −2.85 ± 0.10; m, +9.05 ± 0.11 mm), respectively. Thus, the somatotopic organization of SI, SII, and CGIC conformed closely with previous more detailed mapping studies (Benison et al., 2007; Rodgers et al., 2008). AEPs recorded in the same rats (Fig. 1E) also formed three distinct foci. The most caudal was AII (b, −5.76 ± 0.10; m, +6.59 ± 0.11 mm), with AI (b, −3.89 ± 0.11; m, +7.99 ± 0.09 mm) just rostral to this locus. The auditory field of CGIC (Rodgers et al., 2008) was positioned most rostrally at (b, −1.71 ± 0.08; m, +8.90 ± 0.11 mm). All coordinates are with respect to the flattened hemisphere beneath the array.
Anatomical and functional verification of excitotoxic CGIC lesions
An example of the most caudal lesion site is depicted in Figure 2A, centered 2.5 mm caudal to bregma. Enlargement of the lesion site (Fig. 2B) reveals a distinct loss of cells in an ∼0.5- to 1.5-mm-diameter region (wider near the cortical surface) (Fig. 2B, dashed traces) centered on the injection site and extending the entire thickness of gray matter. Cell death was restricted to the cortical mantle and did not cross the external capsule into the underlying striatum. NMDA lesions have been shown to leave fibers of passage intact (Winn, 1991). Functional verification indicated that the two lesions (Fig. 2C, dark blue circles) were sufficient to completely suppress the SEP in CGIC but leave responses in both SI and SII intact. AEPs were completely eliminated in CGIC and were also attenuated in the most rostral region of AI, suggesting an area of functional lesion closer to 2 mm in diameter (Fig. 2D, light blue circles). The functional lesion area completely covered CGIC but was sufficiently localized to leave responses in the vibrissa representation of SII, just dorsal to sensory insula, intact (Fig. 2E).
Figure 2.
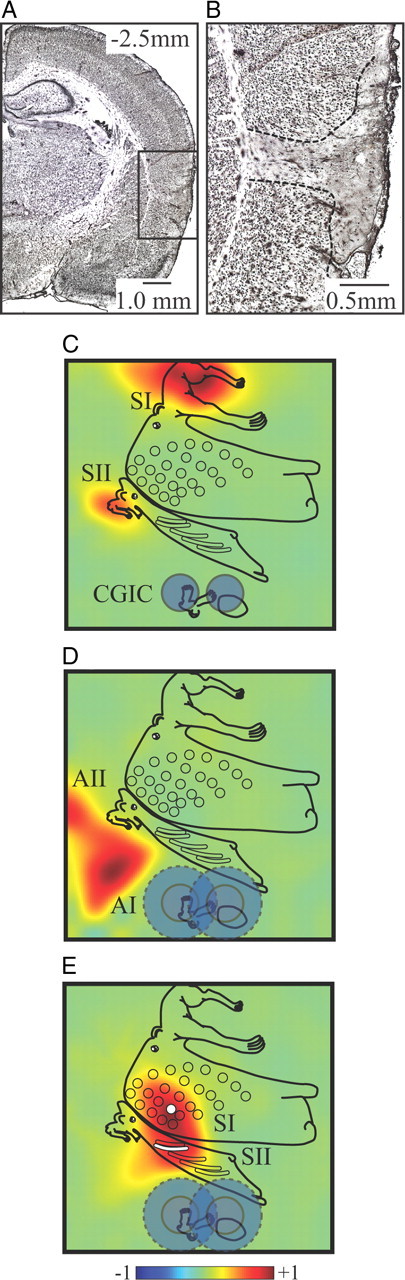
Anatomical and functional verification of excitotoxic CGIC lesions. A, Photomicrograph showing the extent of the excitotoxic lesions in an example at the most caudal site. Scale bar, 1.0 mm, NeuN stain. B, Enlargement of the lesion site shows cell death restricted to the cortical mantle and not crossing the external capsule into the underlying striatum. Scale bar, 0.5 mm. C, Functional verification of lesions (dark blue circles denote anatomical lesion extent) indicates complete suppression of the SEP in CGIC but leaves responses in both SI and SII unaltered. D, AEPs are completely eliminated in auditory CGIC and attenuated in the most rostral region of AI but are unaffected in AII, suggesting an area of functional lesion closer to 2 mm in diameter (light blue circles). E, Functional verification of SEPs evoked by stimulation of B2 whisker (the B2 representation in SI is indicated by white circle and in SII by a white bar) shows the intact whisker response in SII, just dorsal to the lesion site, demonstrating the confined distribution of the lesion.
The effect of CGIC lesions before and after CCI
Figure 3 displays von Frey thresholds for tests performed on hindpaws ipsilateral and contralateral to CCI ligation, in rats receiving CGIC or sham lesions before CCI ligation. We should emphasize again that “lesion” and “sham lesion” groups noted here and elsewhere refer only to surgical manipulation of CGIC; all rats in behavioral testing experiments received CCI ligation except rats depicted in Figure 5. When tested on the hindpaw ipsilateral to where CCI ligation was to be performed, withdrawal thresholds for the CGIC and sham lesion groups recorded before brain lesion (Fig. 3A, arrow, behavior recorded just before brain lesion on day −14) did not significantly differ (p = 0.59). These thresholds also did not significantly change (p = 0.74 and 0.45 for lesion and sham groups, respectively) 14 d after bilateral CGIC lesions (Fig. 3A, day 0, testing followed by CCI), indicating no effect of CGIC lesions on mechanical stimulus sensitivity. CGIC lesions also had no influence on the development of allodynia, which was robust by day 11 after CCI in both the CGIC and sham lesion groups. However, after this time point, a recovery from allodynia began in the CGIC lesioned rats, with thresholds returning to near baseline values at 26 d after CCI and remaining stable at this level for the remainder of the 90 d testing period. In contrast, sham brain-lesioned rats displayed no sign of recovery, with a stable plateau of decreased withdrawal threshold during the same period.
Withdrawal thresholds measured from the hindpaw contralateral to CCI ligation in sham brain-lesioned rats displayed a marked mirror image allodynia, as reported previously (Milligan et al., 2006a; Hutchinson et al., 2008). The time course and magnitude of threshold changes after CCI ligation for the contralateral hindpaw (Fig. 3B, white squares) were nearly identical to those measured from the ipsilateral hindpaw (Fig. 3B, light gray squares) and were highly correlated (r = 0.98) throughout the entire recording period. CGIC lesions also produced nearly identical recovery from allodynia in the contralateral hindpaw (Fig. 3B, white triangles) when compared with measurements from the ipsilateral hindpaw (Fig. 3B, light gray triangles) (r = 0.93). Two-way ANOVA showed a main effect of lesion and sham lesion group (p < 0.0001), time (p < 0.0001), and an interaction effect (p < 0.0001) in both ipsilateral and contralateral comparisons.
In rats in which CGIC or sham lesions were performed after CCI ligation (Fig. 4), the magnitude and time course for the development of allodynia was similar to rats receiving pre-CCI CGIC lesions (Fig. 3) (r = 0.99 and 0.98 for the ipsilateral and contralateral hindpaws, respectively), again reaching a maximum at day 11. When withdrawal thresholds were measured in the hindpaw ipsilateral to CCI ligation (Fig. 4A), CGIC lesions performed on day 14 after CCI (Fig. 4, arrows) produced a significant recovery from allodynia compared with sham lesioned rats. Nearly complete recovery was recorded by day 33 and remained stable for the 90 d testing period. The “reversal period” for recovery from allodynic behavior, after CGIC lesion, was observed to be ≈21 d (Fig. 4A,B, shaded regions). Again, CGIC lesions produced similar recovery from allodynia in the contralateral limb (Fig. 4B, white triangles) when compared with measurements from the ipsilateral limb (Fig. 4B, light gray triangles) (r = 0.99). The time course and magnitude of recovery from allodynia in rats receiving CGIC lesions after CCI (Fig. 4, days 11–84) was nearly identical to those receiving CGIC lesions before CCI (Fig. 3, days 11–90) for both the ipsilateral and contralateral limbs (r = 0.96 and 0.95, respectively). Two-way ANOVA showed a main effect of CGIC and sham lesion group (p < 0.0001), time (p < 0.0001), and an interaction effect (p < 0.0001) in both ipsilateral and contralateral comparisons.
Control experiments were run to further test whether baseline mechanical thresholds could be affected longitudinally by CGIC lesions alone in the absence of CCI and allodynia. To this end, a new series of rats without CCI were measured using von Frey tests under baseline conditions and after bilateral CGIC or sham brain lesion (n = 5 per group), covering the duration (≈21 d) of the previously established allodynia reversal period (Figs. 4A,B, 5A, shaded areas) and beyond. Thresholds were measured in both left (Fig. 5A, black symbols) and right (Fig. 5A, white symbols) paws for CGIC lesion (Fig. 5A, triangles) and sham lesion (Fig. 5A, squares). It should again be noted that this is the only experiment in which rats did not receive CCI surgery. Two-way ANOVA showed no effect of CGIC and sham lesion group (p > 0.05), time (p > 0.05), or an interaction effect (p > 0.05) in either left and right hindpaw comparisons.
After von Frey measurements were completed, follow-up high-threshold mechanical stimulation was performed with a modified Randall–Selitto method using calibrated forceps to assess whether CGIC lesions affected baseline mechanical nociceptive thresholds. Figure 5B shows the paw-pinch threshold for rats (n = 5 per group) 21 d after bilateral CGIC (Fig. 5B, black bars) and sham lesions (Fig. 5B, white bars). One-way ANOVA was performed, and a Tukey's multiple comparison post hoc analysis showed no significant difference in either paw between CGIC and sham lesion (p > 0.05). Rats were only tested for high-threshold mechanical sensitivity once, after the von Frey time course, to ensure that no confounds were introduced to the von Frey measurements. These results supported our previous observation from pre-CCI CGIC lesions (Fig. 3), suggesting that the effects of CGIC lesions are confined to allodynia and have no influence on normal mechanical nociceptive thresholds.
Efferent projections of CGIC
In light of our behavioral results showing a distinct role for the CGIC in long-term maintenance of allodynia, an additional group of rats received injections of the anterograde tracer BDA, to examine possible intracortical and subcortical efferent pathways by which this maintenance may be effected. Figure 6, A and B, depicts an example of intracortical projections of CGIC at the level of the rostral tracer injection. In all rats, CGIC injections in the right hemisphere (contralateral to CCI ligation in the previous group of rats) labeled the homologous contralateral CGIC (Fig. 6A). Labeling was also apparent in the ipsilateral body representations of SI (Fig. 6A, in this example, the SI hindlimb representation or SIHL), with lighter labeling in primary motor cortex (Fig. 6A, MI). However, projections were conspicuously absent in the SI vibrissa representation (Fig. 6A, PMBSF). Fibers were also labeled in the striatum (Fig. 6A, CPu), which extended ventrally with sparse terminations in the anterior basolateral amygdaloid nucleus (Fig. 6A, BLA). No labeling of the rostral agranular insular cortex (Fig. 6B, RAIC) was noted in any rats. However, sections at this rostral level revealed light projections to granular insula (Fig. 6B, GI) as well as denser projections to SI and less to primary motor cortex (Fig. 6B, MI). Labeling (data not shown) was also apparent in the posterior nucleus of the thalamus, the ventral posterior lateral nucleus of the thalamus, and the zona incerta.
Figure 6.

Anatomical projections of CGIC. A, Anterograde neuroanatomical tracing using BDA shows the rostral injection site in the CGIC (dark orange) and its efferent connections to the hindlimb representation in primary somatosensory cortex (SIHL), motor cortex (MI), contralateral CGIC, caudate–putamen (CPu), and basolateral amygdala (BLA). No connections were identified in the posteromedial barrel subfield (PMBSF) Scale bar, 2.0 mm. B, Dense corticocortical connections can be seen between CGIC, motor cortex, and SI. Some connections can be seen in the granular insula (GI), but the RAIC does not show efferent connections from CGIC. Scale bar, 1.5 mm. C, Counterstained section of brainstem showing the location of RVM in relation to the facial nuclei (VII) (py, pyramidal tract; ml, medial lemniscal tract). Black box denotes area of enlargement in D. Scale bar, 1.0 mm. D, Efferent connections from CGIC can be seen exiting the pyramidal tract and innervating both the ipsilateral and contralateral RVM (white dashed outline). Scale bar, 0.5 mm.
In the brainstem, labeled fibers descended ipsilaterally in the pyramidal and medial lemniscal tracts (Fig. 6C, py, ml) to course into both the ipsilateral and contralateral regions of the rostral ventromedial medulla (Fig. 6C,D, RVM). Farther caudally, the contralateral nucleus of the solitary tract (data not shown) was also innervated by decussating fibers from the ipsilateral pyramidal tract. No projections from CGIC to the periaqueductal gray matter were noted. Finally, one direct spinal projection via the corticospinal tract (CST) was discovered. After decussation, termination was seen in the medial aspect of the internal basilar nucleus (IBN) in the cervical spinal cord, but no descending fibers or termination in the spinal gray matter was seen at more caudal levels, even with 1–2 week survival times.
The effect of CGIC efferent projections on multiunit responses of the lumbar dorsal horn
Failure to observe any direct efferent projections from CGIC past the cervical spinal cord raised the question of whether its function was restricted to cortical processing or could also involve indirect descending spinal modulation via SI or other subcortical targets. To answer this question, we electrically stimulated CGIC in four additional rats while recording multiunit activity from the dorsal horn of the lumbar enlargement (Fig. 7E). CGIC stimulation consistently evoked bursts of MUA in layers 4–6 of the dorsal horn (Fig. 7A,E, dashed boxes). The spinal response began at a poststimulus latency of ∼25 ms (25.2 ± 2.1 ms) (Fig. 7A,B, blue traces). Cortically evoked spinal MUA was completely eliminated by muscimol block of CGIC (Fig. 7B, red traces), indicating a focal effect of stimulation and no current spread to adjacent cortex. Confinement of muscimol suppression of SEP to target cortical structures was also verified with cortical mapping at the end of recording (data not shown).
Given that CGIC was activated by hindpaw stimulation (Fig. 1D) and could in turn activate cells in layers 4–6 of the dorsal horn (Fig. 7A), we further evaluated what influence, if any, muscimol block of CGIC had on the spinal response to electrical stimulation of the sciatic nerve. Sciatic stimulation consistently evoked two bursts of MUA in the dorsal horn that were spatially and temporally distinct (Fig. 7C,D, blue traces). The first MUA burst occurred at the shortest poststimulus latency (overlapping the stimulus artifact) and was of largest amplitude at dorsal recording sites (<500 μm) (Fig. 7Ca). In all rats, this early burst was followed at ∼43 ms poststimulus latency (43.1 ± 1.4 ms) by a second MUA burst of largest amplitude in layers 4–6 (>500 μm) (Fig. 7Cb, dashed box). The long-latency ventral response had a spatial distribution that resembled electrically evoked CGIC responses (Fig. 7A, dashed box). Indeed, the late component of the sciatic evoked response was attenuated by inactivation of CGIC (Fig. 7D, red traces). CGIC block only attenuated the late response in the ventral layers (Fig. 7F, 500–1000 μm; p = 0.012), leaving activity in the dorsal layers unaffected (Fig. 7F, 0–400 μm; p = 0.82). Although CGIC block had no effect on early sciatic evoked responses in dorsal layers (p = 0.32), in most rats it appeared to attenuate short-latency responses in the ventral layers (Fig. 7D, arrow), but this did not reach significance (p = 0.08).
Because we discovered no direct projections from CGIC to the lumbar dorsal horn, we examined a second set of rats (n = 4) to determine whether at least one indirect pathway for CGIC-evoked spinal responses could relay via SI, a main intracortical target of CGIC efferent fibers (Fig. 6A,B). Figure 8, A and C (blue traces), again shows lumbar MUA evoked by CGIC and sciatic nerve stimulation, respectively, before muscimol inactivation of SI. SI block resulted in nearly complete attenuation of the CGIC-evoked dorsal horn response (Fig. 8B, red traces) in layers 4–6 of all rats (Fig. 8F, CGIC; p = 0.0008). Although attenuation was also observed in more dorsal layers of some rats, this did not reach significance (p = 0.12). Similarly, the long-latency ventral response to sciatic nerve stimulation was attenuated by SI block (Fig. 8D, red traces) in the ventral layers of all rats (Fig. 8F, Sciatic; p = 0.0002) but not in the dorsal layers (p = 0.31). The possibility that SI may serve as an excitatory corticospinal relay for CGIC efferent output was further supported by observation that direct stimulation of SI evoked dorsal horn responses (Fig. 8E, blue traces) that were similar in spatial distribution to those resulting from CGIC stimulation and eliminated by SI block (Fig. 8E, red traces). However, poststimulus latencies of responses to SI stimulation were shorter (19.2 ± 2.2 ms; p = 0.006) than CGIC responses by ∼6 ms.
Figure 8.

SI inactivation abolishes CGIC evoked spinal MUA. A, Electrical stimulation of CGIC evokes MUA in contralateral lumbar dorsal horn (dashed box, similar to Fig. 7A). B, Inactivation of SI abolishes CIGIC evoked MUA [pre-SI inactivation (data from A) is shown in blue and post-SI inactivation in red]. C, Stimulation of the sciatic nerve evokes MUA in the ipsilateral dorsal horn (dashed box, similar to Fig. 7C). D, Inactivation of SI eliminates the late component of sciatic evoked spinal MUA (blue, pre-inactivation; red, post-inactivation). E, Direct electrical stimulation of SI evokes late MUA in the spinal cord (blue traces); after inactivation of SI, spinal SI evoked MUA is eliminated (red traces). F, Quantification of spinal MUA from layers 4–6 from intact rats (blue bars) and SI inhibited rats (red bars), during CGIC stimulation or sciatic stimulation. As in Figure 7, MUA magnitude is normalized to the maximum across electrodes and conditions for a given rat and therefore can range from 0.0 and 1.0. *p ≤ 0.05.
Discussion
The present results indicate that CGIC lesions before or after CCI produce long-term alleviation of allodynia without affecting normal mechanical thresholds to low- or high-threshold stimuli. CGIC displays both intracortical and subcortical efferent projections that may support its influence on allodynia. Electrical stimulation and inactivation of CGIC and SI indicate that both can evoke MUA in layers 4–6 of the lumbar dorsal horn that contributes to late temporal components of the sciatic nerve response.
Our data suggest two distinct phases of allodynia, the first independent of, and the second dependent on, CGIC. Although CGIC lesions performed 2 weeks before CCI are complete by the time of sciatic nerve injury (Vogt et al., 2008), subsequent development of allodynia is indistinguishable from sham-lesion controls until 14 d after CCI. These results support the hypothesis that mechanisms initiating neuropathic pain differ from mechanisms for its maintenance (Burgess et al., 2002). Initiation is thought to be attributable to increased afferent drive (Devor, 1991) and central sensitization of spinal circuitry (Gracely et al., 1992; Coderre et al., 1993; Cervero and Laird, 1996; Campbell and Meyer, 2006; Saadé and Jabbur, 2008; Sandkühler, 2009), whereas maintenance may require supraspinal facilitation (Porreca et al., 2002; Campbell and Meyer, 2006; Saadé and Jabbur, 2008).
In addition to the insula, other supraspinal sites, such as the anterior cingulate (ACC), the prefrontal cortex (PFC), and the amygdala, have been investigated for supraspinal involvement and may play a role in the emotive aspects of pain and possible modulation of chronic pain, but their relation to the two distinct phases of allodynia shown in this study have not been investigated. Although lesion studies of the ACC show an effect on acute inflammatory pain, they do not affect allodynia (Donahue et al., 2001). However, recent evidence shows that inhibition of protein kinase Mζ in the ACC can lead to reduction in allodynic behavior, yet unlike our CGIC lesions, this reduction is transient, lasting between 2 and 24 h (Li et al., 2010). Other recent evidence also implicates the PFC and amygdala in allodynic behavior (de Novellis et al., 2011), but this is again only a relatively small and transient effect. These structures may be highly associated with the emotional, decision-making, and fear, making their direct contribution to allodynia difficult to determine.
When looking at the biphasic nature of allodynia, the initial source of supraspinal facilitation may be the brainstem, because destruction of cells within the rostral ventromedial medulla or its major descending output pathway, the dorsolateral funiculus, result in a decline in neuropathic symptoms much earlier (5 d after injury) than that produced by CGIC lesions (Burgess et al., 2002). However, it seems unlikely that rostral ventromedial medulla facilitation is responsible for prolonged allodynia measured here, because section of the dorsolateral funiculus, anterolateral columns, and spinal hemisection (Saadé et al., 2006), as well as bilateral section of the dorsal columns (Saadé et al., 2002), results in significant but temporary (1–3 weeks) decreases of allodynia.
Notably, the only spinal pathway consistently spared in the previous studies of transient supraspinal facilitation was the CST. Our anatomical results suggest two paths by which the CGIC could access the CST. The first is via direct projections within the CST to the cervical division of the IBN (Torvik, 1956). However, the functional significance of the IBN has not been well characterized (Kemplay and Webster, 1986; Huang, 1989; Kobayashi, 1998) and no CGIC projections were found in the lumbar spinal cord. A second pathway for CGIC modulation of allodynia via the CST is through its dense intracortical projections to sensorimotor cortex, the principle origin of the CST (Miller, 1987). The CST is one of the most effective descending modulators of the spinal cord. Supporting the importance of this pathway are the results of Balaki et al. (2003), indicating that ablation of the sensorimotor cortex in the rat is the only other chronic cortical manipulation, outside of the discrete CGIC lesions shown here, which results in long-term attenuation of allodynic manifestations.
The effects of CGIC and SI stimulation/inactivation on lumbar dorsal horn MUA provide additional functional support for potential descending cortical modulation of spinal excitability. Stimulation of either CGIC or SI results in excitation of layers 4–6 of the lumbar dorsal horn. The facts that (1) CGIC possesses no direct lumbar corticospinal pathway, (2) CGIC has dominant efferent output to SI, (3) CGIC-evoked responses are ∼6 ms later than those evoked from SI, and (4) inactivation of SI completely eliminates spinal responses attributable to CGIC stimulation, suggest that spinal modulation from CGIC relays through SI and subsequently through the CST. When cortical stimulation is replaced by sciatic stimulation, both CGIC and SI continue to have a distinct influence on the late temporal component of the dorsal horn response. Inactivation of either CGIC or SI eliminates the late response in layers 4–6 but leaves early responses intact. Our evidence suggests that the late response is cortically driven and does not represent long-latency C-fiber responses attributable to afferent input. This conclusion is based on its relatively short poststimulus latency [43 ms compared with latencies in the range of 100–300 ms for C-fiber responses (You et al., 2009)] and maximum amplitude in layers 4–6 [compared with typical localization in superficial layers for C-fiber responses (Stanfa and Dickenson, 2004)]. Additionally, we used minimum stimulus currents capable of producing reliable sciatic evoked responses in CGIC (∼0.4–0.6 mA), which were below those typically used to activate C-fibers (1–4 mA) (You et al., 2008, 2009; Rojas-Piloni et al., 2010).
We propose instead that the long-latency sciatic response reflects a “spinal–CGIC–SI–spinal” positive feedback loop that may contribute to maintenance of allodynia. Although all spinal electrophysiology here was conducted in non-neuropathic rats (electrophysiological differences in neuropathic rats may be masked by anesthesia), the relative poststimulus latencies we observed support the existence of this loop. The response latency for SI stimulation was 19 ms, which, at typical conduction velocities of 5 mm/ms (McComas and Wilson, 1968), would cover the ∼100 mm distance between SI and lumbar spine. The round trip path to and from cortex would require 38 ms, which is 5 ms shorter than the actual sciatic evoked response of 43 ms. However, given that CGIC response latencies were 25 ms (6 ms longer than SI responses) presumably attributable to intracortical delay between CGIC and SI, the proposed loop and theoretical latency calculation comes within 1 ms of the latency recorded for actual sciatic responses. It is telling that, although SI responds vigorously to sciatic stimulation and can in turn evoke MUA in the lumbar spine when electrically stimulated, its influence on the long-latency lumbar response to sciatic stimulation is entirely dependent on an intact CGIC. In this light, CGIC may be seen as not just a sufficient, but a necessary, input to SI for descending spinal activation.
Hodological, cytoarchitectural, and functional characteristics of the CGIC clearly distinguish it from RAIC, which has received attention for its role in nociceptive processing. Pharmacological manipulations of RAIC produce marked anti-nociceptive effects on acute pain (Burkey et al., 1996, 1999; Jasmin et al., 2003). However, although SEPs are easily recorded in CGIC, we have not successfully recorded SEPs from RAIC, even with strong electrical stimulation of the skin (1.0–2.0 mA) (Rodgers et al., 2008, their Fig. 1). Thus, at least in anesthetized rats, somatosensory responsiveness of the insula is dominated by CGIC. Additionally, CGIC lies ∼4 mm caudal to RAIC, in granular cortex, and our anterograde tracing reveals little to no rostral efferent projections to agranular insular cortex. Finally, although the RAIC has been shown to modulate acute pain, there is less evidence for an influence on neuropathic pain (but see Coffeen et al., 2011). In contrast, our data indicate that CGIC lesions have profound effects on allodynia with no influence on normal mechanical withdrawal thresholds in uninjured rats.
CGIC may therefore represent a distinct and essential center for the forebrain maintenance of mechanical allodynia attributable to mononeuropathy. Whether CGIC also plays a more general role in the maintenance of other neuropathic pain manifestations, such as CCI-induced spontaneous pain (Nakazato-Imasato and Kurebayashi, 2009) and/or inflammatory allodynia and thermal hyperalgesia, remains to be determined, particularly because the latter may rely on distinct spinothalamic pathways (Miki, 1998) (but see Saadé et al., 2006).
Although the presumed facilitation of allodynia by the intact CGIC demonstrated here may be maladaptive when there is damage to peripheral nerves, these results also shed light on possible functions of insular cortex in the intact nociceptive system. Indeed, recent evidence in humans suggests that a functionally and anatomically distinct region of insula, in non-neuropathic subjects, responds to the magnitude of painful stimuli as well as multisensory stimuli (Baliki et al., 2009). However, in a pathological condition, the long-term organization of nocifensive responses places distinct sensory-discriminative demands on cortical nociceptive processing. The source and location of pain must be accurately identified and the success of protective strategies evaluated through changes in pain intensity. Our evidence that the CGIC is somatotopically organized (Benison et al., 2007; Rodgers et al., 2008) indicates an ascending conservation of function that preserves the capacity for somatic localization. Facilitation of allodynia by the CGIC would be highly adaptive, increasing the gain of sensory drive from the injured region to promote affective and sensory processing.
In response to peripheral or central damage to the nociceptive system, the CGIC may function pathologically with persistent maintenance of mechanical allodynia. Additional understanding of interactions between body representations within the CGIC may provide insights into forebrain mechanisms for the typical ipsilateral spread of allodynic responses to dermatomes adjacent to the injured nerve (secondary allodynia). However, homologous callosal projections to contralateral CGIC also introduce the intriguing possibility of a cortical contribution to mirror image allodynia. This mysterious phenomenon is produced by CCI in rats and clinical pain syndromes (Milligan et al., 2006a; Hutchinson et al., 2008). Finally, the present findings may have clinical implications. A somatotopically organized region of the human posterior insula has been discovered recently that may be analogous to the CGIC described here (Mazzola et al., 2009), suggesting that the CGIC could eventually present a therapeutic target for the long-term relief of mechanical allodynia.
Footnotes
The authors declare no competing financial interests.
This work was supported by National Institutes of Health Grants NS36981 (D.S.B.) and DA024044 and DA01767 (L.R.W.) and the Craig Hospital Gift Fund (D.S.B.).
References
- Alvarez P, Dieb W, Hafidi A, Voisin DL, Dallel R. Insular cortex representation of dynamic mechanical allodynia in trigeminal neuropathic rats. Neurobiol Dis. 2009;33:89–95. doi: 10.1016/j.nbd.2008.09.003. [DOI] [PubMed] [Google Scholar]
- Apkarian AV, Baliki MN, Geha PY. Towards a theory of chronic pain. Prog Neurobiol. 2009;87:81–97. doi: 10.1016/j.pneurobio.2008.09.018. [DOI] [PMC free article] [PubMed] [Google Scholar]
- Baliki M, Al-Amin HA, Atweh SF, Jaber M, Hawwa N, Jabbur SJ, Apkarian AV, Saadé NE. Attenuation of neuropathic manifestations by local block of the activities of the ventrolateral orbito-frontal area in the rat. Neuroscience. 2003;120:1093–1104. doi: 10.1016/s0306-4522(03)00408-1. [DOI] [PubMed] [Google Scholar]
- Baliki MN, Geha PY, Apkarian AV. Parsing pain perception between nociceptive representation and magnitude estimation. J Neurophysiol. 2009;101:875–887. doi: 10.1152/jn.91100.2008. [DOI] [PMC free article] [PubMed] [Google Scholar]
- Becerra L, Morris S, Bazes S, Gostic R, Sherman S, Gostic J, Pendse G, Moulton E, Scrivani S, Keith D, Chizh B, Borsook D. Trigeminal neuropathic pain alters responses in CNS circuits to mechanical (brush) and thermal (cold and heat) stimuli. J Neurosci. 2006;26:10646–10657. doi: 10.1523/JNEUROSCI.2305-06.2006. [DOI] [PMC free article] [PubMed] [Google Scholar]
- Benison AM, Rector DM, Barth DS. Hemispheric mapping of secondary somatosensory cortex in the rat. J Neurophysiol. 2007;97:200–207. doi: 10.1152/jn.00673.2006. [DOI] [PubMed] [Google Scholar]
- Bennett GJ, Xie YK. A peripheral mononeuropathy in rat that produces disorders of pain sensation like those seen in man. Pain. 1988;33:87–107. doi: 10.1016/0304-3959(88)90209-6. [DOI] [PubMed] [Google Scholar]
- Burgess SE, Gardell LR, Ossipov MH, Malan TP, Jr, Vanderah TW, Lai J, Porreca F. Time-dependent descending facilitation from the rostral ventromedial medulla maintains, but does not initiate, neuropathic pain. J Neurosci. 2002;22:5129–5136. doi: 10.1523/JNEUROSCI.22-12-05129.2002. [DOI] [PMC free article] [PubMed] [Google Scholar]
- Burkey AR, Carstens E, Wenniger JJ, Tang J, Jasmin L. An opioidergic cortical antinociception triggering site in the agranular insular cortex of the rat that contributes to morphine antinociception. J Neurosci. 1996;16:6612–6623. doi: 10.1523/JNEUROSCI.16-20-06612.1996. [DOI] [PMC free article] [PubMed] [Google Scholar]
- Burkey AR, Carstens E, Jasmin L. Dopamine reuptake inhibition in the rostral agranular insular cortex produces antinociception. J Neurosci. 1999;19:4169–4179. doi: 10.1523/JNEUROSCI.19-10-04169.1999. [DOI] [PMC free article] [PubMed] [Google Scholar]
- Campbell JN, Meyer RA. Mechanisms of neuropathic pain. Neuron. 2006;52:77–92. doi: 10.1016/j.neuron.2006.09.021. [DOI] [PMC free article] [PubMed] [Google Scholar]
- Cervero F, Laird JM. Mechanisms of touch-evoked pain (allodynia): a new model. Pain. 1996;68:13–23. doi: 10.1016/S0304-3959(96)03165-X. [DOI] [PubMed] [Google Scholar]
- Chacur M, Milligan ED, Gazda LS, Armstrong C, Wang H, Tracey KJ, Maier SF, Watkins LR. A new model of sciatic inflammatory neuritis (SIN): induction of unilateral and bilateral mechanical allodynia following acute unilateral peri-sciatic immune activation in rats. Pain. 2001;94:231–244. doi: 10.1016/S0304-3959(01)00354-2. [DOI] [PubMed] [Google Scholar]
- Chaplan SR, Bach FW, Pogrel JW, Chung JM, Yaksh TL. Quantitative assessment of tactile allodynia in the rat paw. J Neurosci Methods. 1994;53:55–63. doi: 10.1016/0165-0270(94)90144-9. [DOI] [PubMed] [Google Scholar]
- Coderre TJ, Katz J, Vaccarino AL, Melzack R. Contribution of central neuroplasticity to pathological pain: review of clinical and experimental evidence. Pain. 1993;52:259–285. doi: 10.1016/0304-3959(93)90161-H. [DOI] [PubMed] [Google Scholar]
- Coffeen U, Manuel Ortega-Legaspi J, López-Muñoz FJ, Simón-Arceo K, Jaimes O, Pellicer F. Insular cortex lesion diminishes neuropathic and inflammatory pain-like behaviours. Eur J Pain. 2011;15:132–138. doi: 10.1016/j.ejpain.2010.06.007. [DOI] [PubMed] [Google Scholar]
- de Novellis V, Vita D, Gatta L, Luongo L, Bellini G, De Chiaro M, Marabese I, Siniscalco D, Boccella S, Piscitelli F, Di Marzo V, Palazzo E, Rossi F, Maione S. The blockade of the transient receptor potential vanilloid type 1 and fatty acid amide hydrolase decreases symptoms and central sequelae in the medial prefrontal cortex of neuropathic rats. Mol Pain. 2011;7:7. doi: 10.1186/1744-8069-7-7. [DOI] [PMC free article] [PubMed] [Google Scholar]
- Devor M. Neuropathic pain and injured nerve: peripheral mechanisms. Br Med Bull. 1991;47:619–630. doi: 10.1093/oxfordjournals.bmb.a072496. [DOI] [PubMed] [Google Scholar]
- Donahue RR, LaGraize SC, Fuchs PN. Electrolytic lesion of the anterior cingulate cortex decreases inflammatory, but not neuropathic nociceptive behavior in rats. Brain Res. 2001;897:131–138. doi: 10.1016/s0006-8993(01)02103-5. [DOI] [PubMed] [Google Scholar]
- Fields HL, Basbaum AI. Central nervous system mechanisms of pain modulation. In: Wall PD, Melzack R, editors. Textbook of pain. Ed 4. New York: Churchill Livingstone; 1999. pp. 309–329. [Google Scholar]
- Gracely RH, Lynch SA, Bennett GJ. Painful neuropathy: altered central processing maintained dynamically by peripheral input. Pain. 1992;51:175–194. doi: 10.1016/0304-3959(92)90259-E. [DOI] [PubMed] [Google Scholar]
- Harvey LOJ. Efficient estimation of sensory thresholds. Behav Res Methods Istrum Comput. 1986;18:623–632. [Google Scholar]
- Huang LY. Origin of thalamically projecting somatosensory relay neurons in the immature rat. Brain Res. 1989;495:108–114. doi: 10.1016/0006-8993(89)91223-7. [DOI] [PubMed] [Google Scholar]
- Hutchinson MR, Zhang Y, Brown K, Coats BD, Shridhar M, Sholar PW, Patel SJ, Crysdale NY, Harrison JA, Maier SF, Rice KC, Watkins LR. Non-stereoselective reversal of neuropathic pain by naloxone and naltrexone: involvement of toll-like receptor 4 (TLR4) Eur J Neurosci. 2008;28:20–29. doi: 10.1111/j.1460-9568.2008.06321.x. [DOI] [PMC free article] [PubMed] [Google Scholar]
- Jasmin L, Rabkin SD, Granato A, Boudah A, Ohara PT. Analgesia and hyperalgesia from GABA-mediated modulation of the cerebral cortex. Nature. 2003;424:316–320. doi: 10.1038/nature01808. [DOI] [PubMed] [Google Scholar]
- Kemplay SK, Webster KE. A qualitative and quantitative analysis of the distributions of cells in the spinal cord and spinomedullary junction projecting to the thalamus of the rat. Neuroscience. 1986;17:769–789. doi: 10.1016/0306-4522(86)90044-8. [DOI] [PubMed] [Google Scholar]
- Kobayashi Y. Distribution and morphology of spinothalamic tract neurons in the rat. Anat Embryol (Berl) 1998;197:51–67. doi: 10.1007/s004290050119. [DOI] [PubMed] [Google Scholar]
- Lei LG, Zhang YQ, Zhao ZQ. Pain-related aversion and Fos expression in the central nervous system in rats. Neuroreport. 2004;15:67–71. doi: 10.1097/00001756-200401190-00014. [DOI] [PubMed] [Google Scholar]
- Li XY, Ko HG, Chen T, Descalzi G, Koga K, Wang H, Kim SS, Shang Y, Kwak C, Park SW, Shim J, Lee K, Collingridge GL, Kaang BK, Zhuo M. Alleviating neuropathic pain hypersensitivity by inhibiting PKMzeta in the anterior cingulate cortex. Science. 2010;330:1400–1404. doi: 10.1126/science.1191792. [DOI] [PubMed] [Google Scholar]
- Luis-Delgado OE, Barrot M, Rodeau JL, Schott G, Benbouzid M, Poisbeau P, Freund-Mercier MJ, Lasbennes F. Calibrated forceps: a sensitive and reliable tool for pain and analgesia studies. J Pain. 2006;7:32–39. doi: 10.1016/j.jpain.2005.07.011. [DOI] [PubMed] [Google Scholar]
- Mazzola L, Isnard J, Peyron R, Guénot M, Mauguière F. Somatotopic organization of pain responses to direct electrical stimulation of the human insular cortex. Pain. 2009;146:99–104. doi: 10.1016/j.pain.2009.07.014. [DOI] [PubMed] [Google Scholar]
- McComas AJ, Wilson P. An investigation of pyramidal tract cells in the somatosensory cortex of the rat. J Physiol. 1968;194:271–288. doi: 10.1113/jphysiol.1968.sp008407. [DOI] [PMC free article] [PubMed] [Google Scholar]
- Miki K, Iwata K, Tsuboi Y, Sumino R, Fukuoka T, Tachibana T, Tokunaga R, Noguchi K. Responses of dorsal column nuclei neurons in rats with experimental mononeuropathy. Pain. 1998;76:407–415. doi: 10.1016/S0304-3959(98)00073-6. [DOI] [PubMed] [Google Scholar]
- Miller MW. The origin of corticospinal projection neurons in rat. Exp Brain Res. 1987;67:339–351. doi: 10.1007/BF00248554. [DOI] [PubMed] [Google Scholar]
- Milligan ED, Mehmert KK, Hinde JL, Harvey LO, Martin D, Tracey KJ, Maier SF, Watkins LR. Thermal hyperalgesia and mechanical allodynia produced by intrathecal administration of the human immunodeficiency virus-1 (HIV-1) envelope glycoprotein, gp120. Brain Res. 2000;861:105–116. doi: 10.1016/s0006-8993(00)02050-3. [DOI] [PubMed] [Google Scholar]
- Milligan ED, O'Connor KA, Nguyen KT, Armstrong CB, Twining C, Gaykema RP, Holguin A, Martin D, Maier SF, Watkins LR. Intrathecal HIV-1 envelope glycoprotein gp120 induces enhanced pain states mediated by spinal cord proinflammatory cytokines. J Neurosci. 2001;21:2808–2819. doi: 10.1523/JNEUROSCI.21-08-02808.2001. [DOI] [PMC free article] [PubMed] [Google Scholar]
- Milligan ED, Soderquist RG, Malone SM, Mahoney JH, Hughes TS, Langer SJ, Sloane EM, Maier SF, Leinwand LA, Watkins LR, Mahoney MJ. Intrathecal polymer-based interleukin-10 gene delivery for neuropathic pain. Neuron Glia Biol. 2006a;2:293–308. doi: 10.1017/S1740925X07000488. [DOI] [PMC free article] [PubMed] [Google Scholar]
- Milligan ED, Sloane EM, Langer SJ, Hughes TS, Jekich BM, Frank MG, Mahoney JH, Levkoff LH, Maier SF, Cruz PE, Flotte TR, Johnson KW, Mahoney MM, Chavez RA, Leinwand LA, Watkins LR. Repeated intrathecal injections of plasmid DNA encoding interleukin-10 produce prolonged reversal of neuropathic pain. Pain. 2006b;126:294–308. doi: 10.1016/j.pain.2006.07.009. [DOI] [PubMed] [Google Scholar]
- Nakazato-Imasato E, Kurebayashi Y. Pharmacological characteristics of the hind paw weight bearing difference induced by chronic constriction injury of the sciatic nerve in rats. Life Sci. 2009;84:622–626. doi: 10.1016/j.lfs.2009.02.014. [DOI] [PubMed] [Google Scholar]
- Ostrowsky K, Magnin M, Ryvlin P, Isnard J, Guenot M, Mauguière F. Representation of pain and somatic sensation in the human insula: a study of responses to direct electrical cortical stimulation. Cereb Cortex. 2002;12:376–385. doi: 10.1093/cercor/12.4.376. [DOI] [PubMed] [Google Scholar]
- Peyron R, García-Larrea L, Grégoire MC, Convers P, Lavenne F, Veyre L, Froment JC, Mauguière F, Michel D, Laurent B. Allodynia after lateral-medullary (Wallenberg) infarct. A PET study. Brain. 1998;121:345–356. doi: 10.1093/brain/121.2.345. [DOI] [PubMed] [Google Scholar]
- Porreca F, Ossipov MH, Gebhart GF. Chronic pain and medullary descending facilitation. Trends Neurosci. 2002;25:319–325. doi: 10.1016/s0166-2236(02)02157-4. [DOI] [PubMed] [Google Scholar]
- Rodgers KM, Benison AM, Klein A, Barth DS. Auditory, somatosensory, and multisensory insular cortex in the rat. Cereb Cortex. 2008;18:2941–2951. doi: 10.1093/cercor/bhn054. [DOI] [PMC free article] [PubMed] [Google Scholar]
- Rojas-Piloni G, Martínez-Lorenzana G, Condés-Lara M, Rodríguez-Jiménez J. Direct sensorimotor corticospinal modulation of dorsal horn neuronal C-fiber responses in the rat. Brain Res. 2010;1351:104–114. doi: 10.1016/j.brainres.2010.06.010. [DOI] [PubMed] [Google Scholar]
- Saadé NE, Jabbur SJ. Nociceptive behavior in animal models for peripheral neuropathy: spinal and supraspinal mechanisms. Prog Neurobiol. 2008;86:22–47. doi: 10.1016/j.pneurobio.2008.06.002. [DOI] [PubMed] [Google Scholar]
- Saadé NE, Baliki M, El-Khoury C, Hawwa N, Atweh SF, Apkarian AV, Jabbur SJ. The role of the dorsal columns in neuropathic behavior: evidence for plasticity and non-specificity. Neuroscience. 2002;115:403–413. doi: 10.1016/s0306-4522(02)00417-7. [DOI] [PubMed] [Google Scholar]
- Saadé NE, Al Amin H, Abdel Baki S, Safieh-Garabedian B, Atweh SF, Jabbur SJ. Transient attenuation of neuropathic manifestations in rats following lesion or reversible block of the lateral thalamic somatosensory nuclei. Exp Neurol. 2006;197:157–166. doi: 10.1016/j.expneurol.2005.09.005. [DOI] [PubMed] [Google Scholar]
- Sandkühler J. Models and mechanisms of hyperalgesia and allodynia. Physiol Rev. 2009;89:707–758. doi: 10.1152/physrev.00025.2008. [DOI] [PubMed] [Google Scholar]
- Sloane E, Langer S, Jekich B, Mahoney J, Hughes T, Frank M, Seibert W, Huberty G, Coats B, Harrison J, Klinman D, Poole S, Maier S, Johnson K, Chavez R, Watkins LR, Leinwand L, Milligan E. Immunological priming potentiates non-viral anti-inflammatory gene therapy treatment of neuropathic pain. Gene Ther. 2009;16:1210–1222. doi: 10.1038/gt.2009.79. [DOI] [PMC free article] [PubMed] [Google Scholar]
- Stanfa LC, Dickenson AH. In vivo electrophysiology of dorsal-horn neurons. Methods Mol Med. 2004;99:139–153. doi: 10.1007/978-1-59259-770-3_12. [DOI] [PubMed] [Google Scholar]
- Torvik A. Afferent connections to the sensory trigeminal nuclei, the nucleus of the solitary tract and adjacent structures; an experimental study in the rat. J Comp Neurol. 1956;106:51–141. doi: 10.1002/cne.901060104. [DOI] [PubMed] [Google Scholar]
- Treutwein B, Strasburger H. Fitting the psychometric function. Percept Psychophys. 1999;61:87–106. doi: 10.3758/bf03211951. [DOI] [PubMed] [Google Scholar]
- Vogt C, Hailer NP, Ghadban C, Korf HW, Dehghani F. Successful inhibition of excitotoxic neuronal damage and microglial activation after delayed application of interleukin-1 receptor antagonist. J Neurosci Res. 2008;86:3314–3321. doi: 10.1002/jnr.21792. [DOI] [PubMed] [Google Scholar]
- Wei F, Wang GD, Kerchner GA, Kim SJ, Xu HM, Chen ZF, Zhuo M. Genetic enhancement of inflammatory pain by forebrain NR2B overexpression. Nat Neurosci. 2001;4:164–169. doi: 10.1038/83993. [DOI] [PubMed] [Google Scholar]
- Winn P. Excitotoxins as tools for producing brain lesions. In: Conn PM, editor. Methods in neuroscience. San Diego: Academic; 1991. pp. 16–27. [Google Scholar]
- Witting N, Kupers RC, Svensson P, Jensen TS. A PET activation study of brush-evoked allodynia in patients with nerve injury pain. Pain. 2006;120:145–154. doi: 10.1016/j.pain.2005.10.034. [DOI] [PubMed] [Google Scholar]
- You HJ, Colpaert FC, Arendt-Nielsen L. Long-lasting descending and transitory short-term spinal controls on deep spinal dorsal horn nociceptive-specific neurons in response to persistent nociception. Brain Res Bull. 2008;75:34–41. doi: 10.1016/j.brainresbull.2007.07.015. [DOI] [PubMed] [Google Scholar]
- You HJ, Lei J, Arendt-Nielsen L. Selective inhibitory effects of pregabalin on peripheral C but not A-delta fibers mediated nociception in intact and spinalized rats. Neuroscience. 2009;164:1845–1853. doi: 10.1016/j.neuroscience.2009.09.047. [DOI] [PubMed] [Google Scholar]