

Abstract
Nitrogen is one of the major growth-limiting nutrients for plants: The main source of nitrogen in most of the higher plants is nitrate taken up through roots. Nitrate can be reduced both in the chloroplasts (photosynthetic tissues) and in proplastes (nonphotosynthetic tissues) such as roots. Ferredoxin-nitrite reductase (NiR) catalyses the reduction of nitrite to ammonium in the second step of the nitrate- assimilation pathway. Homology model of Ferredoxin-nitrite reductase has been constructed using the X-ray structure (PDB code: 2akj) a s a template and MODELLER 9v5 software. The resulting model assessed by PROCHECK, PROSAII and RMSD that showed the final refined model is reliable: has 81% of amino acid sequence identity with template, 0.2Å as RMSD and has (-10.37) as Z-scores, the Ramachandran plot analysis showed that conformations for 99.5 % of amino acid residues are within the most favored regions. The model could prove useful in further functional characterization of this protein.
Abbreviations
PDB - Protein Data Bank, NMR - Nuclear Magnetic Resonance, NiR - Nitrite Reductase, RMSD - Root Mean Squared Deviation, Fd - ferredoxin.
Keywords: Arabidopsis thaliana, Homology modeling, Validation
Background
Nitrogen assimilation is a fundamental biological process that has marked effects on plant productivity with nitrogen deficiency leading to a decrease in plant growth. Nitrate (NO3) is the main source of nitrogen for higher plants [1]. It is converted to reduced nitrogen by the nitrate assimilation pathway. The initial pathway of nitrate assimilation involves two enzymes, nitrate reductase [EC 1.6.6.1] which catalyzes the reduction of nitrate to nitrite, and ferrdoxinnitrite reductase [EC 1.7.7.1] which catalyzes the reduction of nitrite to ammonium ions (Figure 1). Ammonium is then incorporated into amino acids by the glutamine synthetase and glutamate synthase (GOGAT) pathway. Ferredoxin-nitrite reductase (EC 1.7.7.1), commonly called nitrite reductase (NiR) catalyzes the six electron reduction of nitrite to ammonia, with reduced ferredoxin (Fd) serving as the electron donor. Nitrite reductase found in plants, algae, and cyanobacteria contains one siroheme and one [Fe4-S4] cluster, acting as separate one-electroncarriers. All ferredoxin-dependent nitrite reductases contain two prosthetic groups, a siroheme and an iron-sulfur cluster. In Nitrite and Sulfite reductases, the sirohemes are axially coordinated through a cysteine residue that also serves as one of the ligands for the iron-sulfur cluster [2]. Nitrite binds to the iron of the siroheme at the axial position opposite the iron- sulfur cluster [3] in cyanobacteria and chloroplasts of photosynthetic eukaryotes.The physiological electron-donor ferredoxin is reduced by light dependent reactions of the electron-transfer chain. In higher plants, ferredoxin- dependent nitrite reductase is presented both in the chloroplasts and in nonphotosynthetic tissues such as roots where ferredoxin is reduced by the NADPH pool produced via the reductive pentose phosphate cycle.
Figure 1.
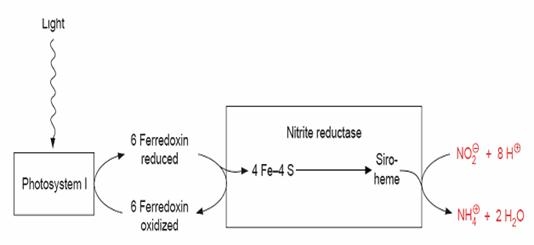
Nitrite reductase in chloroplasts transfers electrons from Ferredoxin to Nitrite.
The function of proteins is generally determined by its three-dimensional (3D) structure. Thus, it would be useful to know the 3D structure of the thousands of protein sequences that are emerging from many genome projects. Structural studies on bio-molecules have changed our perception of the biological world in the last twenty years. A number of efforts have been made on structure prediction .One such technique that has found a wide appreciation, is Homology modeling which aims at predicting the 3D structure of biomolecules, relying heavily on resources such as pattern/function and sequence. However, three- dimensional structure of Ferredoxin-nitrite reductase (EC 1.7.7.1) from Arabidopsis thaliana remains unknown. In the present study, effort was made to generate the three-dimensional (3D) structure of the Ferredoxin-nitrite reductase (EC 1.7.7.1) from Arabidopsis thaliana based on the available template (2akj) structural homologues from Protein Data Bank and the model validated with standard parameters (PROCHECK, PROSAII, RMSD). This study could prove useful in further functional characterization of this important group of enzymes.
Materials and Methodology
Sequence Alignment
The FASTA sequence of Ferredoxin-nitrite reductase (EC 1.7.7.1) from Arabidopsis thaliana was retrieved from the NCBI database (National Center for Biotechnology Information) that has 586 amino acids (AAD17406). Comparative modeling usually starts by searching the PDB of known protein structures using the target sequence as the query [4]. This search is generally done by comparing the target sequence with the sequence of each of the structures in the database. The target sequence was searched for similar sequence using the BLAST (Basic Local Alignment Search Tool) [5] against Protein Database (PDB). The BLAST results yielded X-ray structure of 2akj (Ferredoxin-nitrite reductase (EC 1.7.7.1)) from Spinach with 81% similarity to our target protein.
Comparative Modeling
The theoretical structure (Figure 2) of Ferredoxin-nitrite reductase (EC 1.7.7.1) from Arabidopsis thaliana is generated using MODELLER-9v5 by comparative modeling of protein structure prediction. MODELLER implements comparative protein structure modeling by satisfaction of spatial restraints. The program was designed to use as many different types of information about the target sequence as possible [6].
Figure 2.
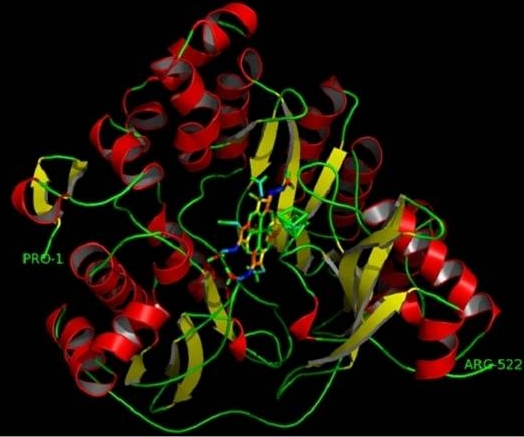
The final 3D structure of Ferredoxin-nitrite reductase model from Arabidopsis thaliana. The α-helices and β –sheets are represented by red helices and yellow ribbons respectively. This model was conducted by MODELLER program
Validation of Ferredoxin-nitrite reductase Model
PROCHECK
A versatile protein structure analysis program [7] available at the Joint Centre for Structural Genomics, Bioinformatics core, University of California, San Diego; was used in validation of protein structure and models by verifying the parameters like Ramachandran plot quality, peptide bond planarity, Bad nonbonded interactions, main chain hydrogen bond energy, Calpha chirality and over-all G factor and the side chain parameters like standard deviations of chi1 gauche minus, trans and plus, pooled standard deviations of chi1 with respect to refined structures [8].
PROSAII
This program compares Z scores between target and template structure. The Z scores of model is a measure of compatibility between its sequence and structure. The model Z score should be comparable to the Z scores obtained from the template [9].
RMSD
Root Mean Squared Deviation (RMSD) is commonly used to represent the distance between two objects. In a structural sense, this value indicates the degree to which two three dimensional structures are similar. The lower the value, the more similar the structures are. The RMSD value [10] between the template 2akj and our model structure was calculated using PYMOL program (Figure 3).
Figure 3.
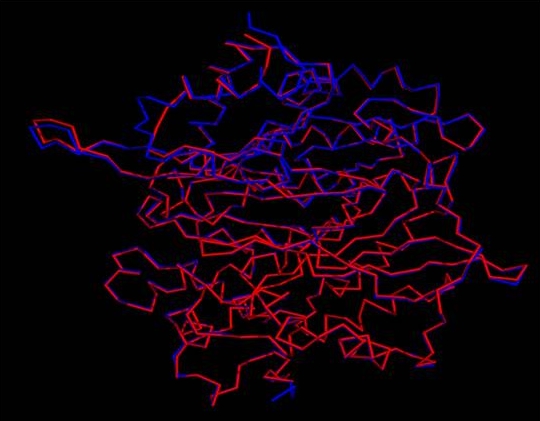
Superposition of Cα trace of Ferredoxin-nitrite reductase model from Arabidopsis thaliana (represented in red color) and 2akj (represented in blue color) by Pymol program.
Results
Comparative Modeling of Ferredoxin-nitrite reductase Model
Tertiary structure of a protein is build by packing of its secondary structure elements to form discrete domains or autonomous folding units. Comparative modeling predicts the 3-D structure of Ferredoxin-nitrite reductase Model a given protein sequence (target) based primarily on its alignment to 2akj as a template (a determined structure experimentally). The hypothetical protein models created were stored as PDB output file. This latter was visualized by Pymol program.
Validation of Protein Structures of Ferredoxin-nitrite reductase Model
The hypothetical protein models generated were analyzed online by submitting to Joint Center for Structural Genomics (JCSG), Bioinformatics core, University of California, San Diego. Accuracy of the protein model generated was judged by validity report generated by PROCHECK. Parameter comparisons of these proteins were made with well-refined structures that have similar resolution.The main chain parameters plotted are Ramachandran plot quality, peptide bond planarity, Bad non-bonded interactions, main chain hydrogen bond energy, C- alpha chirality and over-all G factor. In the Ramamchandran plot analysis, the residues were classified according o their regions in the quadrangle. The Ramachandran map for Ferredoxin-nitrite reductase model is represented in (Figure 4) and the plot statistics (see Table 1).
Figure 4.
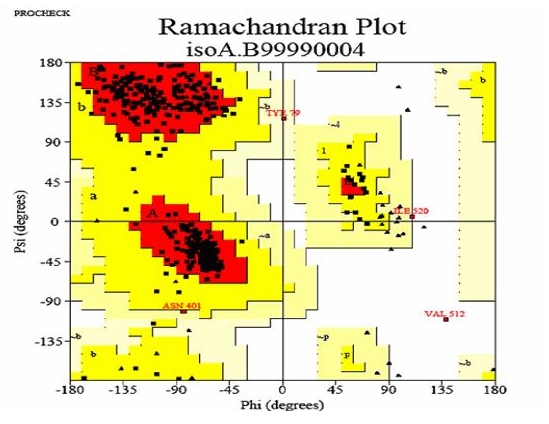
Ramachandran's Map of Ferredoxin-nitrite reductase model from Arabidopsis thaliana. The Plot calculation was done with PROCHECK program.
Discussion
Homology protein modelling uses experimentally determined protein structures (templates) to predict the 3-D of another protein that has a similar amino acid sequence (the target). This approach to modelling is possible since a small change in the protein sequence usually results in a small change in its 3D structure [11] Homology modelling remains the only modelling method that can provide models with a root mean square error lower than 2Å. The FASTA sequence Ferredoxin-nitrite reductase (EC 1.7.7.1) from Arabidopsis thaliana was obtained from NCBI. The primary requirement for reliable homology modeling is a detectable similarity between the sequence of interest (target sequence) and a known structure (template) By BLASTp query. Based on sequence similarity analysis between target and other proteins known structures showed that our Ferredoxin-nitrite reductase from Arabidopsis thaliana (2akj) has 81% of amino acid sequence identity with Ferredoxin-nitrite reductase (EC 1.7.7.1) from Spinach. Practically, at this level of sequence identity, it is good enough to use crystallographic structures of 2akj as a template in order to obtain high quality alignment for structure prediction by homology modeling. The alignment between target and 2akj_A is shown in (Figure 5).
Figure 5.
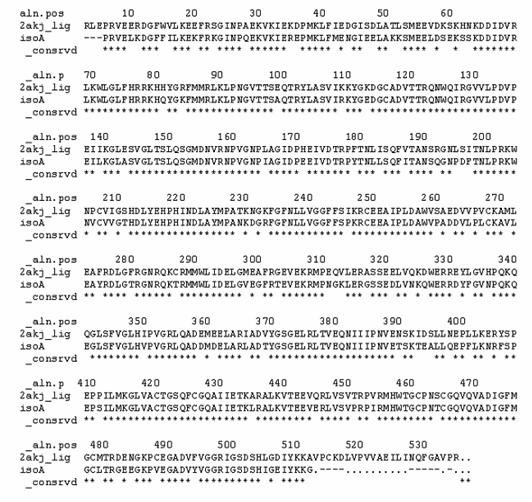
Sequence alignment of Ferredoxin-nitrite reductase model from Arabidopsis thaliana with template (PDB code: 2akj) done using MODELLER. The conserved regions are indicated by ‘*’.
Homology modeling is currently restricted to protein sequences (targets) that share 30% or more sequence identity to an experimentally solved protein structure template [12]. Under this sequence identity the reliability of the sequence alignment between target and template decreases fastly, resulting into significant modeling errors, low accuracy models should still be treated with attention. Medium accuracy models, obtained with a template-target sequence identity of 30–50%, tend to have nearly 85% of their C-α atoms within 3.5 Å of the correct position. These models often fit a variety of applications, including the testing of ligand binding states by designing site directed mutants with altered binding capacity, and computational screening of databases listing small molecules for potential lead compounds or inhibitors. Top accuracy models, based on sequence identities more than 50%, usually have structures comparable to 3 Å resolution X-ray structures and can be used for more reliable calculations as (ligand docking, drug design), however sequence identities more than 90% can be used to facilitate a meaningful biophysical description of the active site [13].
In this study were also checked for φ and ψ torsion angles using the Ramchandran plots. A comparison of the results shows that one of the models generated by Modeller program [14] is more acceptable. The molecular visualization Pymol program was used to manipulate the models based on residue interactions, energy minimization and steric hinderance. The best model predicted by Modeller (isoA 4) was used for further analysis by PROCHECK [07]. Ramachandran plot analysis showed that main-chain conformations for 99.5 % of amino acid residues are within the most favored or allowed regions, 89.9% of the residues in the most favored region, 9.2 % in the allowed and 0.5% in the generously allowed regions and only 0.5% in the disallowed region. In general, a score close to 100% implies good stereochemical quality of the models [15].
The overall general similarities and subtle difference among the 3D structure of template 2akj and predicted model isoA4 can be seen from the backbone superposition. As evident from superposition, general folding topology of the structure is similar; however, some structural differences appear between the predicted model and template. These differences are mainly due to insertion and deletions in different loop regions. The RMSD (Root Mean Square Deviation) between predicted model and template is 0.2 Å. The low RMSD between the target and template reflects the presence of strong homology (The lower the value, the more similar the structures are). The z-score indicates overall model quality and measures the deviation of the total energy of the structure with respect to an energy distribution derived from random conformations [09]. In order to facilitate interpretation of the z-score of the specified protein, its particular value is displayed in a plot that contains the zscores of all experimentally determined protein chains in current PDB. Groups of structures from different sources (X-ray, NMR) are distinguished by different colors (NMR with dark blue and X ray with light blue). This plot can be used to check whether the z-score of the protein in question is within the range of scores typically found for proteins of similar size belonging to one of these groups. It can be seen in (Figure 6) that Z-scores value of the obtained model (isoA.B99990004.pdb) of Ferredoxin-nitrite reductase (EC 1.7.7.1) from Arabidopsis thaliana (-10.37) is located within the space of proteins determined By X ray. This value is extremely closed to the value of the template (-10.54) which suggests that the obtained model is reliable and very close to experimentally determined structures.
Figure 6.
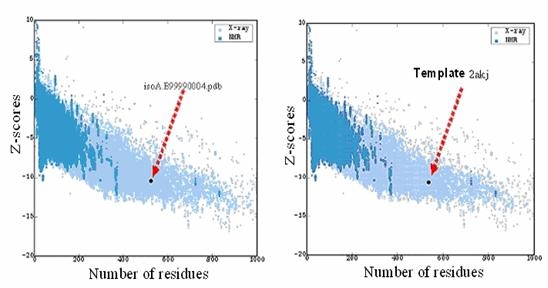
The plan of Z-Score shows spots of Z scores's values of proteins determined by NMR (represented in dark blue coulor) and by X ray (represented in light blue coulor) using PROSAII program. The two black dots represent Z-Scores of the template and our model.
Conclusion
Based on the Template structure it is clearly observed that the theoretical structure generated is structurally similar to the template structure which is highly sufficient for the development of specific ligand for Ferredoxin-nitrite reductase from Arabidopsis thaliana. Our model of NIR is only a predictive, and needs to be confirmed experimentally. This modeled structure can be used to predict the molecular function and the active sites which received less attention in previous reports.
Supplementary material
Footnotes
Citation:Kherraz et al, Bioinformation 6(3): 115-119 (2011)
References
- 1.NM Crawford, ADM Glass. Trends Plant Sci. 1998;3:389. [Google Scholar]
- 2.DB Knaff, et al. Kluwer Academic Publishers. 1996;4:333. [Google Scholar]
- 3.S Kuznetsova, et al. Biochemistry. 2004;43:10765. [Google Scholar]
- 4.J Westbrook, et al. Nucleic Acids Res. 2002;30:245. doi: 10.1093/nar/30.1.245. [DOI] [PMC free article] [PubMed] [Google Scholar]
- 5.SF Altschul, et al. Nucleic Acids Res. 1997;25:3389. doi: 10.1093/nar/25.17.3389. [DOI] [PMC free article] [PubMed] [Google Scholar]
- 6.A Fiser, et al. Protein Sci. 2000;9:1753. doi: 10.1110/ps.9.9.1753. [DOI] [PMC free article] [PubMed] [Google Scholar]
- 7.RA Laskowski, et al. J Biomol NMR. 1996;8:477. doi: 10.1007/BF00228148. [DOI] [PubMed] [Google Scholar]
- 8.AL Morris, et al. Proteins. 1992;12:345. [Google Scholar]
- 9.MJ Sippl, et al. Curr Opin Struct Biol. 1995;5:229. doi: 10.1016/0959-440x(95)80081-6. [DOI] [PubMed] [Google Scholar]
- 10.Y Zhang, J Skolnick. Proteins. 2004;57:702. doi: 10.1002/prot.20264. [DOI] [PubMed] [Google Scholar]
- 11.TJ Hubbard, TL Blundell. Protein Eng. 1:159. [Google Scholar]
- 12.D Baker, A Sali. Science. 2001;294:3. [Google Scholar]
- 13.RL Marsden, CA Orengo. Methods Mol Biol. 2008;426:3. doi: 10.1007/978-1-60327-058-8_1. [DOI] [PubMed] [Google Scholar]
- 14.A Sali, et al. Proteins. 1995;23:318. [Google Scholar]
- 15.ChS Reddy, et al. Comput Biol Chem. 2006;30:120. doi: 10.1016/j.compbiolchem.2005.12.002. [DOI] [PubMed] [Google Scholar]
Associated Data
This section collects any data citations, data availability statements, or supplementary materials included in this article.